
Key Insights
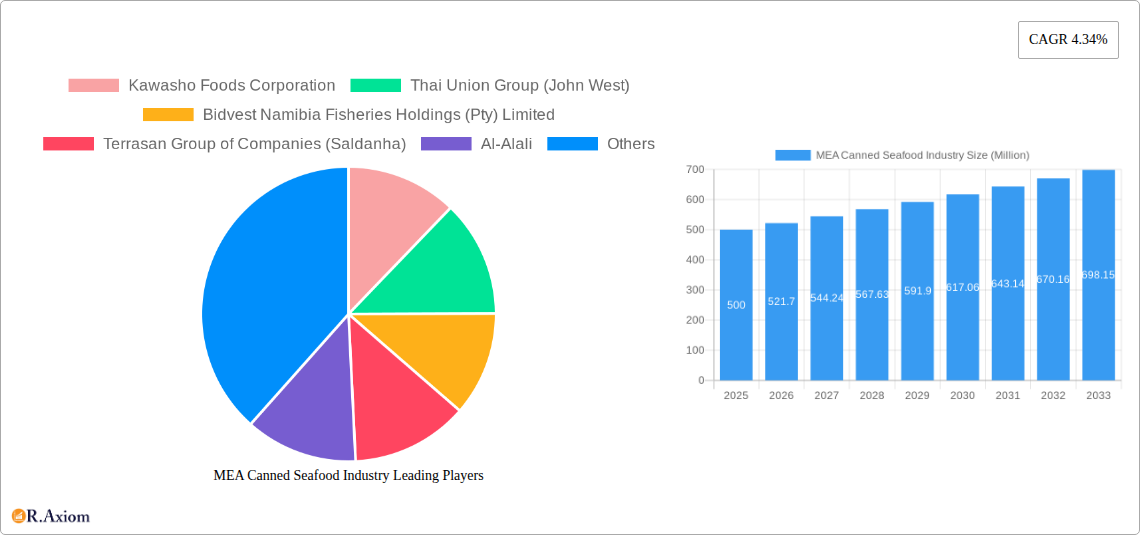
The MEA canned seafood market, encompassing countries like the United Arab Emirates, Saudi Arabia, and South Africa, presents a compelling growth opportunity. Driven by increasing urbanization, rising disposable incomes, and a growing preference for convenient and shelf-stable food options, the market exhibits a robust Compound Annual Growth Rate (CAGR) of 4.34%. The canned fish segment, including tuna, salmon, and mackerel, is anticipated to dominate the market due to its affordability and widespread acceptance across diverse consumer segments. However, the canned shrimp and prawn segments are also projected to witness significant growth, fueled by the increasing popularity of seafood in various cuisines and rising demand for high-protein diets. Supermarkets and hypermarkets currently hold the largest distribution channel share, owing to their extensive reach and established supply chains. Nevertheless, the online retail channel is demonstrating rapid expansion, driven by the increasing adoption of e-commerce and the convenience it offers to consumers. While the market faces challenges such as fluctuating seafood prices and potential supply chain disruptions, the overall outlook remains positive, promising significant expansion throughout the forecast period (2025-2033). Key players in the region, including Kawasho Foods Corporation, Thai Union Group, and Oceana Group Limited, are strategically investing in product diversification, brand building, and supply chain optimization to capitalize on the market's potential. The market's growth is also influenced by factors such as government regulations related to food safety and sustainability, which are becoming increasingly critical aspects of the industry.
The forecast for the MEA canned seafood market suggests continued expansion, with the canned fish segment retaining its leading position. Growth will be fueled by sustained increases in consumer purchasing power and a preference for convenient and nutritious food options. Furthermore, the diversification of product offerings and the exploration of innovative packaging solutions will contribute to market expansion. The increasing focus on sustainable and ethically sourced seafood will also play a significant role in shaping the market's trajectory. Companies are expected to focus on strengthening their supply chains to mitigate the impact of potential price volatility and geopolitical factors. The expansion of the online retail channel presents a significant opportunity for increased market penetration and accessibility to a broader consumer base. This continued growth necessitates that businesses prioritize innovation, operational efficiency, and a strong focus on consumer preferences to succeed in this dynamic market environment.
MEA Canned Seafood Industry: A Comprehensive Market Report (2019-2033)
This in-depth report provides a comprehensive analysis of the MEA canned seafood industry, covering market size, growth drivers, competitive landscape, and future outlook. The report utilizes data from the historical period (2019-2024), base year (2025), and estimated year (2025) to forecast market trends up to 2033. The study period covers 2019-2033, with a focus on understanding the dynamic shifts within the MEA canned seafood market. This report is essential for industry stakeholders, investors, and businesses seeking to navigate the complexities and opportunities within this growing sector.
MEA Canned Seafood Industry Market Concentration & Innovation
This section analyzes the MEA canned seafood market's concentration, innovation drivers, regulatory landscape, product substitutes, end-user trends, and mergers and acquisitions (M&A) activities. The market is moderately concentrated, with key players holding significant market share, but also characterized by a considerable number of smaller, regional players. The xx Million market value is influenced by several factors.
Market Concentration: The top five players hold an estimated xx% market share in 2025, indicating a moderately concentrated market. This is largely driven by the dominance of established brands and the economies of scale they enjoy. However, smaller, regional players continue to thrive, often focusing on niche markets and local preferences.
Innovation Drivers: Consumer demand for healthier, more sustainable, and convenient seafood products is driving innovation. This includes the development of new product formats (e.g., pouches, ready-to-eat meals), sustainable sourcing practices, and improved packaging to enhance shelf life and reduce environmental impact.
Regulatory Frameworks: Government regulations regarding food safety, labeling, and sustainable fishing practices significantly impact the industry. Compliance costs and evolving regulations necessitate continuous adaptation by market players.
Product Substitutes: Other protein sources (meat, poultry, plant-based alternatives) and fresh/frozen seafood pose competition to canned seafood. Innovation and value-added products are needed to maintain competitiveness.
End-User Trends: Growing health consciousness among consumers fuels demand for low-sodium, low-fat, and omega-3-rich canned seafood. Convenience is also a significant factor, particularly among busy urban populations.
M&A Activities: The industry has witnessed significant M&A activity in recent years, as larger players seek to expand their market reach, product portfolio, and enhance their competitive advantage. Deal values vary substantially depending on the size and strategic importance of the target company. For example, Thai Union Group's investment in Aegir Seafood exemplifies strategic acquisitions expanding product portfolios and strengthening market presence. The total M&A value for the period 2019-2024 is estimated at xx Million.
MEA Canned Seafood Industry Industry Trends & Insights
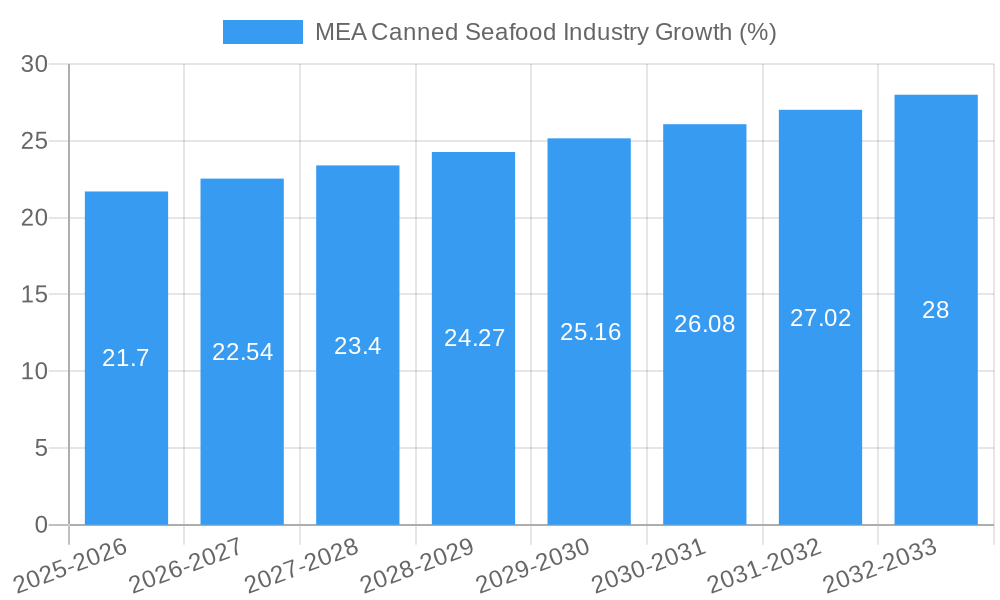
The MEA canned seafood market exhibits robust growth, driven by increasing per capita consumption, urbanization, and changing consumer preferences. Several factors contribute to these trends.
The market is experiencing steady growth, with a Compound Annual Growth Rate (CAGR) projected at xx% during the forecast period (2025-2033). This growth is fueled by several key drivers:
Rising Disposable Incomes: Increased disposable incomes in many MEA countries, especially in urban areas, are leading to higher spending on convenient and affordable protein sources like canned seafood.
Expanding Middle Class: The burgeoning middle class across the region represents a significant consumer base for canned seafood, driving demand for both mainstream and premium products.
Changing Dietary Habits: A shift towards convenient and ready-to-eat food options is boosting demand for canned seafood, particularly among younger generations.
Technological Advancements: Innovations in packaging, processing, and preservation techniques are enhancing the quality, shelf life, and convenience of canned seafood.
Health and Wellness Trends: Growing awareness of the health benefits of seafood, including omega-3 fatty acids, is propelling demand for canned seafood, particularly among health-conscious consumers. However, concerns about sodium content and added preservatives persist, challenging manufacturers to offer healthier formulations.
Competitive Dynamics: The market is characterized by both intense competition among established players and the emergence of new entrants, particularly smaller regional brands catering to specific consumer preferences and local markets. Market penetration of canned fish remains high, surpassing xx% in many countries, while canned shrimp and prawns are experiencing rapid growth, driven by strong consumer demand.
Dominant Markets & Segments in MEA Canned Seafood Industry
Within the MEA canned seafood industry, specific regions, countries, and segments demonstrate dominance due to diverse factors.
Dominant Regions: The [Specific Country/Region] market currently holds the largest market share within MEA, driven by [specific factors like high consumption, favorable economic conditions, or strong consumer preferences]. However, other regions like [Specific Country/Region] are experiencing rapid growth due to [specific factors].
Dominant Distribution Channels: Supermarkets/hypermarkets represent the largest distribution channel, capturing xx% of the market share due to extensive reach and consumer preference for organized retail. Online retailers are witnessing rapid growth, particularly in urban areas with high internet penetration, though their market share currently remains at xx%. Convenience stores play a significant role in the canned seafood market, especially in regions with higher foot traffic.
Dominant Product Types: Canned fish holds the largest market share in 2025 at xx%, predominantly due to its affordability and widespread consumption. Canned shrimp and prawns are experiencing rapid growth driven by rising consumer demand for premium seafood options. This is complemented by a gradual increase in demand for other types of canned seafood as consumers diversify their choices.
Key Drivers:
- Economic policies: Government support for fisheries and the food processing industry plays a significant role in market growth.
- Infrastructure: Improved cold chain infrastructure and transportation networks facilitate efficient distribution and reduce spoilage.
- Consumer preferences: The preferences of the local population towards particular types of seafood greatly influence market demand.
MEA Canned Seafood Industry Product Developments
The canned seafood industry is witnessing continuous product innovation to cater to evolving consumer demands. Manufacturers are focusing on developing healthier and more convenient products. This includes low-sodium options, reduced-fat variants, and the introduction of ready-to-eat meals incorporating canned seafood. Sustainability is another driving force, with an increase in products sourced from responsibly managed fisheries and utilizing eco-friendly packaging materials. The incorporation of functional ingredients, such as added vitamins and minerals, is also gaining traction. These developments reflect a move towards premiumization and value-added products.
Report Scope & Segmentation Analysis
This report segments the MEA canned seafood market based on distribution channels and product type.
Distribution Channels: Supermarkets/Hypermarkets, Convenience Stores, Online Retailers, and Other Distribution Channels. Each segment's growth projections, market sizes, and competitive dynamics are detailed within the report.
Product Types: Canned Fish, Canned Shrimp, Canned Prawns, and Other Types. Each segment’s growth projections, market sizes, and competitive dynamics are analyzed, highlighting the varying growth rates and market shares of each segment. Market size projections for each segment from 2025 to 2033 are included.
Key Drivers of MEA Canned Seafood Industry Growth
The MEA canned seafood market's growth is propelled by several factors. Firstly, increasing urbanization leads to higher demand for convenient food options. Secondly, rising disposable incomes enable consumers to spend more on protein-rich food, including canned seafood. Thirdly, growing health awareness, promoting seafood consumption for its nutritional benefits, fuels market growth. Lastly, improvements in packaging technology and distribution networks enhance shelf life and accessibility, widening the market reach of canned seafood.
Challenges in the MEA Canned Seafood Industry Sector
The industry faces several challenges, including fluctuating raw material prices affecting profitability, stringent regulatory requirements increasing compliance costs, and potential disruptions in the supply chain impacting product availability. Intense competition among existing players and the rise of new entrants pose further challenges. Additionally, concerns regarding sustainability and responsible fishing practices present ongoing challenges for businesses seeking to maintain a positive image and consumer confidence.
Emerging Opportunities in MEA Canned Seafood Industry
Several opportunities are emerging for the MEA canned seafood industry. The increasing demand for sustainable and ethically sourced seafood presents opportunities for businesses prioritizing these aspects. The growth of e-commerce platforms opens new avenues for market expansion and improved accessibility. Furthermore, innovations in product packaging and formulation, such as convenient ready-to-eat options and value-added products, can unlock further growth potential. Finally, exploring new markets within the MEA region presents significant growth opportunities.
Leading Players in the MEA Canned Seafood Industry Market
- Kawasho Foods Corporation
- Thai Union Group (John West) Thai Union Group
- Bidvest Namibia Fisheries Holdings (Pty) Limited
- Terrasan Group of Companies (Saldanha)
- Al-Alali
- Shrimp Nation
- Oceana Group Limited Oceana Group
- Bolton Group B V
- Trident Seafood Corporation
- American Tuna Inc
Key Developments in MEA Canned Seafood Industry Industry
- November 2022: Thai Union Group's acquisition of a 50% stake in Aegir Seafood significantly expands its product portfolio and strengthens its market position.
- April 2022: Shrimp Nation's expansion into the UAE demonstrates the growing demand for high-quality seafood in the region.
- August 2021: Bolton Group B.V.'s acquisition of Wild Planet Foods strengthens its commitment to sustainable seafood production and expands its global reach.
Strategic Outlook for MEA Canned Seafood Industry Market
The MEA canned seafood market is poised for continued growth, driven by sustained economic development, urbanization, and evolving consumer preferences. Strategic investments in sustainable sourcing, innovative product development, and robust distribution networks are crucial for success. The focus on health and wellness will shape product innovation, leading to an increased demand for premium and healthier options. The utilization of e-commerce channels and diversification into new markets will contribute to market expansion in the years to come. Companies adopting agile strategies to adapt to changing consumer needs and market dynamics are best positioned for future success.
MEA Canned Seafood Industry Segmentation
-
1. Type
-
1.1. Canned Fish
- 1.1.1. Tuna
- 1.1.2. Salmon
- 1.1.3. Sardines
- 1.1.4. Mackrel
- 1.2. Canned Shrimp
- 1.3. Canned Prawns
- 1.4. Other Types
-
1.1. Canned Fish
-
2. Distribution Channel
- 2.1. Supermarkets/Hypermarkets
- 2.2. Convenience Stores
- 2.3. Online Retailers
- 2.4. Other Distruibution Channels
-
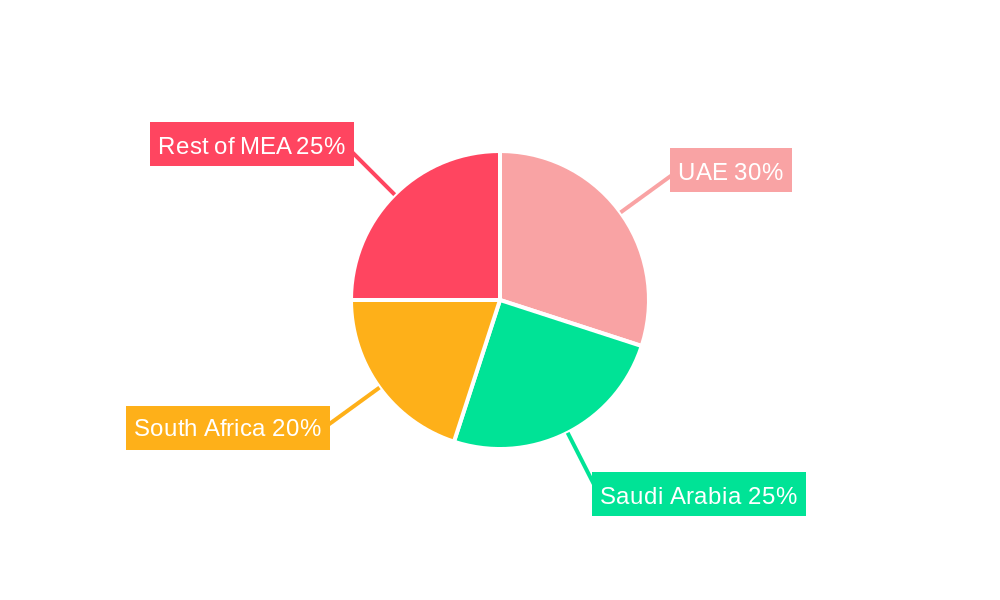
3. Geography
- 3.1. United Arab Emirates
- 3.2. South Africa
- 3.3. Rest of the Middle East and Africa
MEA Canned Seafood Industry Segmentation By Geography
- 1. United Arab Emirates
- 2. South Africa
- 3. Rest of the Middle East and Africa
MEA Canned Seafood Industry REPORT HIGHLIGHTS
| Aspects | Details |
|---|---|
| Study Period | 2019-2033 |
| Base Year | 2024 |
| Estimated Year | 2025 |
| Forecast Period | 2025-2033 |
| Historical Period | 2019-2024 |
| Growth Rate | CAGR of 4.34% from 2019-2033 |
| Segmentation |
|
Table of Contents
- 1. Introduction
- 1.1. Research Scope
- 1.2. Market Segmentation
- 1.3. Research Methodology
- 1.4. Definitions and Assumptions
- 2. Executive Summary
- 2.1. Introduction
- 3. Market Dynamics
- 3.1. Introduction
- 3.2. Market Drivers
- 3.2.1. Increasing Consumer Demand for Convenient Food such as Canned seafood
- 3.3. Market Restrains
- 3.3.1. Many consumers perceive fresh seafood as healthier compared to canned options
- 3.4. Market Trends
- 3.4.1. Growing Popularity For Seafood Among Meat Products
- 4. Market Factor Analysis
- 4.1. Porters Five Forces
- 4.2. Supply/Value Chain
- 4.3. PESTEL analysis
- 4.4. Market Entropy
- 4.5. Patent/Trademark Analysis
- 5. Global MEA Canned Seafood Industry Analysis, Insights and Forecast, 2019-2031
- 5.1. Market Analysis, Insights and Forecast - by Type
- 5.1.1. Canned Fish
- 5.1.1.1. Tuna
- 5.1.1.2. Salmon
- 5.1.1.3. Sardines
- 5.1.1.4. Mackrel
- 5.1.2. Canned Shrimp
- 5.1.3. Canned Prawns
- 5.1.4. Other Types
- 5.1.1. Canned Fish
- 5.2. Market Analysis, Insights and Forecast - by Distribution Channel
- 5.2.1. Supermarkets/Hypermarkets
- 5.2.2. Convenience Stores
- 5.2.3. Online Retailers
- 5.2.4. Other Distruibution Channels
- 5.3. Market Analysis, Insights and Forecast - by Geography
- 5.3.1. United Arab Emirates
- 5.3.2. South Africa
- 5.3.3. Rest of the Middle East and Africa
- 5.4. Market Analysis, Insights and Forecast - by Region
- 5.4.1. United Arab Emirates
- 5.4.2. South Africa
- 5.4.3. Rest of the Middle East and Africa
- 5.1. Market Analysis, Insights and Forecast - by Type
- 6. United Arab Emirates MEA Canned Seafood Industry Analysis, Insights and Forecast, 2019-2031
- 6.1. Market Analysis, Insights and Forecast - by Type
- 6.1.1. Canned Fish
- 6.1.1.1. Tuna
- 6.1.1.2. Salmon
- 6.1.1.3. Sardines
- 6.1.1.4. Mackrel
- 6.1.2. Canned Shrimp
- 6.1.3. Canned Prawns
- 6.1.4. Other Types
- 6.1.1. Canned Fish
- 6.2. Market Analysis, Insights and Forecast - by Distribution Channel
- 6.2.1. Supermarkets/Hypermarkets
- 6.2.2. Convenience Stores
- 6.2.3. Online Retailers
- 6.2.4. Other Distruibution Channels
- 6.3. Market Analysis, Insights and Forecast - by Geography
- 6.3.1. United Arab Emirates
- 6.3.2. South Africa
- 6.3.3. Rest of the Middle East and Africa
- 6.1. Market Analysis, Insights and Forecast - by Type
- 7. South Africa MEA Canned Seafood Industry Analysis, Insights and Forecast, 2019-2031
- 7.1. Market Analysis, Insights and Forecast - by Type
- 7.1.1. Canned Fish
- 7.1.1.1. Tuna
- 7.1.1.2. Salmon
- 7.1.1.3. Sardines
- 7.1.1.4. Mackrel
- 7.1.2. Canned Shrimp
- 7.1.3. Canned Prawns
- 7.1.4. Other Types
- 7.1.1. Canned Fish
- 7.2. Market Analysis, Insights and Forecast - by Distribution Channel
- 7.2.1. Supermarkets/Hypermarkets
- 7.2.2. Convenience Stores
- 7.2.3. Online Retailers
- 7.2.4. Other Distruibution Channels
- 7.3. Market Analysis, Insights and Forecast - by Geography
- 7.3.1. United Arab Emirates
- 7.3.2. South Africa
- 7.3.3. Rest of the Middle East and Africa
- 7.1. Market Analysis, Insights and Forecast - by Type
- 8. Rest of the Middle East and Africa MEA Canned Seafood Industry Analysis, Insights and Forecast, 2019-2031
- 8.1. Market Analysis, Insights and Forecast - by Type
- 8.1.1. Canned Fish
- 8.1.1.1. Tuna
- 8.1.1.2. Salmon
- 8.1.1.3. Sardines
- 8.1.1.4. Mackrel
- 8.1.2. Canned Shrimp
- 8.1.3. Canned Prawns
- 8.1.4. Other Types
- 8.1.1. Canned Fish
- 8.2. Market Analysis, Insights and Forecast - by Distribution Channel
- 8.2.1. Supermarkets/Hypermarkets
- 8.2.2. Convenience Stores
- 8.2.3. Online Retailers
- 8.2.4. Other Distruibution Channels
- 8.3. Market Analysis, Insights and Forecast - by Geography
- 8.3.1. United Arab Emirates
- 8.3.2. South Africa
- 8.3.3. Rest of the Middle East and Africa
- 8.1. Market Analysis, Insights and Forecast - by Type
- 9. United Arab Emirates MEA Canned Seafood Industry Analysis, Insights and Forecast, 2019-2031
- 10. Saudi Arabia MEA Canned Seafood Industry Analysis, Insights and Forecast, 2019-2031
- 11. South Africa MEA Canned Seafood Industry Analysis, Insights and Forecast, 2019-2031
- 12. Rest of Middle East and Africa MEA Canned Seafood Industry Analysis, Insights and Forecast, 2019-2031
- 13. Competitive Analysis
- 13.1. Global Market Share Analysis 2024
- 13.2. Company Profiles
- 13.2.1 Kawasho Foods Corporation
- 13.2.1.1. Overview
- 13.2.1.2. Products
- 13.2.1.3. SWOT Analysis
- 13.2.1.4. Recent Developments
- 13.2.1.5. Financials (Based on Availability)
- 13.2.2 Thai Union Group (John West)
- 13.2.2.1. Overview
- 13.2.2.2. Products
- 13.2.2.3. SWOT Analysis
- 13.2.2.4. Recent Developments
- 13.2.2.5. Financials (Based on Availability)
- 13.2.3 Bidvest Namibia Fisheries Holdings (Pty) Limited
- 13.2.3.1. Overview
- 13.2.3.2. Products
- 13.2.3.3. SWOT Analysis
- 13.2.3.4. Recent Developments
- 13.2.3.5. Financials (Based on Availability)
- 13.2.4 Terrasan Group of Companies (Saldanha)
- 13.2.4.1. Overview
- 13.2.4.2. Products
- 13.2.4.3. SWOT Analysis
- 13.2.4.4. Recent Developments
- 13.2.4.5. Financials (Based on Availability)
- 13.2.5 Al-Alali
- 13.2.5.1. Overview
- 13.2.5.2. Products
- 13.2.5.3. SWOT Analysis
- 13.2.5.4. Recent Developments
- 13.2.5.5. Financials (Based on Availability)
- 13.2.6 Shrimp Nation
- 13.2.6.1. Overview
- 13.2.6.2. Products
- 13.2.6.3. SWOT Analysis
- 13.2.6.4. Recent Developments
- 13.2.6.5. Financials (Based on Availability)
- 13.2.7 Oceana Group Limited
- 13.2.7.1. Overview
- 13.2.7.2. Products
- 13.2.7.3. SWOT Analysis
- 13.2.7.4. Recent Developments
- 13.2.7.5. Financials (Based on Availability)
- 13.2.8 Bolton Group B V
- 13.2.8.1. Overview
- 13.2.8.2. Products
- 13.2.8.3. SWOT Analysis
- 13.2.8.4. Recent Developments
- 13.2.8.5. Financials (Based on Availability)
- 13.2.9 Trident Seafood Corporation
- 13.2.9.1. Overview
- 13.2.9.2. Products
- 13.2.9.3. SWOT Analysis
- 13.2.9.4. Recent Developments
- 13.2.9.5. Financials (Based on Availability)
- 13.2.10 American Tuna Inc
- 13.2.10.1. Overview
- 13.2.10.2. Products
- 13.2.10.3. SWOT Analysis
- 13.2.10.4. Recent Developments
- 13.2.10.5. Financials (Based on Availability)
- 13.2.1 Kawasho Foods Corporation
List of Figures
- Figure 1: Global MEA Canned Seafood Industry Revenue Breakdown (Million, %) by Region 2024 & 2032
- Figure 2: Global MEA Canned Seafood Industry Volume Breakdown (K Tons, %) by Region 2024 & 2032
- Figure 3: MEA MEA Canned Seafood Industry Revenue (Million), by Country 2024 & 2032
- Figure 4: MEA MEA Canned Seafood Industry Volume (K Tons), by Country 2024 & 2032
- Figure 5: MEA MEA Canned Seafood Industry Revenue Share (%), by Country 2024 & 2032
- Figure 6: MEA MEA Canned Seafood Industry Volume Share (%), by Country 2024 & 2032
- Figure 7: United Arab Emirates MEA Canned Seafood Industry Revenue (Million), by Type 2024 & 2032
- Figure 8: United Arab Emirates MEA Canned Seafood Industry Volume (K Tons), by Type 2024 & 2032
- Figure 9: United Arab Emirates MEA Canned Seafood Industry Revenue Share (%), by Type 2024 & 2032
- Figure 10: United Arab Emirates MEA Canned Seafood Industry Volume Share (%), by Type 2024 & 2032
- Figure 11: United Arab Emirates MEA Canned Seafood Industry Revenue (Million), by Distribution Channel 2024 & 2032
- Figure 12: United Arab Emirates MEA Canned Seafood Industry Volume (K Tons), by Distribution Channel 2024 & 2032
- Figure 13: United Arab Emirates MEA Canned Seafood Industry Revenue Share (%), by Distribution Channel 2024 & 2032
- Figure 14: United Arab Emirates MEA Canned Seafood Industry Volume Share (%), by Distribution Channel 2024 & 2032
- Figure 15: United Arab Emirates MEA Canned Seafood Industry Revenue (Million), by Geography 2024 & 2032
- Figure 16: United Arab Emirates MEA Canned Seafood Industry Volume (K Tons), by Geography 2024 & 2032
- Figure 17: United Arab Emirates MEA Canned Seafood Industry Revenue Share (%), by Geography 2024 & 2032
- Figure 18: United Arab Emirates MEA Canned Seafood Industry Volume Share (%), by Geography 2024 & 2032
- Figure 19: United Arab Emirates MEA Canned Seafood Industry Revenue (Million), by Country 2024 & 2032
- Figure 20: United Arab Emirates MEA Canned Seafood Industry Volume (K Tons), by Country 2024 & 2032
- Figure 21: United Arab Emirates MEA Canned Seafood Industry Revenue Share (%), by Country 2024 & 2032
- Figure 22: United Arab Emirates MEA Canned Seafood Industry Volume Share (%), by Country 2024 & 2032
- Figure 23: South Africa MEA Canned Seafood Industry Revenue (Million), by Type 2024 & 2032
- Figure 24: South Africa MEA Canned Seafood Industry Volume (K Tons), by Type 2024 & 2032
- Figure 25: South Africa MEA Canned Seafood Industry Revenue Share (%), by Type 2024 & 2032
- Figure 26: South Africa MEA Canned Seafood Industry Volume Share (%), by Type 2024 & 2032
- Figure 27: South Africa MEA Canned Seafood Industry Revenue (Million), by Distribution Channel 2024 & 2032
- Figure 28: South Africa MEA Canned Seafood Industry Volume (K Tons), by Distribution Channel 2024 & 2032
- Figure 29: South Africa MEA Canned Seafood Industry Revenue Share (%), by Distribution Channel 2024 & 2032
- Figure 30: South Africa MEA Canned Seafood Industry Volume Share (%), by Distribution Channel 2024 & 2032
- Figure 31: South Africa MEA Canned Seafood Industry Revenue (Million), by Geography 2024 & 2032
- Figure 32: South Africa MEA Canned Seafood Industry Volume (K Tons), by Geography 2024 & 2032
- Figure 33: South Africa MEA Canned Seafood Industry Revenue Share (%), by Geography 2024 & 2032
- Figure 34: South Africa MEA Canned Seafood Industry Volume Share (%), by Geography 2024 & 2032
- Figure 35: South Africa MEA Canned Seafood Industry Revenue (Million), by Country 2024 & 2032
- Figure 36: South Africa MEA Canned Seafood Industry Volume (K Tons), by Country 2024 & 2032
- Figure 37: South Africa MEA Canned Seafood Industry Revenue Share (%), by Country 2024 & 2032
- Figure 38: South Africa MEA Canned Seafood Industry Volume Share (%), by Country 2024 & 2032
- Figure 39: Rest of the Middle East and Africa MEA Canned Seafood Industry Revenue (Million), by Type 2024 & 2032
- Figure 40: Rest of the Middle East and Africa MEA Canned Seafood Industry Volume (K Tons), by Type 2024 & 2032
- Figure 41: Rest of the Middle East and Africa MEA Canned Seafood Industry Revenue Share (%), by Type 2024 & 2032
- Figure 42: Rest of the Middle East and Africa MEA Canned Seafood Industry Volume Share (%), by Type 2024 & 2032
- Figure 43: Rest of the Middle East and Africa MEA Canned Seafood Industry Revenue (Million), by Distribution Channel 2024 & 2032
- Figure 44: Rest of the Middle East and Africa MEA Canned Seafood Industry Volume (K Tons), by Distribution Channel 2024 & 2032
- Figure 45: Rest of the Middle East and Africa MEA Canned Seafood Industry Revenue Share (%), by Distribution Channel 2024 & 2032
- Figure 46: Rest of the Middle East and Africa MEA Canned Seafood Industry Volume Share (%), by Distribution Channel 2024 & 2032
- Figure 47: Rest of the Middle East and Africa MEA Canned Seafood Industry Revenue (Million), by Geography 2024 & 2032
- Figure 48: Rest of the Middle East and Africa MEA Canned Seafood Industry Volume (K Tons), by Geography 2024 & 2032
- Figure 49: Rest of the Middle East and Africa MEA Canned Seafood Industry Revenue Share (%), by Geography 2024 & 2032
- Figure 50: Rest of the Middle East and Africa MEA Canned Seafood Industry Volume Share (%), by Geography 2024 & 2032
- Figure 51: Rest of the Middle East and Africa MEA Canned Seafood Industry Revenue (Million), by Country 2024 & 2032
- Figure 52: Rest of the Middle East and Africa MEA Canned Seafood Industry Volume (K Tons), by Country 2024 & 2032
- Figure 53: Rest of the Middle East and Africa MEA Canned Seafood Industry Revenue Share (%), by Country 2024 & 2032
- Figure 54: Rest of the Middle East and Africa MEA Canned Seafood Industry Volume Share (%), by Country 2024 & 2032
List of Tables
- Table 1: Global MEA Canned Seafood Industry Revenue Million Forecast, by Region 2019 & 2032
- Table 2: Global MEA Canned Seafood Industry Volume K Tons Forecast, by Region 2019 & 2032
- Table 3: Global MEA Canned Seafood Industry Revenue Million Forecast, by Type 2019 & 2032
- Table 4: Global MEA Canned Seafood Industry Volume K Tons Forecast, by Type 2019 & 2032
- Table 5: Global MEA Canned Seafood Industry Revenue Million Forecast, by Distribution Channel 2019 & 2032
- Table 6: Global MEA Canned Seafood Industry Volume K Tons Forecast, by Distribution Channel 2019 & 2032
- Table 7: Global MEA Canned Seafood Industry Revenue Million Forecast, by Geography 2019 & 2032
- Table 8: Global MEA Canned Seafood Industry Volume K Tons Forecast, by Geography 2019 & 2032
- Table 9: Global MEA Canned Seafood Industry Revenue Million Forecast, by Region 2019 & 2032
- Table 10: Global MEA Canned Seafood Industry Volume K Tons Forecast, by Region 2019 & 2032
- Table 11: Global MEA Canned Seafood Industry Revenue Million Forecast, by Country 2019 & 2032
- Table 12: Global MEA Canned Seafood Industry Volume K Tons Forecast, by Country 2019 & 2032
- Table 13: United Arab Emirates MEA Canned Seafood Industry Revenue (Million) Forecast, by Application 2019 & 2032
- Table 14: United Arab Emirates MEA Canned Seafood Industry Volume (K Tons) Forecast, by Application 2019 & 2032
- Table 15: Saudi Arabia MEA Canned Seafood Industry Revenue (Million) Forecast, by Application 2019 & 2032
- Table 16: Saudi Arabia MEA Canned Seafood Industry Volume (K Tons) Forecast, by Application 2019 & 2032
- Table 17: South Africa MEA Canned Seafood Industry Revenue (Million) Forecast, by Application 2019 & 2032
- Table 18: South Africa MEA Canned Seafood Industry Volume (K Tons) Forecast, by Application 2019 & 2032
- Table 19: Rest of Middle East and Africa MEA Canned Seafood Industry Revenue (Million) Forecast, by Application 2019 & 2032
- Table 20: Rest of Middle East and Africa MEA Canned Seafood Industry Volume (K Tons) Forecast, by Application 2019 & 2032
- Table 21: Global MEA Canned Seafood Industry Revenue Million Forecast, by Type 2019 & 2032
- Table 22: Global MEA Canned Seafood Industry Volume K Tons Forecast, by Type 2019 & 2032
- Table 23: Global MEA Canned Seafood Industry Revenue Million Forecast, by Distribution Channel 2019 & 2032
- Table 24: Global MEA Canned Seafood Industry Volume K Tons Forecast, by Distribution Channel 2019 & 2032
- Table 25: Global MEA Canned Seafood Industry Revenue Million Forecast, by Geography 2019 & 2032
- Table 26: Global MEA Canned Seafood Industry Volume K Tons Forecast, by Geography 2019 & 2032
- Table 27: Global MEA Canned Seafood Industry Revenue Million Forecast, by Country 2019 & 2032
- Table 28: Global MEA Canned Seafood Industry Volume K Tons Forecast, by Country 2019 & 2032
- Table 29: Global MEA Canned Seafood Industry Revenue Million Forecast, by Type 2019 & 2032
- Table 30: Global MEA Canned Seafood Industry Volume K Tons Forecast, by Type 2019 & 2032
- Table 31: Global MEA Canned Seafood Industry Revenue Million Forecast, by Distribution Channel 2019 & 2032
- Table 32: Global MEA Canned Seafood Industry Volume K Tons Forecast, by Distribution Channel 2019 & 2032
- Table 33: Global MEA Canned Seafood Industry Revenue Million Forecast, by Geography 2019 & 2032
- Table 34: Global MEA Canned Seafood Industry Volume K Tons Forecast, by Geography 2019 & 2032
- Table 35: Global MEA Canned Seafood Industry Revenue Million Forecast, by Country 2019 & 2032
- Table 36: Global MEA Canned Seafood Industry Volume K Tons Forecast, by Country 2019 & 2032
- Table 37: Global MEA Canned Seafood Industry Revenue Million Forecast, by Type 2019 & 2032
- Table 38: Global MEA Canned Seafood Industry Volume K Tons Forecast, by Type 2019 & 2032
- Table 39: Global MEA Canned Seafood Industry Revenue Million Forecast, by Distribution Channel 2019 & 2032
- Table 40: Global MEA Canned Seafood Industry Volume K Tons Forecast, by Distribution Channel 2019 & 2032
- Table 41: Global MEA Canned Seafood Industry Revenue Million Forecast, by Geography 2019 & 2032
- Table 42: Global MEA Canned Seafood Industry Volume K Tons Forecast, by Geography 2019 & 2032
- Table 43: Global MEA Canned Seafood Industry Revenue Million Forecast, by Country 2019 & 2032
- Table 44: Global MEA Canned Seafood Industry Volume K Tons Forecast, by Country 2019 & 2032
Frequently Asked Questions
1. What is the projected Compound Annual Growth Rate (CAGR) of the MEA Canned Seafood Industry?
The projected CAGR is approximately 4.34%.
2. Which companies are prominent players in the MEA Canned Seafood Industry?
Key companies in the market include Kawasho Foods Corporation, Thai Union Group (John West), Bidvest Namibia Fisheries Holdings (Pty) Limited, Terrasan Group of Companies (Saldanha), Al-Alali, Shrimp Nation, Oceana Group Limited, Bolton Group B V, Trident Seafood Corporation, American Tuna Inc.
3. What are the main segments of the MEA Canned Seafood Industry?
The market segments include Type, Distribution Channel, Geography.
4. Can you provide details about the market size?
The market size is estimated to be USD XX Million as of 2022.
5. What are some drivers contributing to market growth?
Increasing Consumer Demand for Convenient Food such as Canned seafood.
6. What are the notable trends driving market growth?
Growing Popularity For Seafood Among Meat Products.
7. Are there any restraints impacting market growth?
Many consumers perceive fresh seafood as healthier compared to canned options.
8. Can you provide examples of recent developments in the market?
November 2022: Thai Union Group converted its loan-based strategic investment in Aegir Seafood into a 50% shareholding, further strengthening the successful business relationship between the two companies. Since Thai Union's initial investment in 2019, Aegir Seafood has made a substantial contribution to the growth of Thai Union's brands and private label business, particularly for King Oscar and Rügen Fisch. This acquisition has allowed Thai Union Group to expand its product portfolio to include high-quality cod liver, which is a premium product that complements its existing range of seafood products.
9. What pricing options are available for accessing the report?
Pricing options include single-user, multi-user, and enterprise licenses priced at USD 4750, USD 5250, and USD 8750 respectively.
10. Is the market size provided in terms of value or volume?
The market size is provided in terms of value, measured in Million and volume, measured in K Tons.
11. Are there any specific market keywords associated with the report?
Yes, the market keyword associated with the report is "MEA Canned Seafood Industry," which aids in identifying and referencing the specific market segment covered.
12. How do I determine which pricing option suits my needs best?
The pricing options vary based on user requirements and access needs. Individual users may opt for single-user licenses, while businesses requiring broader access may choose multi-user or enterprise licenses for cost-effective access to the report.
13. Are there any additional resources or data provided in the MEA Canned Seafood Industry report?
While the report offers comprehensive insights, it's advisable to review the specific contents or supplementary materials provided to ascertain if additional resources or data are available.
14. How can I stay updated on further developments or reports in the MEA Canned Seafood Industry?
To stay informed about further developments, trends, and reports in the MEA Canned Seafood Industry, consider subscribing to industry newsletters, following relevant companies and organizations, or regularly checking reputable industry news sources and publications.
Methodology
Step 1 - Identification of Relevant Samples Size from Population Database


Step 2 - Approaches for Defining Global Market Size (Value, Volume* & Price*)

Note*: In applicable scenarios
Step 3 - Data Sources
Primary Research
- Web Analytics
- Survey Reports
- Research Institute
- Latest Research Reports
- Opinion Leaders
Secondary Research
- Annual Reports
- White Paper
- Latest Press Release
- Industry Association
- Paid Database
- Investor Presentations

Step 4 - Data Triangulation
Involves using different sources of information in order to increase the validity of a study
These sources are likely to be stakeholders in a program - participants, other researchers, program staff, other community members, and so on.
Then we put all data in single framework & apply various statistical tools to find out the dynamic on the market.
During the analysis stage, feedback from the stakeholder groups would be compared to determine areas of agreement as well as areas of divergence


