
Key Insights
The MEA Freeze-Dried Food Products market, while smaller than established regions like North America or Europe, presents a compelling growth opportunity. Driven by factors such as rising disposable incomes, increasing urbanization, and a growing preference for convenient and healthy food options, the market is expected to experience significant expansion over the forecast period (2025-2033). The 6.19% CAGR observed globally suggests a similar, if not slightly higher, growth trajectory for the MEA region, considering the increasing demand for longer shelf-life products in regions with less-developed cold chain infrastructure. Key segments within the MEA market are likely to be freeze-dried fruits and vegetables, catering to health-conscious consumers, and freeze-dried prepared foods, appealing to busy lifestyles. Online retail channels are expected to witness faster growth compared to traditional channels, aligning with the increasing penetration of e-commerce across the region. While challenges such as price sensitivity and limited awareness of freeze-dried food benefits exist, strategic marketing efforts highlighting the nutritional value and convenience of these products can help overcome these restraints. The market’s growth will be further fueled by government initiatives promoting food security and the rise of food processing industries within the region.
The leading players in the global freeze-dried food market, such as Nestlé and Asahi Group Holdings, have the potential to significantly impact the MEA market through increased investment and product diversification. However, local and regional players will also play a crucial role, catering to specific consumer preferences and adapting products to local tastes. The market segmentation by product type (fruits, vegetables, beverages, dairy, meat, prepared foods) and distribution channel (supermarkets, convenience stores, online retail) provides opportunities for targeted marketing strategies. Further research into specific country-level market dynamics within the MEA region—examining factors such as consumer behavior, regulatory landscapes, and infrastructure development in countries like the UAE, Saudi Arabia, and South Africa—is crucial for a deeper understanding of market potential and for formulating effective entry strategies.
MEA Freeze Dried Food Products Market: A Comprehensive Market Report (2019-2033)
This comprehensive report provides a detailed analysis of the MEA Freeze Dried Food Products Market, offering valuable insights for industry stakeholders, investors, and businesses seeking to navigate this dynamic sector. The study period spans from 2019 to 2033, with 2025 serving as the base and estimated year. The report leverages extensive market research, incorporating quantitative and qualitative data to offer a holistic understanding of the market's current state and future trajectory. The total market value in 2025 is estimated at xx Million.
MEA Freeze Dried Food Products Market Concentration & Innovation
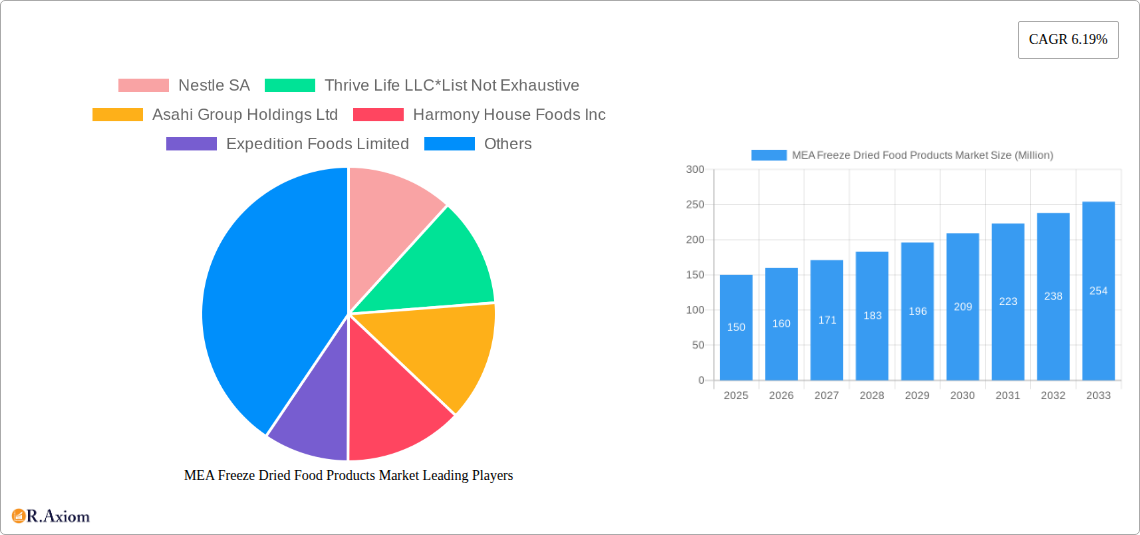
This section analyzes the MEA Freeze Dried Food Products Market's competitive landscape, focusing on market concentration, innovation drivers, and regulatory influences. We examine the impact of mergers and acquisitions (M&A) activities, analyzing deal values and their effect on market share distribution. The market is characterized by a moderately consolidated structure, with key players such as Nestle SA, Asahi Group Holdings Ltd, and Thrive Life LLC holding significant market share. However, a number of smaller, specialized companies also contribute significantly to the overall market. Innovation is driven by consumer demand for convenient, healthy, and shelf-stable food options, leading to the development of new product formats and technologies. The regulatory framework, encompassing food safety and labeling regulations, significantly impacts market dynamics. Product substitutes, such as canned or frozen foods, exert competitive pressure. End-user trends, including the rising popularity of outdoor activities and prepared meals, are fueling market growth.
- Market Concentration: The Herfindahl-Hirschman Index (HHI) is estimated at xx, indicating a moderately concentrated market.
- M&A Activity: Significant M&A activity has been observed in recent years, with deals valued at an estimated xx Million in the past five years. For instance, Asahi Group Holdings Ltd's acquisition of a majority stake in OFD Foods Inc exemplifies strategic consolidation within the market.
- Innovation Drivers: Consumer demand for convenience, health, and sustainability are key innovation drivers.
- Regulatory Landscape: Stringent food safety and labeling regulations influence product development and market access.
- Product Substitutes: Canned and frozen foods pose a significant competitive threat.
MEA Freeze Dried Food Products Market Industry Trends & Insights
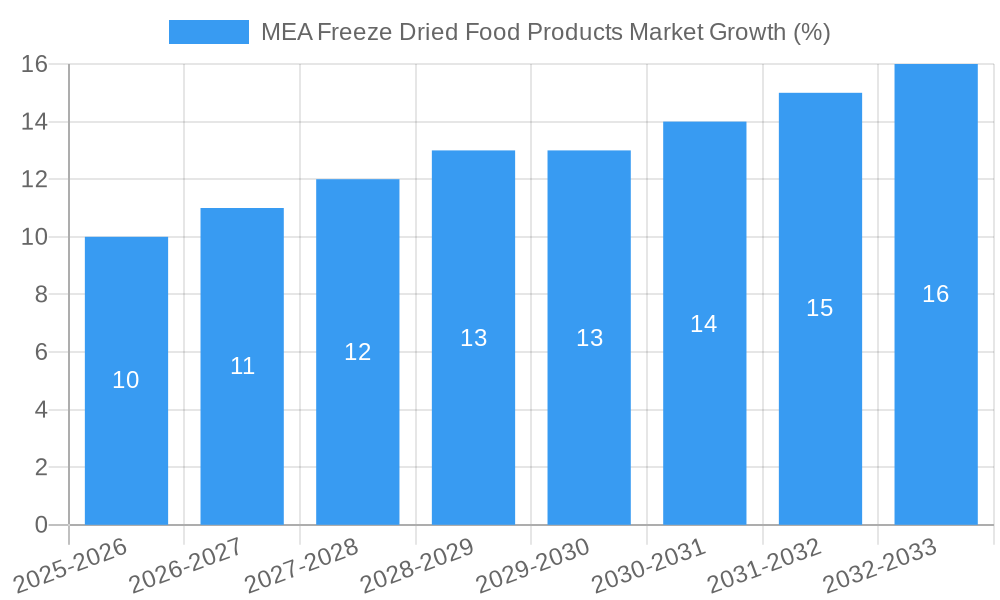
The MEA Freeze Dried Food Products Market is experiencing robust growth, driven by several factors. The market's Compound Annual Growth Rate (CAGR) during the forecast period (2025-2033) is projected to be xx%. This growth is fueled by rising consumer demand for convenient, long-shelf-life food options. Technological advancements in freeze-drying technology are also enhancing product quality and expanding applications. Changing consumer preferences, such as a growing preference for healthy and nutritious food choices, further contribute to market expansion. The competitive landscape is dynamic, with existing players expanding their product portfolios and new entrants emerging. Market penetration of freeze-dried products in the MEA region remains relatively low, presenting significant opportunities for future growth. Increased adoption of e-commerce platforms presents a key distribution opportunity.
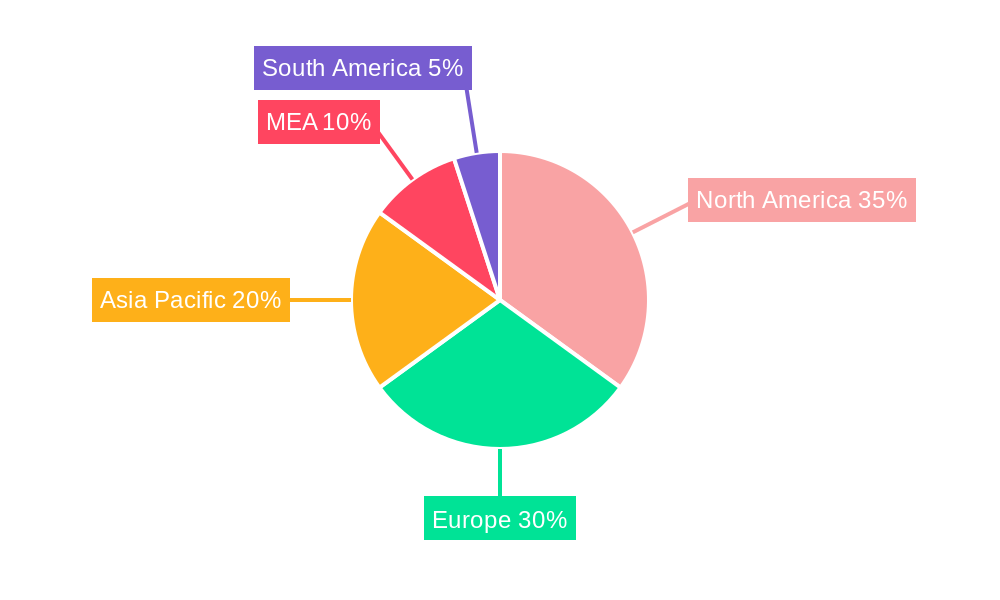
Dominant Markets & Segments in MEA Freeze Dried Food Products Market
The MEA Freeze Dried Food Products Market displays regional variations in growth and dominance. While specific market share data by country is unavailable, it's projected that [mention a specific country or region with predicted market dominance based on available data - e.g., the UAE or Saudi Arabia], will demonstrate the strongest growth during the forecast period due to increasing disposable incomes and a growing middle class with a preference for convenient food options.
By Product Type:
- Freeze-dried Fruits: This segment holds a significant share, driven by the increasing demand for healthy snacks and the long shelf-life of the product.
- Freeze-dried Vegetables: This segment shows promising growth potential due to the growing awareness of the nutritional benefits of vegetables and convenience in preparation.
- Freeze-dried Beverages: This segment is experiencing strong growth, propelled by increasing demand for convenient and on-the-go beverages.
- Other Freeze-dried Products: Freeze-dried dairy, meat, seafood and prepared meals represent growing niche segments.
By Distribution Channel:
- Supermarkets/Hypermarkets: This channel remains dominant due to extensive reach and established supply chains.
- Online Retail: This segment is growing rapidly, driven by increased internet penetration and e-commerce adoption.
- Convenience Stores: This channel caters to the immediate consumption needs of consumers.
Key Drivers: Factors like favorable economic policies, development of robust cold chain logistics and rising urbanization contribute significantly to segment growth.
MEA Freeze Dried Food Products Market Product Developments
Recent product innovations focus on enhancing convenience, nutritional value, and taste. This includes the development of ready-to-eat meals, single-serving packages, and specialized products catering to various dietary needs and preferences. Technological advancements in freeze-drying methods result in improved product quality and reduced processing times. The development of innovative packaging solutions further enhances product shelf life and appeal to consumers. Companies are focusing on product differentiation and value-added offerings to gain a competitive edge.
Report Scope & Segmentation Analysis
This report segments the MEA Freeze Dried Food Products Market by product type (freeze-dried fruits, vegetables, beverages, dairy products, meat and seafood, prepared foods) and distribution channel (supermarkets/hypermarkets, convenience stores, specialist retailers, online retail, other channels). Each segment's market size, growth projections, and competitive dynamics are analyzed. The detailed segmentation provides a granular understanding of market opportunities and trends within each segment. For example, the freeze-dried fruit segment is expected to exhibit strong growth due to its increasing popularity as a healthy snack alternative. Online retail distribution is predicted to experience substantial growth driven by increased e-commerce adoption.
Key Drivers of MEA Freeze Dried Food Products Market Growth
Several factors contribute to the MEA Freeze Dried Food Products Market's growth. Technological advancements in freeze-drying technologies improve product quality and efficiency. The growing demand for convenient and healthy food options fuels market expansion. Favorable economic conditions and rising disposable incomes in several MEA countries drive consumer spending on premium food products. Supportive government regulations and initiatives promoting food security and safety also contribute positively.
Challenges in the MEA Freeze Dried Food Products Market Sector
Despite significant growth potential, the MEA Freeze Dried Food Products Market faces challenges. High production costs associated with freeze-drying technology can impact profitability. Maintaining a stable supply chain, particularly for raw materials, presents logistical difficulties. Intense competition among existing and new players, including both large multinational corporations and smaller niche producers creates pricing pressure. Stringent regulatory requirements related to food safety and labeling can increase operational costs. Lastly, consumer education concerning the benefits of freeze-dried food products is needed to accelerate market penetration in some MEA regions.
Emerging Opportunities in MEA Freeze Dried Food Products Market
Several emerging opportunities exist within the MEA Freeze Dried Food Products Market. The increasing demand for ready-to-eat meals, particularly among young professionals and busy individuals, presents a significant growth avenue. The expansion of e-commerce platforms creates new distribution channels and reach. The development of customized freeze-dried products targeting specific dietary needs and preferences opens opportunities for niche market penetration. Furthermore, exploring new product applications, such as in the pet food industry, offers potential for market diversification and revenue generation.
Leading Players in the MEA Freeze Dried Food Products Market Market
- Nestle SA (Nestle SA)
- Thrive Life LLC
- Asahi Group Holdings Ltd (Asahi Group Holdings Ltd)
- Harmony House Foods Inc
- Expedition Foods Limited
- OFD Foods Inc
- Ajinomoto General Foods Inc (AGF)
- Paradise Fruits
- Mountain House
- Just Tomatoes Etc.
Key Developments in MEA Freeze Dried Food Products Market Industry
- [Year/Month]: Nestle SA launched a range of plant-based freeze-dried products under its Garden Gourmet brand, expanding its portfolio into the growing plant-based food segment.
- [Year/Month]: Thrive Life LLC partnered with Amazon to expand its online distribution reach, capitalizing on the growing e-commerce market.
- [Year/Month]: Asahi Group Holdings Ltd acquired a majority stake in OFD Foods Inc, strengthening its position in the freeze-dried food market and expanding its production capacity.
Strategic Outlook for MEA Freeze Dried Food Products Market Market
The MEA Freeze Dried Food Products Market is poised for continued growth, driven by factors such as rising consumer demand for convenience, increasing health consciousness, and technological advancements. Strategic investments in research and development, expansion of distribution channels (particularly online), and product diversification are crucial for success. Focusing on sustainable and ethical sourcing practices can enhance brand reputation and appeal to environmentally conscious consumers. The market offers significant opportunities for both established players and new entrants to capitalize on the growing demand for convenient and healthy food options in the MEA region.
MEA Freeze Dried Food Products Market Segmentation
-
1. Product Type
- 1.1. Freeze-dried Fruits
- 1.2. Freeze-dried Vegetables
-
1.3. Freeze-dried Beverages
- 1.3.1. Freeze-dried Coffee and Tea
- 1.3.2. Other Freeze-dried Beverages
- 1.4. Freeze-dried Dairy Products
- 1.5. Freeze-dried Meat and Seafood
- 1.6. Prepared Foods
-
2. Distribution Channel
- 2.1. Supermarkets/Hypermarkets
- 2.2. Convenience Stores
- 2.3. Specialist Retailers
- 2.4. Online Retail
- 2.5. Other Distribution Channels
-
3. Geography
- 3.1. Saudi Arabia
- 3.2. South Africa
- 3.3. Rest of Middle-East and Africa
MEA Freeze Dried Food Products Market Segmentation By Geography
- 1. Saudi Arabia
- 2. South Africa
- 3. Rest of Middle East and Africa
MEA Freeze Dried Food Products Market REPORT HIGHLIGHTS
| Aspects | Details |
|---|---|
| Study Period | 2019-2033 |
| Base Year | 2024 |
| Estimated Year | 2025 |
| Forecast Period | 2025-2033 |
| Historical Period | 2019-2024 |
| Growth Rate | CAGR of 6.19% from 2019-2033 |
| Segmentation |
|
Table of Contents
- 1. Introduction
- 1.1. Research Scope
- 1.2. Market Segmentation
- 1.3. Research Methodology
- 1.4. Definitions and Assumptions
- 2. Executive Summary
- 2.1. Introduction
- 3. Market Dynamics
- 3.1. Introduction
- 3.2. Market Drivers
- 3.2.1. Increasing Demand for Low-Fat and Fat-Free Food Products; Expanding Cosmetic and Personal Care Industries Utilize Gelatin for Various Purposes
- 3.3. Market Restrains
- 3.3.1. Fluctuations in Raw Material Proces Affecting Production Costs
- 3.4. Market Trends
- 3.4.1. Saudi Arabia Witnessed as Fastest Growing Country
- 4. Market Factor Analysis
- 4.1. Porters Five Forces
- 4.2. Supply/Value Chain
- 4.3. PESTEL analysis
- 4.4. Market Entropy
- 4.5. Patent/Trademark Analysis
- 5. Global MEA Freeze Dried Food Products Market Analysis, Insights and Forecast, 2019-2031
- 5.1. Market Analysis, Insights and Forecast - by Product Type
- 5.1.1. Freeze-dried Fruits
- 5.1.2. Freeze-dried Vegetables
- 5.1.3. Freeze-dried Beverages
- 5.1.3.1. Freeze-dried Coffee and Tea
- 5.1.3.2. Other Freeze-dried Beverages
- 5.1.4. Freeze-dried Dairy Products
- 5.1.5. Freeze-dried Meat and Seafood
- 5.1.6. Prepared Foods
- 5.2. Market Analysis, Insights and Forecast - by Distribution Channel
- 5.2.1. Supermarkets/Hypermarkets
- 5.2.2. Convenience Stores
- 5.2.3. Specialist Retailers
- 5.2.4. Online Retail
- 5.2.5. Other Distribution Channels
- 5.3. Market Analysis, Insights and Forecast - by Geography
- 5.3.1. Saudi Arabia
- 5.3.2. South Africa
- 5.3.3. Rest of Middle-East and Africa
- 5.4. Market Analysis, Insights and Forecast - by Region
- 5.4.1. Saudi Arabia
- 5.4.2. South Africa
- 5.4.3. Rest of Middle East and Africa
- 5.1. Market Analysis, Insights and Forecast - by Product Type
- 6. Saudi Arabia MEA Freeze Dried Food Products Market Analysis, Insights and Forecast, 2019-2031
- 6.1. Market Analysis, Insights and Forecast - by Product Type
- 6.1.1. Freeze-dried Fruits
- 6.1.2. Freeze-dried Vegetables
- 6.1.3. Freeze-dried Beverages
- 6.1.3.1. Freeze-dried Coffee and Tea
- 6.1.3.2. Other Freeze-dried Beverages
- 6.1.4. Freeze-dried Dairy Products
- 6.1.5. Freeze-dried Meat and Seafood
- 6.1.6. Prepared Foods
- 6.2. Market Analysis, Insights and Forecast - by Distribution Channel
- 6.2.1. Supermarkets/Hypermarkets
- 6.2.2. Convenience Stores
- 6.2.3. Specialist Retailers
- 6.2.4. Online Retail
- 6.2.5. Other Distribution Channels
- 6.3. Market Analysis, Insights and Forecast - by Geography
- 6.3.1. Saudi Arabia
- 6.3.2. South Africa
- 6.3.3. Rest of Middle-East and Africa
- 6.1. Market Analysis, Insights and Forecast - by Product Type
- 7. South Africa MEA Freeze Dried Food Products Market Analysis, Insights and Forecast, 2019-2031
- 7.1. Market Analysis, Insights and Forecast - by Product Type
- 7.1.1. Freeze-dried Fruits
- 7.1.2. Freeze-dried Vegetables
- 7.1.3. Freeze-dried Beverages
- 7.1.3.1. Freeze-dried Coffee and Tea
- 7.1.3.2. Other Freeze-dried Beverages
- 7.1.4. Freeze-dried Dairy Products
- 7.1.5. Freeze-dried Meat and Seafood
- 7.1.6. Prepared Foods
- 7.2. Market Analysis, Insights and Forecast - by Distribution Channel
- 7.2.1. Supermarkets/Hypermarkets
- 7.2.2. Convenience Stores
- 7.2.3. Specialist Retailers
- 7.2.4. Online Retail
- 7.2.5. Other Distribution Channels
- 7.3. Market Analysis, Insights and Forecast - by Geography
- 7.3.1. Saudi Arabia
- 7.3.2. South Africa
- 7.3.3. Rest of Middle-East and Africa
- 7.1. Market Analysis, Insights and Forecast - by Product Type
- 8. Rest of Middle East and Africa MEA Freeze Dried Food Products Market Analysis, Insights and Forecast, 2019-2031
- 8.1. Market Analysis, Insights and Forecast - by Product Type
- 8.1.1. Freeze-dried Fruits
- 8.1.2. Freeze-dried Vegetables
- 8.1.3. Freeze-dried Beverages
- 8.1.3.1. Freeze-dried Coffee and Tea
- 8.1.3.2. Other Freeze-dried Beverages
- 8.1.4. Freeze-dried Dairy Products
- 8.1.5. Freeze-dried Meat and Seafood
- 8.1.6. Prepared Foods
- 8.2. Market Analysis, Insights and Forecast - by Distribution Channel
- 8.2.1. Supermarkets/Hypermarkets
- 8.2.2. Convenience Stores
- 8.2.3. Specialist Retailers
- 8.2.4. Online Retail
- 8.2.5. Other Distribution Channels
- 8.3. Market Analysis, Insights and Forecast - by Geography
- 8.3.1. Saudi Arabia
- 8.3.2. South Africa
- 8.3.3. Rest of Middle-East and Africa
- 8.1. Market Analysis, Insights and Forecast - by Product Type
- 9. North America MEA Freeze Dried Food Products Market Analysis, Insights and Forecast, 2019-2031
- 9.1. Market Analysis, Insights and Forecast - By Country/Sub-region
- 9.1.1 United States
- 9.1.2 Canada
- 9.1.3 Mexico
- 10. Europe MEA Freeze Dried Food Products Market Analysis, Insights and Forecast, 2019-2031
- 10.1. Market Analysis, Insights and Forecast - By Country/Sub-region
- 10.1.1 Germany
- 10.1.2 United Kingdom
- 10.1.3 France
- 10.1.4 Spain
- 10.1.5 Italy
- 10.1.6 Spain
- 10.1.7 Belgium
- 10.1.8 Netherland
- 10.1.9 Nordics
- 10.1.10 Rest of Europe
- 11. Asia Pacific MEA Freeze Dried Food Products Market Analysis, Insights and Forecast, 2019-2031
- 11.1. Market Analysis, Insights and Forecast - By Country/Sub-region
- 11.1.1 China
- 11.1.2 Japan
- 11.1.3 India
- 11.1.4 South Korea
- 11.1.5 Southeast Asia
- 11.1.6 Australia
- 11.1.7 Indonesia
- 11.1.8 Phillipes
- 11.1.9 Singapore
- 11.1.10 Thailandc
- 11.1.11 Rest of Asia Pacific
- 12. South America MEA Freeze Dried Food Products Market Analysis, Insights and Forecast, 2019-2031
- 12.1. Market Analysis, Insights and Forecast - By Country/Sub-region
- 12.1.1 Brazil
- 12.1.2 Argentina
- 12.1.3 Peru
- 12.1.4 Chile
- 12.1.5 Colombia
- 12.1.6 Ecuador
- 12.1.7 Venezuela
- 12.1.8 Rest of South America
- 13. North America MEA Freeze Dried Food Products Market Analysis, Insights and Forecast, 2019-2031
- 13.1. Market Analysis, Insights and Forecast - By Country/Sub-region
- 13.1.1 United States
- 13.1.2 Canada
- 13.1.3 Mexico
- 14. MEA MEA Freeze Dried Food Products Market Analysis, Insights and Forecast, 2019-2031
- 14.1. Market Analysis, Insights and Forecast - By Country/Sub-region
- 14.1.1 United Arab Emirates
- 14.1.2 Saudi Arabia
- 14.1.3 South Africa
- 14.1.4 Rest of Middle East and Africa
- 15. Competitive Analysis
- 15.1. Global Market Share Analysis 2024
- 15.2. Company Profiles
- 15.2.1 Nestle SA
- 15.2.1.1. Overview
- 15.2.1.2. Products
- 15.2.1.3. SWOT Analysis
- 15.2.1.4. Recent Developments
- 15.2.1.5. Financials (Based on Availability)
- 15.2.2 Thrive Life LLC*List Not Exhaustive
- 15.2.2.1. Overview
- 15.2.2.2. Products
- 15.2.2.3. SWOT Analysis
- 15.2.2.4. Recent Developments
- 15.2.2.5. Financials (Based on Availability)
- 15.2.3 Asahi Group Holdings Ltd
- 15.2.3.1. Overview
- 15.2.3.2. Products
- 15.2.3.3. SWOT Analysis
- 15.2.3.4. Recent Developments
- 15.2.3.5. Financials (Based on Availability)
- 15.2.4 Harmony House Foods Inc
- 15.2.4.1. Overview
- 15.2.4.2. Products
- 15.2.4.3. SWOT Analysis
- 15.2.4.4. Recent Developments
- 15.2.4.5. Financials (Based on Availability)
- 15.2.5 Expedition Foods Limited
- 15.2.5.1. Overview
- 15.2.5.2. Products
- 15.2.5.3. SWOT Analysis
- 15.2.5.4. Recent Developments
- 15.2.5.5. Financials (Based on Availability)
- 15.2.6 OFD Foods Inc
- 15.2.6.1. Overview
- 15.2.6.2. Products
- 15.2.6.3. SWOT Analysis
- 15.2.6.4. Recent Developments
- 15.2.6.5. Financials (Based on Availability)
- 15.2.7 Ajinomoto General Foods Inc (AGF)
- 15.2.7.1. Overview
- 15.2.7.2. Products
- 15.2.7.3. SWOT Analysis
- 15.2.7.4. Recent Developments
- 15.2.7.5. Financials (Based on Availability)
- 15.2.8 Paradise Fruits
- 15.2.8.1. Overview
- 15.2.8.2. Products
- 15.2.8.3. SWOT Analysis
- 15.2.8.4. Recent Developments
- 15.2.8.5. Financials (Based on Availability)
- 15.2.9 Mountain House
- 15.2.9.1. Overview
- 15.2.9.2. Products
- 15.2.9.3. SWOT Analysis
- 15.2.9.4. Recent Developments
- 15.2.9.5. Financials (Based on Availability)
- 15.2.10 Just Tomatoes Etc.
- 15.2.10.1. Overview
- 15.2.10.2. Products
- 15.2.10.3. SWOT Analysis
- 15.2.10.4. Recent Developments
- 15.2.10.5. Financials (Based on Availability)
- 15.2.1 Nestle SA
List of Figures
- Figure 1: Global MEA Freeze Dried Food Products Market Revenue Breakdown (Million, %) by Region 2024 & 2032
- Figure 2: Global MEA Freeze Dried Food Products Market Volume Breakdown (K Tons, %) by Region 2024 & 2032
- Figure 3: North America MEA Freeze Dried Food Products Market Revenue (Million), by Country 2024 & 2032
- Figure 4: North America MEA Freeze Dried Food Products Market Volume (K Tons), by Country 2024 & 2032
- Figure 5: North America MEA Freeze Dried Food Products Market Revenue Share (%), by Country 2024 & 2032
- Figure 6: North America MEA Freeze Dried Food Products Market Volume Share (%), by Country 2024 & 2032
- Figure 7: Europe MEA Freeze Dried Food Products Market Revenue (Million), by Country 2024 & 2032
- Figure 8: Europe MEA Freeze Dried Food Products Market Volume (K Tons), by Country 2024 & 2032
- Figure 9: Europe MEA Freeze Dried Food Products Market Revenue Share (%), by Country 2024 & 2032
- Figure 10: Europe MEA Freeze Dried Food Products Market Volume Share (%), by Country 2024 & 2032
- Figure 11: Asia Pacific MEA Freeze Dried Food Products Market Revenue (Million), by Country 2024 & 2032
- Figure 12: Asia Pacific MEA Freeze Dried Food Products Market Volume (K Tons), by Country 2024 & 2032
- Figure 13: Asia Pacific MEA Freeze Dried Food Products Market Revenue Share (%), by Country 2024 & 2032
- Figure 14: Asia Pacific MEA Freeze Dried Food Products Market Volume Share (%), by Country 2024 & 2032
- Figure 15: South America MEA Freeze Dried Food Products Market Revenue (Million), by Country 2024 & 2032
- Figure 16: South America MEA Freeze Dried Food Products Market Volume (K Tons), by Country 2024 & 2032
- Figure 17: South America MEA Freeze Dried Food Products Market Revenue Share (%), by Country 2024 & 2032
- Figure 18: South America MEA Freeze Dried Food Products Market Volume Share (%), by Country 2024 & 2032
- Figure 19: North America MEA Freeze Dried Food Products Market Revenue (Million), by Country 2024 & 2032
- Figure 20: North America MEA Freeze Dried Food Products Market Volume (K Tons), by Country 2024 & 2032
- Figure 21: North America MEA Freeze Dried Food Products Market Revenue Share (%), by Country 2024 & 2032
- Figure 22: North America MEA Freeze Dried Food Products Market Volume Share (%), by Country 2024 & 2032
- Figure 23: MEA MEA Freeze Dried Food Products Market Revenue (Million), by Country 2024 & 2032
- Figure 24: MEA MEA Freeze Dried Food Products Market Volume (K Tons), by Country 2024 & 2032
- Figure 25: MEA MEA Freeze Dried Food Products Market Revenue Share (%), by Country 2024 & 2032
- Figure 26: MEA MEA Freeze Dried Food Products Market Volume Share (%), by Country 2024 & 2032
- Figure 27: Saudi Arabia MEA Freeze Dried Food Products Market Revenue (Million), by Product Type 2024 & 2032
- Figure 28: Saudi Arabia MEA Freeze Dried Food Products Market Volume (K Tons), by Product Type 2024 & 2032
- Figure 29: Saudi Arabia MEA Freeze Dried Food Products Market Revenue Share (%), by Product Type 2024 & 2032
- Figure 30: Saudi Arabia MEA Freeze Dried Food Products Market Volume Share (%), by Product Type 2024 & 2032
- Figure 31: Saudi Arabia MEA Freeze Dried Food Products Market Revenue (Million), by Distribution Channel 2024 & 2032
- Figure 32: Saudi Arabia MEA Freeze Dried Food Products Market Volume (K Tons), by Distribution Channel 2024 & 2032
- Figure 33: Saudi Arabia MEA Freeze Dried Food Products Market Revenue Share (%), by Distribution Channel 2024 & 2032
- Figure 34: Saudi Arabia MEA Freeze Dried Food Products Market Volume Share (%), by Distribution Channel 2024 & 2032
- Figure 35: Saudi Arabia MEA Freeze Dried Food Products Market Revenue (Million), by Geography 2024 & 2032
- Figure 36: Saudi Arabia MEA Freeze Dried Food Products Market Volume (K Tons), by Geography 2024 & 2032
- Figure 37: Saudi Arabia MEA Freeze Dried Food Products Market Revenue Share (%), by Geography 2024 & 2032
- Figure 38: Saudi Arabia MEA Freeze Dried Food Products Market Volume Share (%), by Geography 2024 & 2032
- Figure 39: Saudi Arabia MEA Freeze Dried Food Products Market Revenue (Million), by Country 2024 & 2032
- Figure 40: Saudi Arabia MEA Freeze Dried Food Products Market Volume (K Tons), by Country 2024 & 2032
- Figure 41: Saudi Arabia MEA Freeze Dried Food Products Market Revenue Share (%), by Country 2024 & 2032
- Figure 42: Saudi Arabia MEA Freeze Dried Food Products Market Volume Share (%), by Country 2024 & 2032
- Figure 43: South Africa MEA Freeze Dried Food Products Market Revenue (Million), by Product Type 2024 & 2032
- Figure 44: South Africa MEA Freeze Dried Food Products Market Volume (K Tons), by Product Type 2024 & 2032
- Figure 45: South Africa MEA Freeze Dried Food Products Market Revenue Share (%), by Product Type 2024 & 2032
- Figure 46: South Africa MEA Freeze Dried Food Products Market Volume Share (%), by Product Type 2024 & 2032
- Figure 47: South Africa MEA Freeze Dried Food Products Market Revenue (Million), by Distribution Channel 2024 & 2032
- Figure 48: South Africa MEA Freeze Dried Food Products Market Volume (K Tons), by Distribution Channel 2024 & 2032
- Figure 49: South Africa MEA Freeze Dried Food Products Market Revenue Share (%), by Distribution Channel 2024 & 2032
- Figure 50: South Africa MEA Freeze Dried Food Products Market Volume Share (%), by Distribution Channel 2024 & 2032
- Figure 51: South Africa MEA Freeze Dried Food Products Market Revenue (Million), by Geography 2024 & 2032
- Figure 52: South Africa MEA Freeze Dried Food Products Market Volume (K Tons), by Geography 2024 & 2032
- Figure 53: South Africa MEA Freeze Dried Food Products Market Revenue Share (%), by Geography 2024 & 2032
- Figure 54: South Africa MEA Freeze Dried Food Products Market Volume Share (%), by Geography 2024 & 2032
- Figure 55: South Africa MEA Freeze Dried Food Products Market Revenue (Million), by Country 2024 & 2032
- Figure 56: South Africa MEA Freeze Dried Food Products Market Volume (K Tons), by Country 2024 & 2032
- Figure 57: South Africa MEA Freeze Dried Food Products Market Revenue Share (%), by Country 2024 & 2032
- Figure 58: South Africa MEA Freeze Dried Food Products Market Volume Share (%), by Country 2024 & 2032
- Figure 59: Rest of Middle East and Africa MEA Freeze Dried Food Products Market Revenue (Million), by Product Type 2024 & 2032
- Figure 60: Rest of Middle East and Africa MEA Freeze Dried Food Products Market Volume (K Tons), by Product Type 2024 & 2032
- Figure 61: Rest of Middle East and Africa MEA Freeze Dried Food Products Market Revenue Share (%), by Product Type 2024 & 2032
- Figure 62: Rest of Middle East and Africa MEA Freeze Dried Food Products Market Volume Share (%), by Product Type 2024 & 2032
- Figure 63: Rest of Middle East and Africa MEA Freeze Dried Food Products Market Revenue (Million), by Distribution Channel 2024 & 2032
- Figure 64: Rest of Middle East and Africa MEA Freeze Dried Food Products Market Volume (K Tons), by Distribution Channel 2024 & 2032
- Figure 65: Rest of Middle East and Africa MEA Freeze Dried Food Products Market Revenue Share (%), by Distribution Channel 2024 & 2032
- Figure 66: Rest of Middle East and Africa MEA Freeze Dried Food Products Market Volume Share (%), by Distribution Channel 2024 & 2032
- Figure 67: Rest of Middle East and Africa MEA Freeze Dried Food Products Market Revenue (Million), by Geography 2024 & 2032
- Figure 68: Rest of Middle East and Africa MEA Freeze Dried Food Products Market Volume (K Tons), by Geography 2024 & 2032
- Figure 69: Rest of Middle East and Africa MEA Freeze Dried Food Products Market Revenue Share (%), by Geography 2024 & 2032
- Figure 70: Rest of Middle East and Africa MEA Freeze Dried Food Products Market Volume Share (%), by Geography 2024 & 2032
- Figure 71: Rest of Middle East and Africa MEA Freeze Dried Food Products Market Revenue (Million), by Country 2024 & 2032
- Figure 72: Rest of Middle East and Africa MEA Freeze Dried Food Products Market Volume (K Tons), by Country 2024 & 2032
- Figure 73: Rest of Middle East and Africa MEA Freeze Dried Food Products Market Revenue Share (%), by Country 2024 & 2032
- Figure 74: Rest of Middle East and Africa MEA Freeze Dried Food Products Market Volume Share (%), by Country 2024 & 2032
List of Tables
- Table 1: Global MEA Freeze Dried Food Products Market Revenue Million Forecast, by Region 2019 & 2032
- Table 2: Global MEA Freeze Dried Food Products Market Volume K Tons Forecast, by Region 2019 & 2032
- Table 3: Global MEA Freeze Dried Food Products Market Revenue Million Forecast, by Product Type 2019 & 2032
- Table 4: Global MEA Freeze Dried Food Products Market Volume K Tons Forecast, by Product Type 2019 & 2032
- Table 5: Global MEA Freeze Dried Food Products Market Revenue Million Forecast, by Distribution Channel 2019 & 2032
- Table 6: Global MEA Freeze Dried Food Products Market Volume K Tons Forecast, by Distribution Channel 2019 & 2032
- Table 7: Global MEA Freeze Dried Food Products Market Revenue Million Forecast, by Geography 2019 & 2032
- Table 8: Global MEA Freeze Dried Food Products Market Volume K Tons Forecast, by Geography 2019 & 2032
- Table 9: Global MEA Freeze Dried Food Products Market Revenue Million Forecast, by Region 2019 & 2032
- Table 10: Global MEA Freeze Dried Food Products Market Volume K Tons Forecast, by Region 2019 & 2032
- Table 11: Global MEA Freeze Dried Food Products Market Revenue Million Forecast, by Country 2019 & 2032
- Table 12: Global MEA Freeze Dried Food Products Market Volume K Tons Forecast, by Country 2019 & 2032
- Table 13: United States MEA Freeze Dried Food Products Market Revenue (Million) Forecast, by Application 2019 & 2032
- Table 14: United States MEA Freeze Dried Food Products Market Volume (K Tons) Forecast, by Application 2019 & 2032
- Table 15: Canada MEA Freeze Dried Food Products Market Revenue (Million) Forecast, by Application 2019 & 2032
- Table 16: Canada MEA Freeze Dried Food Products Market Volume (K Tons) Forecast, by Application 2019 & 2032
- Table 17: Mexico MEA Freeze Dried Food Products Market Revenue (Million) Forecast, by Application 2019 & 2032
- Table 18: Mexico MEA Freeze Dried Food Products Market Volume (K Tons) Forecast, by Application 2019 & 2032
- Table 19: Global MEA Freeze Dried Food Products Market Revenue Million Forecast, by Country 2019 & 2032
- Table 20: Global MEA Freeze Dried Food Products Market Volume K Tons Forecast, by Country 2019 & 2032
- Table 21: Germany MEA Freeze Dried Food Products Market Revenue (Million) Forecast, by Application 2019 & 2032
- Table 22: Germany MEA Freeze Dried Food Products Market Volume (K Tons) Forecast, by Application 2019 & 2032
- Table 23: United Kingdom MEA Freeze Dried Food Products Market Revenue (Million) Forecast, by Application 2019 & 2032
- Table 24: United Kingdom MEA Freeze Dried Food Products Market Volume (K Tons) Forecast, by Application 2019 & 2032
- Table 25: France MEA Freeze Dried Food Products Market Revenue (Million) Forecast, by Application 2019 & 2032
- Table 26: France MEA Freeze Dried Food Products Market Volume (K Tons) Forecast, by Application 2019 & 2032
- Table 27: Spain MEA Freeze Dried Food Products Market Revenue (Million) Forecast, by Application 2019 & 2032
- Table 28: Spain MEA Freeze Dried Food Products Market Volume (K Tons) Forecast, by Application 2019 & 2032
- Table 29: Italy MEA Freeze Dried Food Products Market Revenue (Million) Forecast, by Application 2019 & 2032
- Table 30: Italy MEA Freeze Dried Food Products Market Volume (K Tons) Forecast, by Application 2019 & 2032
- Table 31: Spain MEA Freeze Dried Food Products Market Revenue (Million) Forecast, by Application 2019 & 2032
- Table 32: Spain MEA Freeze Dried Food Products Market Volume (K Tons) Forecast, by Application 2019 & 2032
- Table 33: Belgium MEA Freeze Dried Food Products Market Revenue (Million) Forecast, by Application 2019 & 2032
- Table 34: Belgium MEA Freeze Dried Food Products Market Volume (K Tons) Forecast, by Application 2019 & 2032
- Table 35: Netherland MEA Freeze Dried Food Products Market Revenue (Million) Forecast, by Application 2019 & 2032
- Table 36: Netherland MEA Freeze Dried Food Products Market Volume (K Tons) Forecast, by Application 2019 & 2032
- Table 37: Nordics MEA Freeze Dried Food Products Market Revenue (Million) Forecast, by Application 2019 & 2032
- Table 38: Nordics MEA Freeze Dried Food Products Market Volume (K Tons) Forecast, by Application 2019 & 2032
- Table 39: Rest of Europe MEA Freeze Dried Food Products Market Revenue (Million) Forecast, by Application 2019 & 2032
- Table 40: Rest of Europe MEA Freeze Dried Food Products Market Volume (K Tons) Forecast, by Application 2019 & 2032
- Table 41: Global MEA Freeze Dried Food Products Market Revenue Million Forecast, by Country 2019 & 2032
- Table 42: Global MEA Freeze Dried Food Products Market Volume K Tons Forecast, by Country 2019 & 2032
- Table 43: China MEA Freeze Dried Food Products Market Revenue (Million) Forecast, by Application 2019 & 2032
- Table 44: China MEA Freeze Dried Food Products Market Volume (K Tons) Forecast, by Application 2019 & 2032
- Table 45: Japan MEA Freeze Dried Food Products Market Revenue (Million) Forecast, by Application 2019 & 2032
- Table 46: Japan MEA Freeze Dried Food Products Market Volume (K Tons) Forecast, by Application 2019 & 2032
- Table 47: India MEA Freeze Dried Food Products Market Revenue (Million) Forecast, by Application 2019 & 2032
- Table 48: India MEA Freeze Dried Food Products Market Volume (K Tons) Forecast, by Application 2019 & 2032
- Table 49: South Korea MEA Freeze Dried Food Products Market Revenue (Million) Forecast, by Application 2019 & 2032
- Table 50: South Korea MEA Freeze Dried Food Products Market Volume (K Tons) Forecast, by Application 2019 & 2032
- Table 51: Southeast Asia MEA Freeze Dried Food Products Market Revenue (Million) Forecast, by Application 2019 & 2032
- Table 52: Southeast Asia MEA Freeze Dried Food Products Market Volume (K Tons) Forecast, by Application 2019 & 2032
- Table 53: Australia MEA Freeze Dried Food Products Market Revenue (Million) Forecast, by Application 2019 & 2032
- Table 54: Australia MEA Freeze Dried Food Products Market Volume (K Tons) Forecast, by Application 2019 & 2032
- Table 55: Indonesia MEA Freeze Dried Food Products Market Revenue (Million) Forecast, by Application 2019 & 2032
- Table 56: Indonesia MEA Freeze Dried Food Products Market Volume (K Tons) Forecast, by Application 2019 & 2032
- Table 57: Phillipes MEA Freeze Dried Food Products Market Revenue (Million) Forecast, by Application 2019 & 2032
- Table 58: Phillipes MEA Freeze Dried Food Products Market Volume (K Tons) Forecast, by Application 2019 & 2032
- Table 59: Singapore MEA Freeze Dried Food Products Market Revenue (Million) Forecast, by Application 2019 & 2032
- Table 60: Singapore MEA Freeze Dried Food Products Market Volume (K Tons) Forecast, by Application 2019 & 2032
- Table 61: Thailandc MEA Freeze Dried Food Products Market Revenue (Million) Forecast, by Application 2019 & 2032
- Table 62: Thailandc MEA Freeze Dried Food Products Market Volume (K Tons) Forecast, by Application 2019 & 2032
- Table 63: Rest of Asia Pacific MEA Freeze Dried Food Products Market Revenue (Million) Forecast, by Application 2019 & 2032
- Table 64: Rest of Asia Pacific MEA Freeze Dried Food Products Market Volume (K Tons) Forecast, by Application 2019 & 2032
- Table 65: Global MEA Freeze Dried Food Products Market Revenue Million Forecast, by Country 2019 & 2032
- Table 66: Global MEA Freeze Dried Food Products Market Volume K Tons Forecast, by Country 2019 & 2032
- Table 67: Brazil MEA Freeze Dried Food Products Market Revenue (Million) Forecast, by Application 2019 & 2032
- Table 68: Brazil MEA Freeze Dried Food Products Market Volume (K Tons) Forecast, by Application 2019 & 2032
- Table 69: Argentina MEA Freeze Dried Food Products Market Revenue (Million) Forecast, by Application 2019 & 2032
- Table 70: Argentina MEA Freeze Dried Food Products Market Volume (K Tons) Forecast, by Application 2019 & 2032
- Table 71: Peru MEA Freeze Dried Food Products Market Revenue (Million) Forecast, by Application 2019 & 2032
- Table 72: Peru MEA Freeze Dried Food Products Market Volume (K Tons) Forecast, by Application 2019 & 2032
- Table 73: Chile MEA Freeze Dried Food Products Market Revenue (Million) Forecast, by Application 2019 & 2032
- Table 74: Chile MEA Freeze Dried Food Products Market Volume (K Tons) Forecast, by Application 2019 & 2032
- Table 75: Colombia MEA Freeze Dried Food Products Market Revenue (Million) Forecast, by Application 2019 & 2032
- Table 76: Colombia MEA Freeze Dried Food Products Market Volume (K Tons) Forecast, by Application 2019 & 2032
- Table 77: Ecuador MEA Freeze Dried Food Products Market Revenue (Million) Forecast, by Application 2019 & 2032
- Table 78: Ecuador MEA Freeze Dried Food Products Market Volume (K Tons) Forecast, by Application 2019 & 2032
- Table 79: Venezuela MEA Freeze Dried Food Products Market Revenue (Million) Forecast, by Application 2019 & 2032
- Table 80: Venezuela MEA Freeze Dried Food Products Market Volume (K Tons) Forecast, by Application 2019 & 2032
- Table 81: Rest of South America MEA Freeze Dried Food Products Market Revenue (Million) Forecast, by Application 2019 & 2032
- Table 82: Rest of South America MEA Freeze Dried Food Products Market Volume (K Tons) Forecast, by Application 2019 & 2032
- Table 83: Global MEA Freeze Dried Food Products Market Revenue Million Forecast, by Country 2019 & 2032
- Table 84: Global MEA Freeze Dried Food Products Market Volume K Tons Forecast, by Country 2019 & 2032
- Table 85: United States MEA Freeze Dried Food Products Market Revenue (Million) Forecast, by Application 2019 & 2032
- Table 86: United States MEA Freeze Dried Food Products Market Volume (K Tons) Forecast, by Application 2019 & 2032
- Table 87: Canada MEA Freeze Dried Food Products Market Revenue (Million) Forecast, by Application 2019 & 2032
- Table 88: Canada MEA Freeze Dried Food Products Market Volume (K Tons) Forecast, by Application 2019 & 2032
- Table 89: Mexico MEA Freeze Dried Food Products Market Revenue (Million) Forecast, by Application 2019 & 2032
- Table 90: Mexico MEA Freeze Dried Food Products Market Volume (K Tons) Forecast, by Application 2019 & 2032
- Table 91: Global MEA Freeze Dried Food Products Market Revenue Million Forecast, by Country 2019 & 2032
- Table 92: Global MEA Freeze Dried Food Products Market Volume K Tons Forecast, by Country 2019 & 2032
- Table 93: United Arab Emirates MEA Freeze Dried Food Products Market Revenue (Million) Forecast, by Application 2019 & 2032
- Table 94: United Arab Emirates MEA Freeze Dried Food Products Market Volume (K Tons) Forecast, by Application 2019 & 2032
- Table 95: Saudi Arabia MEA Freeze Dried Food Products Market Revenue (Million) Forecast, by Application 2019 & 2032
- Table 96: Saudi Arabia MEA Freeze Dried Food Products Market Volume (K Tons) Forecast, by Application 2019 & 2032
- Table 97: South Africa MEA Freeze Dried Food Products Market Revenue (Million) Forecast, by Application 2019 & 2032
- Table 98: South Africa MEA Freeze Dried Food Products Market Volume (K Tons) Forecast, by Application 2019 & 2032
- Table 99: Rest of Middle East and Africa MEA Freeze Dried Food Products Market Revenue (Million) Forecast, by Application 2019 & 2032
- Table 100: Rest of Middle East and Africa MEA Freeze Dried Food Products Market Volume (K Tons) Forecast, by Application 2019 & 2032
- Table 101: Global MEA Freeze Dried Food Products Market Revenue Million Forecast, by Product Type 2019 & 2032
- Table 102: Global MEA Freeze Dried Food Products Market Volume K Tons Forecast, by Product Type 2019 & 2032
- Table 103: Global MEA Freeze Dried Food Products Market Revenue Million Forecast, by Distribution Channel 2019 & 2032
- Table 104: Global MEA Freeze Dried Food Products Market Volume K Tons Forecast, by Distribution Channel 2019 & 2032
- Table 105: Global MEA Freeze Dried Food Products Market Revenue Million Forecast, by Geography 2019 & 2032
- Table 106: Global MEA Freeze Dried Food Products Market Volume K Tons Forecast, by Geography 2019 & 2032
- Table 107: Global MEA Freeze Dried Food Products Market Revenue Million Forecast, by Country 2019 & 2032
- Table 108: Global MEA Freeze Dried Food Products Market Volume K Tons Forecast, by Country 2019 & 2032
- Table 109: Global MEA Freeze Dried Food Products Market Revenue Million Forecast, by Product Type 2019 & 2032
- Table 110: Global MEA Freeze Dried Food Products Market Volume K Tons Forecast, by Product Type 2019 & 2032
- Table 111: Global MEA Freeze Dried Food Products Market Revenue Million Forecast, by Distribution Channel 2019 & 2032
- Table 112: Global MEA Freeze Dried Food Products Market Volume K Tons Forecast, by Distribution Channel 2019 & 2032
- Table 113: Global MEA Freeze Dried Food Products Market Revenue Million Forecast, by Geography 2019 & 2032
- Table 114: Global MEA Freeze Dried Food Products Market Volume K Tons Forecast, by Geography 2019 & 2032
- Table 115: Global MEA Freeze Dried Food Products Market Revenue Million Forecast, by Country 2019 & 2032
- Table 116: Global MEA Freeze Dried Food Products Market Volume K Tons Forecast, by Country 2019 & 2032
- Table 117: Global MEA Freeze Dried Food Products Market Revenue Million Forecast, by Product Type 2019 & 2032
- Table 118: Global MEA Freeze Dried Food Products Market Volume K Tons Forecast, by Product Type 2019 & 2032
- Table 119: Global MEA Freeze Dried Food Products Market Revenue Million Forecast, by Distribution Channel 2019 & 2032
- Table 120: Global MEA Freeze Dried Food Products Market Volume K Tons Forecast, by Distribution Channel 2019 & 2032
- Table 121: Global MEA Freeze Dried Food Products Market Revenue Million Forecast, by Geography 2019 & 2032
- Table 122: Global MEA Freeze Dried Food Products Market Volume K Tons Forecast, by Geography 2019 & 2032
- Table 123: Global MEA Freeze Dried Food Products Market Revenue Million Forecast, by Country 2019 & 2032
- Table 124: Global MEA Freeze Dried Food Products Market Volume K Tons Forecast, by Country 2019 & 2032
Frequently Asked Questions
1. What is the projected Compound Annual Growth Rate (CAGR) of the MEA Freeze Dried Food Products Market?
The projected CAGR is approximately 6.19%.
2. Which companies are prominent players in the MEA Freeze Dried Food Products Market?
Key companies in the market include Nestle SA, Thrive Life LLC*List Not Exhaustive, Asahi Group Holdings Ltd, Harmony House Foods Inc, Expedition Foods Limited, OFD Foods Inc, Ajinomoto General Foods Inc (AGF), Paradise Fruits, Mountain House , Just Tomatoes Etc..
3. What are the main segments of the MEA Freeze Dried Food Products Market?
The market segments include Product Type, Distribution Channel, Geography.
4. Can you provide details about the market size?
The market size is estimated to be USD XX Million as of 2022.
5. What are some drivers contributing to market growth?
Increasing Demand for Low-Fat and Fat-Free Food Products; Expanding Cosmetic and Personal Care Industries Utilize Gelatin for Various Purposes.
6. What are the notable trends driving market growth?
Saudi Arabia Witnessed as Fastest Growing Country.
7. Are there any restraints impacting market growth?
Fluctuations in Raw Material Proces Affecting Production Costs.
8. Can you provide examples of recent developments in the market?
Nestle SA launched a range of plant-based freeze-dried products under its Garden Gourmet brand.
9. What pricing options are available for accessing the report?
Pricing options include single-user, multi-user, and enterprise licenses priced at USD 4750, USD 5250, and USD 8750 respectively.
10. Is the market size provided in terms of value or volume?
The market size is provided in terms of value, measured in Million and volume, measured in K Tons.
11. Are there any specific market keywords associated with the report?
Yes, the market keyword associated with the report is "MEA Freeze Dried Food Products Market," which aids in identifying and referencing the specific market segment covered.
12. How do I determine which pricing option suits my needs best?
The pricing options vary based on user requirements and access needs. Individual users may opt for single-user licenses, while businesses requiring broader access may choose multi-user or enterprise licenses for cost-effective access to the report.
13. Are there any additional resources or data provided in the MEA Freeze Dried Food Products Market report?
While the report offers comprehensive insights, it's advisable to review the specific contents or supplementary materials provided to ascertain if additional resources or data are available.
14. How can I stay updated on further developments or reports in the MEA Freeze Dried Food Products Market?
To stay informed about further developments, trends, and reports in the MEA Freeze Dried Food Products Market, consider subscribing to industry newsletters, following relevant companies and organizations, or regularly checking reputable industry news sources and publications.
Methodology
Step 1 - Identification of Relevant Samples Size from Population Database


Step 2 - Approaches for Defining Global Market Size (Value, Volume* & Price*)

Note*: In applicable scenarios
Step 3 - Data Sources
Primary Research
- Web Analytics
- Survey Reports
- Research Institute
- Latest Research Reports
- Opinion Leaders
Secondary Research
- Annual Reports
- White Paper
- Latest Press Release
- Industry Association
- Paid Database
- Investor Presentations

Step 4 - Data Triangulation
Involves using different sources of information in order to increase the validity of a study
These sources are likely to be stakeholders in a program - participants, other researchers, program staff, other community members, and so on.
Then we put all data in single framework & apply various statistical tools to find out the dynamic on the market.
During the analysis stage, feedback from the stakeholder groups would be compared to determine areas of agreement as well as areas of divergence


