Key Insights
The Middle East and Africa (MEA) payments industry is poised for significant expansion, propelled by increasing smartphone adoption, widespread internet access, and the growing uptake of digital financial services. The market is projected to reach $20672.1 million by 2024, with a Compound Annual Growth Rate (CAGR) of 7.1%. This growth is underpinned by a clear shift towards cashless transactions, the rapid rise of mobile money platforms, and proactive government strategies to enhance financial inclusion. The burgeoning e-commerce sector and the expanding acceptance of digital payments across retail, entertainment, and healthcare are further accelerating market development. Innovations such as super apps offering integrated payment solutions and advanced technologies like biometrics and AI are actively reshaping the industry. Despite ongoing challenges related to regional financial literacy and data security concerns, the market's outlook remains highly positive.
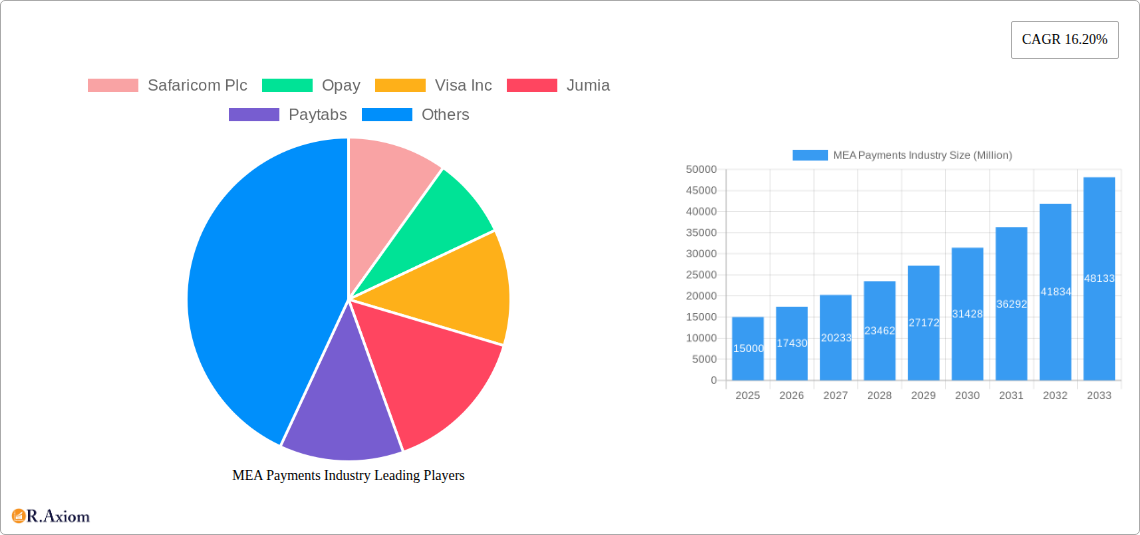
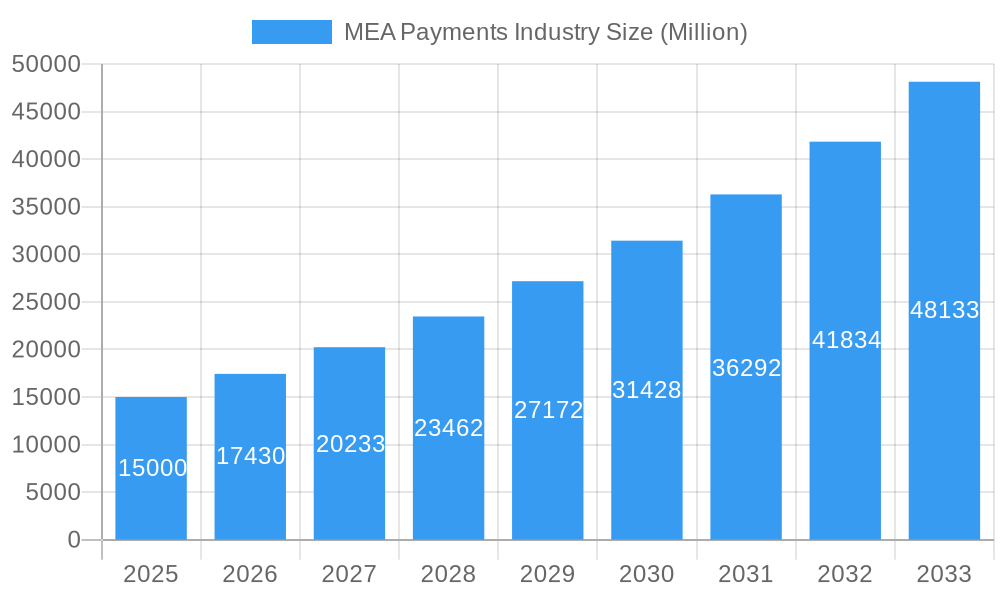
MEA Payments Industry Market Size (In Billion)
Market segmentation within MEA payments highlights varied growth dynamics. E-commerce is a primary contributor, underscoring the rising popularity of online retail. The retail, entertainment, and healthcare sectors are key end-user industries driving transaction volumes. Leading markets include South Africa, the United Arab Emirates, and Saudi Arabia, with the "Rest of MEA" also presenting substantial growth opportunities. While Point-of-Sale (POS) systems remain vital, mobile and online payment methods are experiencing exponential growth. Prominent players such as Safaricom, Opay, Visa, and Jumia are instrumental in shaping the competitive landscape through significant investments in technology and infrastructure to meet evolving consumer and business demands. The forecast period (2025-2033) anticipates accelerated growth, driven by continuous technological advancements and expanded financial inclusion initiatives throughout the region.
MEA Payments Industry Company Market Share
MEA Payments Industry: A Comprehensive Market Report (2019-2033)
This comprehensive report provides an in-depth analysis of the Middle East and Africa (MEA) payments industry, covering the period from 2019 to 2033. It offers crucial insights into market dynamics, competitive landscapes, and future growth opportunities, empowering stakeholders to make informed strategic decisions. The report leverages extensive data analysis and incorporates valuable information across key segments, including various payment modes, end-user industries, and geographical regions within the MEA. The market value is projected to reach xx Million by 2033.
MEA Payments Industry Market Concentration & Innovation
This section analyzes the MEA payments industry's market concentration, innovation drivers, regulatory landscape, and competitive dynamics. The study period is 2019-2024, with 2025 as the base year and a forecast period of 2025-2033.
Market Concentration: The MEA payments market exhibits a diverse landscape with both established players and emerging fintech companies. While a few dominant players hold significant market share, the sector displays a relatively fragmented structure, particularly in mobile money and digital payment platforms. Safaricom Plc, for instance, holds a substantial market share in Kenya, reflecting the region's diverse and dynamic competitive environment. The market share of key players such as Visa Inc., and Mastercard Inc. are estimated at xx% and xx% respectively. The total market value in 2024 was approximately xx Million.
Innovation Drivers: Several factors are driving innovation within the MEA payments sector:
- Growing smartphone penetration: This fuels the adoption of mobile money and digital wallets.
- Rising internet and mobile data accessibility: Facilitates the expansion of online payment platforms.
- Government initiatives promoting financial inclusion: These measures encourage the adoption of digital payment solutions across various demographics.
- Technological advancements: Including advancements in artificial intelligence (AI), blockchain technology, and biometric authentication, enhance security and efficiency.
Regulatory Frameworks: The regulatory environment varies significantly across MEA countries, impacting the pace of innovation and adoption. Some countries have implemented comprehensive frameworks for digital payments, while others are still developing their regulatory structures.
Product Substitutes: Traditional cash-based transactions are still prevalent, but the rise of digital payment methods presents a significant substitute, offering increased convenience and security.
M&A Activities: The MEA payments market has witnessed several M&A activities in recent years, reflecting consolidation and growth strategies by players seeking to expand their market reach and service offerings. The total value of M&A deals during the historical period (2019-2024) is estimated to be approximately xx Million. Significant deals included [Example: mention a specific, publicly available M&A deal if one is found and fits the period. Otherwise, state "specific deal details are unavailable due to data limitations"].
MEA Payments Industry Industry Trends & Insights
The MEA payments industry is experiencing robust growth, driven by several key factors. The Compound Annual Growth Rate (CAGR) during the forecast period (2025-2033) is projected to be xx%. Market penetration is steadily increasing across various segments, particularly in regions with rapidly expanding mobile and internet infrastructure.
Market Growth Drivers:
- The increasing adoption of smartphones and mobile internet.
- Government initiatives to promote financial inclusion and digital transformation.
- Growing e-commerce activities and the expanding online retail sector.
- The rise of mobile money services and digital wallets, catering to underbanked populations.
- The shift from cash-based transactions to digital payment methods driven by convenience and security.
Technological Disruptions: Fintech innovations are transforming the MEA payments landscape, introducing solutions such as mobile payment platforms, digital wallets, and blockchain-based payment systems.
Consumer Preferences: Consumers in MEA are increasingly demanding seamless, secure, and convenient payment solutions, driving the adoption of digital payment methods.
Competitive Dynamics: The MEA payments market is characterized by intense competition amongst established players, such as Visa Inc., Mastercard Inc., and emerging fintech companies.
Dominant Markets & Segments in MEA Payments Industry
The MEA payments industry showcases diverse growth across various segments and regions. The following analysis highlights leading segments and countries.
Leading Regions/Countries:
- South Africa: Strong economic growth and high smartphone penetration contribute to South Africa’s dominance in the region.
- United Arab Emirates (UAE): A highly developed financial infrastructure and significant e-commerce activity fuels the UAE's market leadership.
- Saudi Arabia: Government initiatives to promote digitalization contribute to growth in Saudi Arabia.
- Rest of MEA: This region showcases significant, though fragmented, growth potential fueled by increasing mobile and internet usage.
Leading Segments:
- By End-user Industry: The retail segment is the largest driver, followed by online sales and other expanding sectors like healthcare and hospitality.
- By Mode of Payment: Point-of-sale (POS) payments are currently dominating, but mobile money and online payment methods are experiencing rapid growth. Significant increases are observed in the usage of mobile wallets and digital banking apps.
Key Drivers:
- Economic Policies: Government initiatives promoting financial inclusion and digital payments are key drivers.
- Infrastructure Development: Improvements in internet and mobile network infrastructure support digital payment adoption.
- Consumer Behavior: A shift in consumer preference from cash to digital payments fuels significant growth.
Dominance Analysis: The UAE and South Africa are currently leading due to advanced infrastructure, higher per capita income, and supportive government policies. However, the Rest of MEA presents substantial untapped potential due to rapidly growing mobile penetration and a young population receptive to technological advancements.
MEA Payments Industry Product Developments
The MEA payments industry is witnessing a surge in innovative product development, reflecting both technological advancements and evolving consumer preferences. Mobile money platforms are becoming more sophisticated, incorporating features such as merchant payment solutions and peer-to-peer transfers. Digital wallets offer enhanced security, convenience, and integration with e-commerce platforms. The integration of biometric authentication adds layers of security, while blockchain technology promises improved transparency and efficiency. These developments reflect a strategic market fit, targeting a growing base of users seeking secure and efficient digital payment alternatives.
Report Scope & Segmentation Analysis
This report offers a comprehensive view of the MEA payments industry, segmented by:
By Country: South Africa, United Arab Emirates, Saudi Arabia, and Rest of MEA. Growth projections vary significantly, with South Africa and the UAE demonstrating robust growth driven by robust infrastructure and e-commerce expansion. Conversely, the Rest of MEA shows promising but more fragmented growth, largely influenced by improvements in mobile and internet access.
By End-user Industry: Retail, Entertainment, Healthcare, Hospitality, and Other End-user Industries. The retail sector is currently dominant, followed by online sales. However, growth in healthcare, entertainment, and hospitality is outpacing that of other sectors, driven by increasing digitization and the adoption of online booking and payment systems.
By Mode of Payment: Point of Sale (POS), Mobile Money, Digital Wallets, Online Payments, and Others. POS payments dominate, but mobile money and digital wallets are showing the highest growth rates. Online payments are becoming increasingly common, particularly in e-commerce transactions.
Key Drivers of MEA Payments Industry Growth
The MEA payments industry's growth is propelled by several key factors:
- Rapid Smartphone Penetration: Increasing access to smartphones facilitates mobile money and digital payments adoption.
- Government Initiatives: Many governments are actively promoting digital financial inclusion.
- E-commerce Boom: The rise of e-commerce creates a significant demand for secure online payment solutions.
- Improving Infrastructure: The expansion of internet and mobile network coverage further enables digital payments.
Challenges in the MEA Payments Industry Sector
Despite its significant growth potential, the MEA payments industry faces various challenges:
- Regulatory Hurdles: Inconsistent regulations across different countries can hinder seamless cross-border payments and slow innovation.
- Security Concerns: Cybersecurity threats and fraud are significant issues that impact consumer trust and limit adoption.
- Infrastructure Gaps: Limited internet and mobile network access in certain areas still restricts digital payment adoption.
- Financial Literacy: Low financial literacy levels amongst certain demographics can hinder the understanding and acceptance of digital payments.
Emerging Opportunities in MEA Payments Industry
The MEA payments industry presents several exciting opportunities:
- Expanding into Underserved Markets: Significant potential exists in reaching currently unbanked or underbanked populations.
- Developing Innovative Payment Solutions: Tailoring products to specific needs within MEA presents opportunities.
- Leveraging Fintech Innovations: Exploring solutions like AI, blockchain, and Big Data to improve efficiency and security.
- Cross-Border Payment Solutions: Facilitating seamless payments across borders through collaborations and infrastructure improvements.
Leading Players in the MEA Payments Industry Market
- Safaricom Plc
- Opay
- Visa Inc
- Jumia
- Paytabs
- PalmPay Technology Co Ltd
- Interswitch Ltd
- Amazon com Inc
- Apple Inc
- Network International Holdings Plc
Key Developments in MEA Payments Industry Industry
- August 2021: Visa became the first firm in Sudan to introduce digital payments, partnering with eight licensed partners for wider market access.
- June 2022: LINX partnered with IXAfrica to establish a new interconnection facility in Nairobi, Kenya, signifying enhanced digital infrastructure.
Strategic Outlook for MEA Payments Industry Market
The MEA payments industry is poised for continued substantial growth, driven by technological advancements, increasing smartphone penetration, and government support for digital financial inclusion. The expansion of e-commerce and the ongoing shift from cash-based transactions to digital payment methods will further fuel market growth. The focus on innovative solutions and partnerships will be critical to successfully navigate the challenges and capitalize on emerging opportunities within this dynamic market. Addressing security concerns and expanding financial literacy will be crucial for realizing the sector's full potential.
MEA Payments Industry Segmentation
-
1. Mode of Payment
-
1.1. Point of Sale
- 1.1.1. Card Pay
- 1.1.2. Digital Wallet (Includes Mobile Wallets)
- 1.1.3. Cash
- 1.1.4. Others
-
1.2. Online Sale
- 1.2.1. Others (
-
1.1. Point of Sale
-
2. End-user Industry
- 2.1. Retail
- 2.2. Entertainment
- 2.3. Healthcare
- 2.4. Hospitality
- 2.5. Other End-user Industries
MEA Payments Industry Segmentation By Geography
-
1. North America
- 1.1. United States
- 1.2. Canada
- 1.3. Mexico
-
2. South America
- 2.1. Brazil
- 2.2. Argentina
- 2.3. Rest of South America
-
3. Europe
- 3.1. United Kingdom
- 3.2. Germany
- 3.3. France
- 3.4. Italy
- 3.5. Spain
- 3.6. Russia
- 3.7. Benelux
- 3.8. Nordics
- 3.9. Rest of Europe
-
4. Middle East & Africa
- 4.1. Turkey
- 4.2. Israel
- 4.3. GCC
- 4.4. North Africa
- 4.5. South Africa
- 4.6. Rest of Middle East & Africa
-
5. Asia Pacific
- 5.1. China
- 5.2. India
- 5.3. Japan
- 5.4. South Korea
- 5.5. ASEAN
- 5.6. Oceania
- 5.7. Rest of Asia Pacific
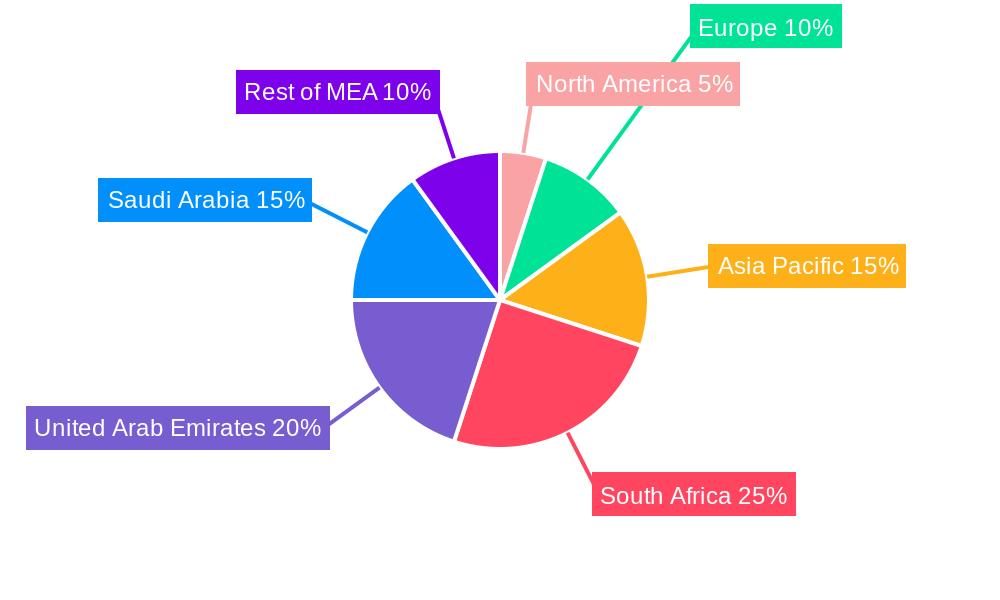
MEA Payments Industry Regional Market Share
Geographic Coverage of MEA Payments Industry
MEA Payments Industry REPORT HIGHLIGHTS
| Aspects | Details |
|---|---|
| Study Period | 2020-2034 |
| Base Year | 2025 |
| Estimated Year | 2026 |
| Forecast Period | 2026-2034 |
| Historical Period | 2020-2025 |
| Growth Rate | CAGR of 7.1% from 2020-2034 |
| Segmentation |
|
Table of Contents
- 1. Introduction
- 1.1. Research Scope
- 1.2. Market Segmentation
- 1.3. Research Objective
- 1.4. Definitions and Assumptions
- 2. Executive Summary
- 2.1. Market Snapshot
- 3. Market Dynamics
- 3.1. Market Drivers
- 3.2. Market Restrains
- 3.3. Market Trends
- 3.4. Market Opportunities
- 4. Market Factor Analysis
- 4.1. Porters Five Forces
- 4.1.1. Bargaining Power of Suppliers
- 4.1.2. Bargaining Power of Buyers
- 4.1.3. Threat of New Entrants
- 4.1.4. Threat of Substitutes
- 4.1.5. Competitive Rivalry
- 4.2. PESTEL analysis
- 4.3. BCG Analysis
- 4.3.1. Stars (High Growth, High Market Share)
- 4.3.2. Cash Cows (Low Growth, High Market Share)
- 4.3.3. Question Mark (High Growth, Low Market Share)
- 4.3.4. Dogs (Low Growth, Low Market Share)
- 4.4. Ansoff Matrix Analysis
- 4.5. Supply Chain Analysis
- 4.6. Regulatory Landscape
- 4.7. Current Market Potential and Opportunity Assessment (TAM–SAM–SOM Framework)
- 4.8. RAX Analyst Note
- 4.1. Porters Five Forces
- 5. Market Analysis, Insights and Forecast 2021-2033
- 5.1. Market Analysis, Insights and Forecast - by Mode of Payment
- 5.1.1. Point of Sale
- 5.1.1.1. Card Pay
- 5.1.1.2. Digital Wallet (Includes Mobile Wallets)
- 5.1.1.3. Cash
- 5.1.1.4. Others
- 5.1.2. Online Sale
- 5.1.2.1. Others (
- 5.1.1. Point of Sale
- 5.2. Market Analysis, Insights and Forecast - by End-user Industry
- 5.2.1. Retail
- 5.2.2. Entertainment
- 5.2.3. Healthcare
- 5.2.4. Hospitality
- 5.2.5. Other End-user Industries
- 5.3. Market Analysis, Insights and Forecast - by Region
- 5.3.1. North America
- 5.3.2. South America
- 5.3.3. Europe
- 5.3.4. Middle East & Africa
- 5.3.5. Asia Pacific
- 5.1. Market Analysis, Insights and Forecast - by Mode of Payment
- 6. Global MEA Payments Industry Analysis, Insights and Forecast, 2021-2033
- 6.1. Market Analysis, Insights and Forecast - by Mode of Payment
- 6.1.1. Point of Sale
- 6.1.1.1. Card Pay
- 6.1.1.2. Digital Wallet (Includes Mobile Wallets)
- 6.1.1.3. Cash
- 6.1.1.4. Others
- 6.1.2. Online Sale
- 6.1.2.1. Others (
- 6.1.1. Point of Sale
- 6.2. Market Analysis, Insights and Forecast - by End-user Industry
- 6.2.1. Retail
- 6.2.2. Entertainment
- 6.2.3. Healthcare
- 6.2.4. Hospitality
- 6.2.5. Other End-user Industries
- 6.1. Market Analysis, Insights and Forecast - by Mode of Payment
- 7. North America MEA Payments Industry Analysis, Insights and Forecast, 2020-2032
- 7.1. Market Analysis, Insights and Forecast - by Mode of Payment
- 7.1.1. Point of Sale
- 7.1.1.1. Card Pay
- 7.1.1.2. Digital Wallet (Includes Mobile Wallets)
- 7.1.1.3. Cash
- 7.1.1.4. Others
- 7.1.2. Online Sale
- 7.1.2.1. Others (
- 7.1.1. Point of Sale
- 7.2. Market Analysis, Insights and Forecast - by End-user Industry
- 7.2.1. Retail
- 7.2.2. Entertainment
- 7.2.3. Healthcare
- 7.2.4. Hospitality
- 7.2.5. Other End-user Industries
- 7.1. Market Analysis, Insights and Forecast - by Mode of Payment
- 8. South America MEA Payments Industry Analysis, Insights and Forecast, 2020-2032
- 8.1. Market Analysis, Insights and Forecast - by Mode of Payment
- 8.1.1. Point of Sale
- 8.1.1.1. Card Pay
- 8.1.1.2. Digital Wallet (Includes Mobile Wallets)
- 8.1.1.3. Cash
- 8.1.1.4. Others
- 8.1.2. Online Sale
- 8.1.2.1. Others (
- 8.1.1. Point of Sale
- 8.2. Market Analysis, Insights and Forecast - by End-user Industry
- 8.2.1. Retail
- 8.2.2. Entertainment
- 8.2.3. Healthcare
- 8.2.4. Hospitality
- 8.2.5. Other End-user Industries
- 8.1. Market Analysis, Insights and Forecast - by Mode of Payment
- 9. Europe MEA Payments Industry Analysis, Insights and Forecast, 2020-2032
- 9.1. Market Analysis, Insights and Forecast - by Mode of Payment
- 9.1.1. Point of Sale
- 9.1.1.1. Card Pay
- 9.1.1.2. Digital Wallet (Includes Mobile Wallets)
- 9.1.1.3. Cash
- 9.1.1.4. Others
- 9.1.2. Online Sale
- 9.1.2.1. Others (
- 9.1.1. Point of Sale
- 9.2. Market Analysis, Insights and Forecast - by End-user Industry
- 9.2.1. Retail
- 9.2.2. Entertainment
- 9.2.3. Healthcare
- 9.2.4. Hospitality
- 9.2.5. Other End-user Industries
- 9.1. Market Analysis, Insights and Forecast - by Mode of Payment
- 10. Middle East & Africa MEA Payments Industry Analysis, Insights and Forecast, 2020-2032
- 10.1. Market Analysis, Insights and Forecast - by Mode of Payment
- 10.1.1. Point of Sale
- 10.1.1.1. Card Pay
- 10.1.1.2. Digital Wallet (Includes Mobile Wallets)
- 10.1.1.3. Cash
- 10.1.1.4. Others
- 10.1.2. Online Sale
- 10.1.2.1. Others (
- 10.1.1. Point of Sale
- 10.2. Market Analysis, Insights and Forecast - by End-user Industry
- 10.2.1. Retail
- 10.2.2. Entertainment
- 10.2.3. Healthcare
- 10.2.4. Hospitality
- 10.2.5. Other End-user Industries
- 10.1. Market Analysis, Insights and Forecast - by Mode of Payment
- 11. Asia Pacific MEA Payments Industry Analysis, Insights and Forecast, 2020-2032
- 11.1. Market Analysis, Insights and Forecast - by Mode of Payment
- 11.1.1. Point of Sale
- 11.1.1.1. Card Pay
- 11.1.1.2. Digital Wallet (Includes Mobile Wallets)
- 11.1.1.3. Cash
- 11.1.1.4. Others
- 11.1.2. Online Sale
- 11.1.2.1. Others (
- 11.1.1. Point of Sale
- 11.2. Market Analysis, Insights and Forecast - by End-user Industry
- 11.2.1. Retail
- 11.2.2. Entertainment
- 11.2.3. Healthcare
- 11.2.4. Hospitality
- 11.2.5. Other End-user Industries
- 11.1. Market Analysis, Insights and Forecast - by Mode of Payment
- 12. Competitive Analysis
- 12.1. Company Profiles
- 12.1.1 Safaricom Plc
- 12.1.1.1. Company Overview
- 12.1.1.2. Products
- 12.1.1.3. Company Financials
- 12.1.1.4. SWOT Analysis
- 12.1.2 Opay
- 12.1.2.1. Company Overview
- 12.1.2.2. Products
- 12.1.2.3. Company Financials
- 12.1.2.4. SWOT Analysis
- 12.1.3 Visa Inc
- 12.1.3.1. Company Overview
- 12.1.3.2. Products
- 12.1.3.3. Company Financials
- 12.1.3.4. SWOT Analysis
- 12.1.4 Jumia
- 12.1.4.1. Company Overview
- 12.1.4.2. Products
- 12.1.4.3. Company Financials
- 12.1.4.4. SWOT Analysis
- 12.1.5 Paytabs
- 12.1.5.1. Company Overview
- 12.1.5.2. Products
- 12.1.5.3. Company Financials
- 12.1.5.4. SWOT Analysis
- 12.1.6 PalmPay Technology Co Ltd
- 12.1.6.1. Company Overview
- 12.1.6.2. Products
- 12.1.6.3. Company Financials
- 12.1.6.4. SWOT Analysis
- 12.1.7 Interswitch Ltd
- 12.1.7.1. Company Overview
- 12.1.7.2. Products
- 12.1.7.3. Company Financials
- 12.1.7.4. SWOT Analysis
- 12.1.8 Amazon com Inc *List Not Exhaustive
- 12.1.8.1. Company Overview
- 12.1.8.2. Products
- 12.1.8.3. Company Financials
- 12.1.8.4. SWOT Analysis
- 12.1.9 Apple Inc
- 12.1.9.1. Company Overview
- 12.1.9.2. Products
- 12.1.9.3. Company Financials
- 12.1.9.4. SWOT Analysis
- 12.1.10 Network International Holdings Plc
- 12.1.10.1. Company Overview
- 12.1.10.2. Products
- 12.1.10.3. Company Financials
- 12.1.10.4. SWOT Analysis
- 12.1.1 Safaricom Plc
- 12.2. Market Entropy
- 12.2.1 Company's Key Areas Served
- 12.2.2 Recent Developments
- 12.3. Company Market Share Analysis 2025
- 12.3.1 Top 5 Companies Market Share Analysis
- 12.3.2 Top 3 Companies Market Share Analysis
- 12.4. List of Potential Customers
- 13. Research Methodology
List of Figures
- Figure 1: Global MEA Payments Industry Revenue Breakdown (million, %) by Region 2025 & 2033
- Figure 2: North America MEA Payments Industry Revenue (million), by Mode of Payment 2025 & 2033
- Figure 3: North America MEA Payments Industry Revenue Share (%), by Mode of Payment 2025 & 2033
- Figure 4: North America MEA Payments Industry Revenue (million), by End-user Industry 2025 & 2033
- Figure 5: North America MEA Payments Industry Revenue Share (%), by End-user Industry 2025 & 2033
- Figure 6: North America MEA Payments Industry Revenue (million), by Country 2025 & 2033
- Figure 7: North America MEA Payments Industry Revenue Share (%), by Country 2025 & 2033
- Figure 8: South America MEA Payments Industry Revenue (million), by Mode of Payment 2025 & 2033
- Figure 9: South America MEA Payments Industry Revenue Share (%), by Mode of Payment 2025 & 2033
- Figure 10: South America MEA Payments Industry Revenue (million), by End-user Industry 2025 & 2033
- Figure 11: South America MEA Payments Industry Revenue Share (%), by End-user Industry 2025 & 2033
- Figure 12: South America MEA Payments Industry Revenue (million), by Country 2025 & 2033
- Figure 13: South America MEA Payments Industry Revenue Share (%), by Country 2025 & 2033
- Figure 14: Europe MEA Payments Industry Revenue (million), by Mode of Payment 2025 & 2033
- Figure 15: Europe MEA Payments Industry Revenue Share (%), by Mode of Payment 2025 & 2033
- Figure 16: Europe MEA Payments Industry Revenue (million), by End-user Industry 2025 & 2033
- Figure 17: Europe MEA Payments Industry Revenue Share (%), by End-user Industry 2025 & 2033
- Figure 18: Europe MEA Payments Industry Revenue (million), by Country 2025 & 2033
- Figure 19: Europe MEA Payments Industry Revenue Share (%), by Country 2025 & 2033
- Figure 20: Middle East & Africa MEA Payments Industry Revenue (million), by Mode of Payment 2025 & 2033
- Figure 21: Middle East & Africa MEA Payments Industry Revenue Share (%), by Mode of Payment 2025 & 2033
- Figure 22: Middle East & Africa MEA Payments Industry Revenue (million), by End-user Industry 2025 & 2033
- Figure 23: Middle East & Africa MEA Payments Industry Revenue Share (%), by End-user Industry 2025 & 2033
- Figure 24: Middle East & Africa MEA Payments Industry Revenue (million), by Country 2025 & 2033
- Figure 25: Middle East & Africa MEA Payments Industry Revenue Share (%), by Country 2025 & 2033
- Figure 26: Asia Pacific MEA Payments Industry Revenue (million), by Mode of Payment 2025 & 2033
- Figure 27: Asia Pacific MEA Payments Industry Revenue Share (%), by Mode of Payment 2025 & 2033
- Figure 28: Asia Pacific MEA Payments Industry Revenue (million), by End-user Industry 2025 & 2033
- Figure 29: Asia Pacific MEA Payments Industry Revenue Share (%), by End-user Industry 2025 & 2033
- Figure 30: Asia Pacific MEA Payments Industry Revenue (million), by Country 2025 & 2033
- Figure 31: Asia Pacific MEA Payments Industry Revenue Share (%), by Country 2025 & 2033
List of Tables
- Table 1: Global MEA Payments Industry Revenue million Forecast, by Mode of Payment 2020 & 2033
- Table 2: Global MEA Payments Industry Revenue million Forecast, by End-user Industry 2020 & 2033
- Table 3: Global MEA Payments Industry Revenue million Forecast, by Region 2020 & 2033
- Table 4: Global MEA Payments Industry Revenue million Forecast, by Mode of Payment 2020 & 2033
- Table 5: Global MEA Payments Industry Revenue million Forecast, by End-user Industry 2020 & 2033
- Table 6: Global MEA Payments Industry Revenue million Forecast, by Country 2020 & 2033
- Table 7: United States MEA Payments Industry Revenue (million) Forecast, by Application 2020 & 2033
- Table 8: Canada MEA Payments Industry Revenue (million) Forecast, by Application 2020 & 2033
- Table 9: Mexico MEA Payments Industry Revenue (million) Forecast, by Application 2020 & 2033
- Table 10: Global MEA Payments Industry Revenue million Forecast, by Mode of Payment 2020 & 2033
- Table 11: Global MEA Payments Industry Revenue million Forecast, by End-user Industry 2020 & 2033
- Table 12: Global MEA Payments Industry Revenue million Forecast, by Country 2020 & 2033
- Table 13: Brazil MEA Payments Industry Revenue (million) Forecast, by Application 2020 & 2033
- Table 14: Argentina MEA Payments Industry Revenue (million) Forecast, by Application 2020 & 2033
- Table 15: Rest of South America MEA Payments Industry Revenue (million) Forecast, by Application 2020 & 2033
- Table 16: Global MEA Payments Industry Revenue million Forecast, by Mode of Payment 2020 & 2033
- Table 17: Global MEA Payments Industry Revenue million Forecast, by End-user Industry 2020 & 2033
- Table 18: Global MEA Payments Industry Revenue million Forecast, by Country 2020 & 2033
- Table 19: United Kingdom MEA Payments Industry Revenue (million) Forecast, by Application 2020 & 2033
- Table 20: Germany MEA Payments Industry Revenue (million) Forecast, by Application 2020 & 2033
- Table 21: France MEA Payments Industry Revenue (million) Forecast, by Application 2020 & 2033
- Table 22: Italy MEA Payments Industry Revenue (million) Forecast, by Application 2020 & 2033
- Table 23: Spain MEA Payments Industry Revenue (million) Forecast, by Application 2020 & 2033
- Table 24: Russia MEA Payments Industry Revenue (million) Forecast, by Application 2020 & 2033
- Table 25: Benelux MEA Payments Industry Revenue (million) Forecast, by Application 2020 & 2033
- Table 26: Nordics MEA Payments Industry Revenue (million) Forecast, by Application 2020 & 2033
- Table 27: Rest of Europe MEA Payments Industry Revenue (million) Forecast, by Application 2020 & 2033
- Table 28: Global MEA Payments Industry Revenue million Forecast, by Mode of Payment 2020 & 2033
- Table 29: Global MEA Payments Industry Revenue million Forecast, by End-user Industry 2020 & 2033
- Table 30: Global MEA Payments Industry Revenue million Forecast, by Country 2020 & 2033
- Table 31: Turkey MEA Payments Industry Revenue (million) Forecast, by Application 2020 & 2033
- Table 32: Israel MEA Payments Industry Revenue (million) Forecast, by Application 2020 & 2033
- Table 33: GCC MEA Payments Industry Revenue (million) Forecast, by Application 2020 & 2033
- Table 34: North Africa MEA Payments Industry Revenue (million) Forecast, by Application 2020 & 2033
- Table 35: South Africa MEA Payments Industry Revenue (million) Forecast, by Application 2020 & 2033
- Table 36: Rest of Middle East & Africa MEA Payments Industry Revenue (million) Forecast, by Application 2020 & 2033
- Table 37: Global MEA Payments Industry Revenue million Forecast, by Mode of Payment 2020 & 2033
- Table 38: Global MEA Payments Industry Revenue million Forecast, by End-user Industry 2020 & 2033
- Table 39: Global MEA Payments Industry Revenue million Forecast, by Country 2020 & 2033
- Table 40: China MEA Payments Industry Revenue (million) Forecast, by Application 2020 & 2033
- Table 41: India MEA Payments Industry Revenue (million) Forecast, by Application 2020 & 2033
- Table 42: Japan MEA Payments Industry Revenue (million) Forecast, by Application 2020 & 2033
- Table 43: South Korea MEA Payments Industry Revenue (million) Forecast, by Application 2020 & 2033
- Table 44: ASEAN MEA Payments Industry Revenue (million) Forecast, by Application 2020 & 2033
- Table 45: Oceania MEA Payments Industry Revenue (million) Forecast, by Application 2020 & 2033
- Table 46: Rest of Asia Pacific MEA Payments Industry Revenue (million) Forecast, by Application 2020 & 2033
Frequently Asked Questions
1. What is the projected Compound Annual Growth Rate (CAGR) of the MEA Payments Industry?
The projected CAGR is approximately 7.1%.
2. Which companies are prominent players in the MEA Payments Industry?
Key companies in the market include Safaricom Plc, Opay, Visa Inc, Jumia, Paytabs, PalmPay Technology Co Ltd, Interswitch Ltd, Amazon com Inc *List Not Exhaustive, Apple Inc, Network International Holdings Plc.
3. What are the main segments of the MEA Payments Industry?
The market segments include Mode of Payment, End-user Industry.
4. Can you provide details about the market size?
The market size is estimated to be USD 20672.1 million as of 2022.
5. What are some drivers contributing to market growth?
Digital adoption is Accelerating the Payments Market in Middle East and Africa; Key Retailers and the Government are Promoting Market Digitization Through Activation Programs; Increase in Real-Time Payments. Particularly Buy Now Pay Later.
6. What are the notable trends driving market growth?
Digital adoption is Accelerating the Payments Market in Middle East and Africa.
7. Are there any restraints impacting market growth?
Lack of Standards in Applications and Initial Costs.
8. Can you provide examples of recent developments in the market?
June 2022 - The London Internet Exchange (LINX), one of the world's largest internet exchange points (IXPs), has announced a strategic partnership with IXAfrica, a Nairobi-based hyperscale data center provider. As part of the agreement, LINX will open a new interconnection facility in Nairobi, marking the company's first physical presence on the African continent.
9. What pricing options are available for accessing the report?
Pricing options include single-user, multi-user, and enterprise licenses priced at USD 4750, USD 4950, and USD 6800 respectively.
10. Is the market size provided in terms of value or volume?
The market size is provided in terms of value, measured in million.
11. Are there any specific market keywords associated with the report?
Yes, the market keyword associated with the report is "MEA Payments Industry," which aids in identifying and referencing the specific market segment covered.
12. How do I determine which pricing option suits my needs best?
The pricing options vary based on user requirements and access needs. Individual users may opt for single-user licenses, while businesses requiring broader access may choose multi-user or enterprise licenses for cost-effective access to the report.
13. Are there any additional resources or data provided in the MEA Payments Industry report?
While the report offers comprehensive insights, it's advisable to review the specific contents or supplementary materials provided to ascertain if additional resources or data are available.
14. How can I stay updated on further developments or reports in the MEA Payments Industry?
To stay informed about further developments, trends, and reports in the MEA Payments Industry, consider subscribing to industry newsletters, following relevant companies and organizations, or regularly checking reputable industry news sources and publications.
Methodology
Step 1 - Identification of Relevant Samples Size from Population Database


Step 2 - Approaches for Defining Global Market Size (Value, Volume* & Price*)

Note*: In applicable scenarios
Step 3 - Data Sources
Primary Research
- Web Analytics
- Survey Reports
- Research Institute
- Latest Research Reports
- Opinion Leaders
Secondary Research
- Annual Reports
- White Paper
- Latest Press Release
- Industry Association
- Paid Database
- Investor Presentations

Step 4 - Data Triangulation
Involves using different sources of information in order to increase the validity of a study
These sources are likely to be stakeholders in a program - participants, other researchers, program staff, other community members, and so on.
Then we put all data in single framework & apply various statistical tools to find out the dynamic on the market.
During the analysis stage, feedback from the stakeholder groups would be compared to determine areas of agreement as well as areas of divergence

