

Key Insights
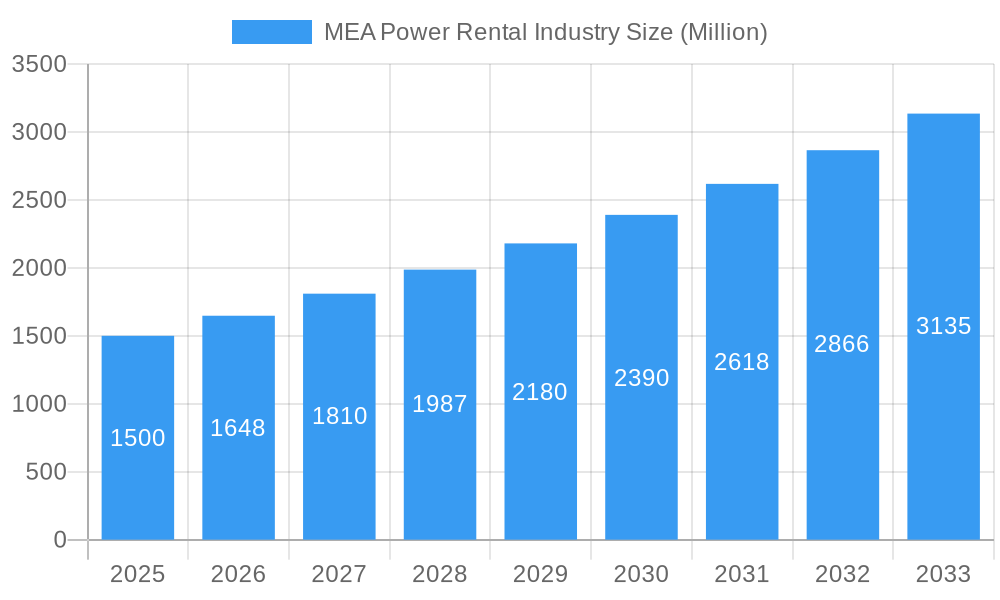
The Middle East & Africa (MEA) Power Rental market is poised for significant expansion, projected at $2.17 billion by 2025, with a Compound Annual Growth Rate (CAGR) of 5.4% from 2025 to 2033. This growth is propelled by robust infrastructure development across key sectors like oil & gas and construction, particularly in nations such as the UAE and Saudi Arabia. Increasing demand for dependable, flexible power solutions, emergency standby power during grid instability, and peak shaving strategies to optimize energy costs are key market drivers. The market is segmented by application (prime power, peak shaving, emergency standby), end-user (utilities, oil & gas, construction), and fuel type (natural gas, diesel). While natural gas currently leads due to cost-effectiveness and environmental advantages, the market is evolving towards diverse fuel options aligned with project requirements and regional regulations. Leading players are strategically expanding their service portfolios and geographic presence to capitalize on these opportunities.
MEA Power Rental Industry Market Size (In Billion)
The forecast period (2025-2033) indicates sustained market growth driven by large-scale infrastructure projects and increased government investment in energy modernization. Key challenges include fluctuating fuel prices, stringent environmental regulations, and the requirement for a skilled workforce. Industry participants are mitigating these by adopting advanced technologies, including fuel-efficient generators and remote monitoring systems, and prioritizing sustainable practices. The market's growth trajectory underscores its vital role in supporting the MEA region's economic development and energy security. Furthermore, the expansion of renewable energy sources is expected to create new avenues for specialized power rental services supporting hybrid energy systems.
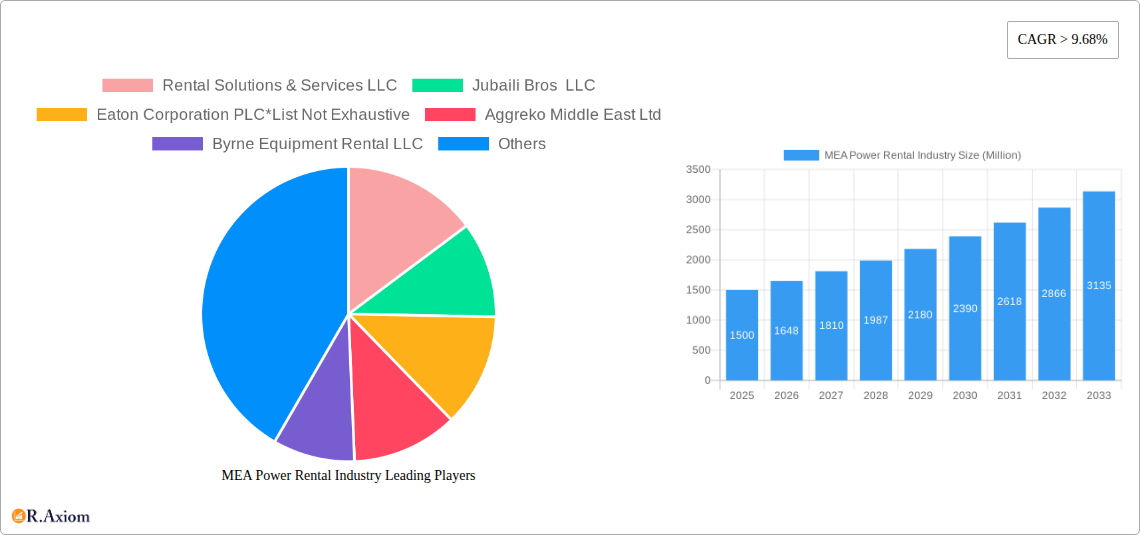
MEA Power Rental Industry Company Market Share
This comprehensive report delivers in-depth analysis of the MEA Power Rental market, detailing market size, segmentation, growth catalysts, challenges, and key industry participants. The study encompasses the period from 2019 to 2033, with 2025 designated as the base and estimated year. Actionable insights are provided for industry stakeholders, investors, and businesses operating within this dynamic market. The projected market value for 2025 is $2.17 billion, with an anticipated CAGR of 5.4% during the 2025-2033 forecast period.
MEA Power Rental Industry Market Concentration & Innovation
This section analyzes the MEA power rental market's competitive landscape, innovation drivers, and regulatory environment. The market exhibits a moderately concentrated structure, with a few large players such as Aggreko Middle East Ltd and Eaton Corporation PLC holding significant market share. However, several smaller, regional players like Rental Solutions & Services LLC and Byrne Equipment Rental LLC contribute substantially to the overall market activity.
- Market Concentration: The top 5 players collectively hold an estimated xx% market share in 2025. The Herfindahl-Hirschman Index (HHI) is estimated at xx, indicating a moderately concentrated market.
- Innovation Drivers: Technological advancements in generator technology (e.g., increased efficiency, reduced emissions), the adoption of digital technologies for remote monitoring and asset management, and the growing demand for sustainable power solutions are key drivers of innovation.
- Regulatory Frameworks: Varying regulatory frameworks across different MEA countries impact the market. Harmonization of regulations and streamlining of permitting processes could boost market growth.
- Product Substitutes: Renewable energy sources, such as solar and wind power, represent a growing substitute for diesel generators in certain applications. However, the power rental industry continues to benefit from its flexibility and responsiveness to fluctuating energy demands.
- End-User Trends: Increased investments in infrastructure projects (Oil & Gas, Construction, and Utilities) across the MEA region are driving demand for power rental services. The shift towards more sustainable practices is creating opportunities for providers offering environmentally friendly solutions.
- M&A Activities: The MEA power rental market witnessed xx Million worth of M&A deals in the period between 2019 and 2024. Further consolidation is expected in the coming years as larger players seek to expand their market share and geographical reach.
MEA Power Rental Industry Industry Trends & Insights
The MEA power rental market is experiencing robust growth, driven by several factors. The increasing demand for reliable power in regions with underdeveloped grid infrastructure fuels market expansion. The rising adoption of temporary power solutions for events, construction sites, and industrial projects further accelerates this growth. Technological advancements, such as the development of quieter and more fuel-efficient generators, and the integration of smart technologies are creating new opportunities.
The market's growth is propelled by significant investments in infrastructure development across various sectors, including oil and gas, construction, and utilities. These investments directly translate to increased demand for reliable power solutions, favoring the power rental sector. Moreover, the region's rapidly expanding population and industrialization create an immense need for temporary and supplemental power supplies. The CAGR of the MEA power rental market is projected at xx% between 2025 and 2033. The market penetration rate is currently estimated at xx%, with significant potential for further expansion. Competitive dynamics are characterized by both price competition and a focus on offering value-added services like maintenance contracts and remote monitoring. The increasing preference for sustainable energy solutions is influencing market trends, pushing the industry towards cleaner fuel options and more efficient equipment.
Dominant Markets & Segments in MEA Power Rental Industry
The MEA power rental market is geographically diverse, with significant variations in growth rates and segment dominance across different countries and regions. The most dominant application segment is Prime Power, driven by the sustained growth of industries and infrastructure projects across the region. Within the end-user segments, the Oil and Gas sector displays the highest demand for power rental services due to its energy-intensive nature and the need for reliable power in remote locations. Key drivers for market dominance are:
Prime Power: Driven by continuous industrialization and infrastructure development across the MEA region.
Utilities: High demand arises from network maintenance, upgrades, and expansion projects.
Oil & Gas: Energy-intensive operations necessitate reliable temporary power sources.
Diesel Fuel Type: Diesel remains the dominant fuel type, owing to its widespread availability and established infrastructure.
Key Drivers for Dominance:
- Economic Growth: Robust economic growth in several MEA countries fuels demand for infrastructure development and industrial expansion.
- Infrastructure Development: Significant investments in infrastructure projects create a large market for power rental services.
- Government Policies: Supportive government policies incentivizing infrastructure development and industrial growth positively impact market growth.
The Middle East region, particularly the Gulf Cooperation Council (GCC) countries, constitutes the largest market within the MEA region, owing to its substantial investments in infrastructure development and oil and gas operations.
MEA Power Rental Industry Product Developments
Recent product developments focus on improving generator efficiency, reducing noise levels, and incorporating smart technologies. The adoption of digital technologies allows remote monitoring, predictive maintenance, and optimized fuel consumption. Generators with cleaner fuel options like natural gas and hybrid solutions are gaining traction, aligning with the growing focus on sustainability. These innovations enhance the market fit by offering cost savings and environmental benefits. This reflects market trends toward both efficiency and environmental responsibility.
Report Scope & Segmentation Analysis
This report segments the MEA power rental market based on application (Prime Power, Peak Shaving, Emergency Standby), end-user (Utilities, Oil and Gas, Construction, Other End-Users), and fuel type (Natural Gas, Diesel). Each segment exhibits unique growth trajectories and competitive dynamics.
- Application: Prime Power holds the largest market share, followed by Peak Shaving and Emergency Standby. Growth projections for each segment are driven by the respective industry's expansion and infrastructure development.
- End-User: The Oil and Gas sector is projected to dominate the market due to its considerable power needs, while the Construction sector is expected to show significant growth.
- Fuel Type: Diesel currently holds the largest market share, but the adoption of Natural Gas is expected to increase due to environmental concerns and potential cost advantages.
The competitive dynamics within each segment vary, with larger players focusing on broader portfolios and specialized niche players focusing on specific applications or end-user sectors.
Key Drivers of MEA Power Rental Industry Growth
The MEA power rental industry's growth is primarily driven by:
- Infrastructure Development: Extensive investments in infrastructure projects across the region create substantial demand for temporary power solutions.
- Economic Growth: Robust economic growth in several MEA countries fuels industrial expansion and energy consumption.
- Technological Advancements: Innovations in generator technology, including enhanced efficiency and reduced emissions, are enhancing market appeal.
- Regulatory Support: Supportive government policies promoting infrastructure development and industrialization benefit the market.
Challenges in the MEA Power Rental Industry Sector
Several challenges hinder the MEA power rental industry's growth:
- Regulatory Hurdles: Inconsistent regulatory frameworks and permitting processes across different countries create operational complexities and increase costs.
- Supply Chain Disruptions: Global supply chain disruptions can impact the availability of generators and spare parts, affecting operational efficiency.
- Competitive Pressures: Intense competition among existing players and the entry of new players exert downward pressure on prices, affecting profitability.
Emerging Opportunities in MEA Power Rental Industry
Emerging opportunities in the MEA power rental industry include:
- Renewable Energy Integration: The integration of renewable energy sources with power rental solutions offers significant potential for growth.
- Smart Technology Adoption: The increased adoption of smart technologies for remote monitoring and asset management can optimize operations and improve customer experience.
- Focus on Sustainability: The growing emphasis on sustainable power solutions creates opportunities for providers offering cleaner and more efficient generators.
Leading Players in the MEA Power Rental Industry Market
- Rental Solutions & Services LLC (If applicable, replace with actual link)
- Jubaili Bros LLC
- Eaton Corporation PLC
- Aggreko Middle East Ltd
- Byrne Equipment Rental LLC
- Jozi Power Limited
- SES SMART Energy Solutions FZCO
- KPS Power Generation
- Peax Equipment Rental
Key Developments in MEA Power Rental Industry Industry
- 2022 Q4: Aggreko Middle East Ltd launched a new range of hybrid generators.
- 2023 Q1: Rental Solutions & Services LLC secured a major contract for a large-scale infrastructure project.
- 2023 Q2: A significant merger between two regional power rental companies was announced. (Further details could be added here if available).
Strategic Outlook for MEA Power Rental Industry Market
The MEA power rental market presents a significant growth opportunity, driven by sustained infrastructure development, industrial expansion, and the increasing adoption of temporary power solutions. The market is poised for further consolidation as larger players seek to expand their market share and geographical reach. Strategic investments in new technologies, including renewable energy integration and smart technology adoption, will be crucial for success in this competitive market. The focus on sustainability and environmental responsibility will increasingly shape market trends.
MEA Power Rental Industry Segmentation
-
1. End-User
- 1.1. Utilities
- 1.2. Oil and Gas
- 1.3. Construction
- 1.4. Other End-Users
-
2. Fuel Type
- 2.1. Natural Gas
- 2.2. Diesel
-
3. Application
- 3.1. Prime Power
- 3.2. Peak Shaving
- 3.3. Emergency Standby
-
4. Geography
- 4.1. South Africa
- 4.2. Saudi Arabia
- 4.3. United Arab Emirates
- 4.4. Rest of Middle East and Africa
MEA Power Rental Industry Segmentation By Geography
- 1. South Africa
- 2. Saudi Arabia
- 3. United Arab Emirates
- 4. Rest of Middle East and Africa
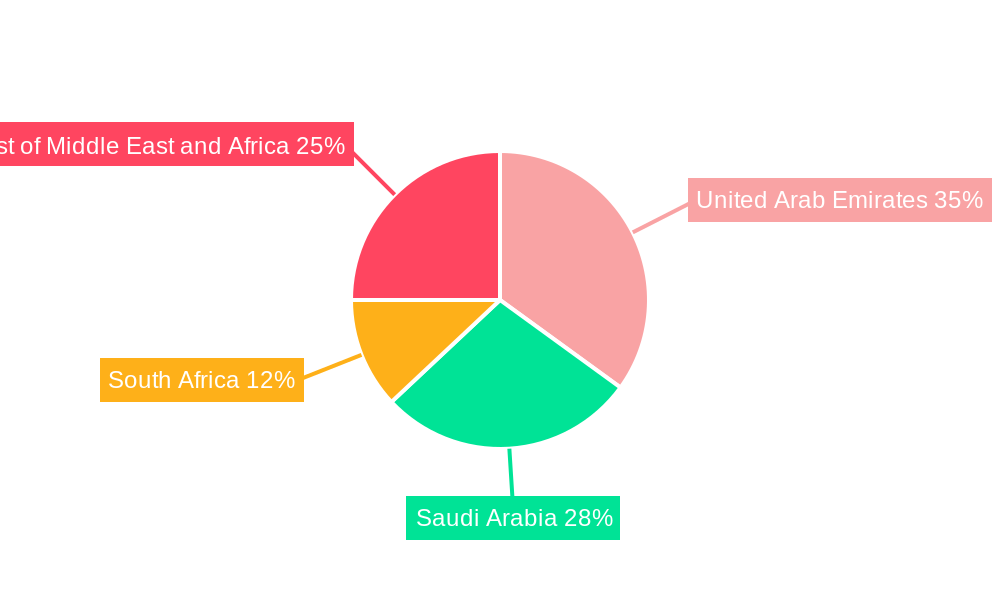
MEA Power Rental Industry Regional Market Share
Geographic Coverage of MEA Power Rental Industry
MEA Power Rental Industry REPORT HIGHLIGHTS
| Aspects | Details |
|---|---|
| Study Period | 2020-2034 |
| Base Year | 2025 |
| Estimated Year | 2026 |
| Forecast Period | 2026-2034 |
| Historical Period | 2020-2025 |
| Growth Rate | CAGR of 5.4% from 2020-2034 |
| Segmentation |
|
Table of Contents
- 1. Introduction
- 1.1. Research Scope
- 1.2. Market Segmentation
- 1.3. Research Objective
- 1.4. Definitions and Assumptions
- 2. Executive Summary
- 2.1. Market Snapshot
- 3. Market Dynamics
- 3.1. Market Drivers
- 3.2. Market Restrains
- 3.3. Market Trends
- 3.4. Market Opportunities
- 4. Market Factor Analysis
- 4.1. Porters Five Forces
- 4.1.1. Bargaining Power of Suppliers
- 4.1.2. Bargaining Power of Buyers
- 4.1.3. Threat of New Entrants
- 4.1.4. Threat of Substitutes
- 4.1.5. Competitive Rivalry
- 4.2. PESTEL analysis
- 4.3. BCG Analysis
- 4.3.1. Stars (High Growth, High Market Share)
- 4.3.2. Cash Cows (Low Growth, High Market Share)
- 4.3.3. Question Mark (High Growth, Low Market Share)
- 4.3.4. Dogs (Low Growth, Low Market Share)
- 4.4. Ansoff Matrix Analysis
- 4.5. Supply Chain Analysis
- 4.6. Regulatory Landscape
- 4.7. Current Market Potential and Opportunity Assessment (TAM–SAM–SOM Framework)
- 4.8. RAX Analyst Note
- 4.1. Porters Five Forces
- 5. Market Analysis, Insights and Forecast 2021-2033
- 5.1. Market Analysis, Insights and Forecast - by End-User
- 5.1.1. Utilities
- 5.1.2. Oil and Gas
- 5.1.3. Construction
- 5.1.4. Other End-Users
- 5.2. Market Analysis, Insights and Forecast - by Fuel Type
- 5.2.1. Natural Gas
- 5.2.2. Diesel
- 5.3. Market Analysis, Insights and Forecast - by Application
- 5.3.1. Prime Power
- 5.3.2. Peak Shaving
- 5.3.3. Emergency Standby
- 5.4. Market Analysis, Insights and Forecast - by Geography
- 5.4.1. South Africa
- 5.4.2. Saudi Arabia
- 5.4.3. United Arab Emirates
- 5.4.4. Rest of Middle East and Africa
- 5.5. Market Analysis, Insights and Forecast - by Region
- 5.5.1. South Africa
- 5.5.2. Saudi Arabia
- 5.5.3. United Arab Emirates
- 5.5.4. Rest of Middle East and Africa
- 5.1. Market Analysis, Insights and Forecast - by End-User
- 6. Global MEA Power Rental Industry Analysis, Insights and Forecast, 2021-2033
- 6.1. Market Analysis, Insights and Forecast - by End-User
- 6.1.1. Utilities
- 6.1.2. Oil and Gas
- 6.1.3. Construction
- 6.1.4. Other End-Users
- 6.2. Market Analysis, Insights and Forecast - by Fuel Type
- 6.2.1. Natural Gas
- 6.2.2. Diesel
- 6.3. Market Analysis, Insights and Forecast - by Application
- 6.3.1. Prime Power
- 6.3.2. Peak Shaving
- 6.3.3. Emergency Standby
- 6.4. Market Analysis, Insights and Forecast - by Geography
- 6.4.1. South Africa
- 6.4.2. Saudi Arabia
- 6.4.3. United Arab Emirates
- 6.4.4. Rest of Middle East and Africa
- 6.1. Market Analysis, Insights and Forecast - by End-User
- 7. South Africa MEA Power Rental Industry Analysis, Insights and Forecast, 2020-2032
- 7.1. Market Analysis, Insights and Forecast - by End-User
- 7.1.1. Utilities
- 7.1.2. Oil and Gas
- 7.1.3. Construction
- 7.1.4. Other End-Users
- 7.2. Market Analysis, Insights and Forecast - by Fuel Type
- 7.2.1. Natural Gas
- 7.2.2. Diesel
- 7.3. Market Analysis, Insights and Forecast - by Application
- 7.3.1. Prime Power
- 7.3.2. Peak Shaving
- 7.3.3. Emergency Standby
- 7.4. Market Analysis, Insights and Forecast - by Geography
- 7.4.1. South Africa
- 7.4.2. Saudi Arabia
- 7.4.3. United Arab Emirates
- 7.4.4. Rest of Middle East and Africa
- 7.1. Market Analysis, Insights and Forecast - by End-User
- 8. Saudi Arabia MEA Power Rental Industry Analysis, Insights and Forecast, 2020-2032
- 8.1. Market Analysis, Insights and Forecast - by End-User
- 8.1.1. Utilities
- 8.1.2. Oil and Gas
- 8.1.3. Construction
- 8.1.4. Other End-Users
- 8.2. Market Analysis, Insights and Forecast - by Fuel Type
- 8.2.1. Natural Gas
- 8.2.2. Diesel
- 8.3. Market Analysis, Insights and Forecast - by Application
- 8.3.1. Prime Power
- 8.3.2. Peak Shaving
- 8.3.3. Emergency Standby
- 8.4. Market Analysis, Insights and Forecast - by Geography
- 8.4.1. South Africa
- 8.4.2. Saudi Arabia
- 8.4.3. United Arab Emirates
- 8.4.4. Rest of Middle East and Africa
- 8.1. Market Analysis, Insights and Forecast - by End-User
- 9. United Arab Emirates MEA Power Rental Industry Analysis, Insights and Forecast, 2020-2032
- 9.1. Market Analysis, Insights and Forecast - by End-User
- 9.1.1. Utilities
- 9.1.2. Oil and Gas
- 9.1.3. Construction
- 9.1.4. Other End-Users
- 9.2. Market Analysis, Insights and Forecast - by Fuel Type
- 9.2.1. Natural Gas
- 9.2.2. Diesel
- 9.3. Market Analysis, Insights and Forecast - by Application
- 9.3.1. Prime Power
- 9.3.2. Peak Shaving
- 9.3.3. Emergency Standby
- 9.4. Market Analysis, Insights and Forecast - by Geography
- 9.4.1. South Africa
- 9.4.2. Saudi Arabia
- 9.4.3. United Arab Emirates
- 9.4.4. Rest of Middle East and Africa
- 9.1. Market Analysis, Insights and Forecast - by End-User
- 10. Rest of Middle East and Africa MEA Power Rental Industry Analysis, Insights and Forecast, 2020-2032
- 10.1. Market Analysis, Insights and Forecast - by End-User
- 10.1.1. Utilities
- 10.1.2. Oil and Gas
- 10.1.3. Construction
- 10.1.4. Other End-Users
- 10.2. Market Analysis, Insights and Forecast - by Fuel Type
- 10.2.1. Natural Gas
- 10.2.2. Diesel
- 10.3. Market Analysis, Insights and Forecast - by Application
- 10.3.1. Prime Power
- 10.3.2. Peak Shaving
- 10.3.3. Emergency Standby
- 10.4. Market Analysis, Insights and Forecast - by Geography
- 10.4.1. South Africa
- 10.4.2. Saudi Arabia
- 10.4.3. United Arab Emirates
- 10.4.4. Rest of Middle East and Africa
- 10.1. Market Analysis, Insights and Forecast - by End-User
- 11. Competitive Analysis
- 11.1. Company Profiles
- 11.1.1 Rental Solutions & Services LLC
- 11.1.1.1. Company Overview
- 11.1.1.2. Products
- 11.1.1.3. Company Financials
- 11.1.1.4. SWOT Analysis
- 11.1.2 Jubaili Bros LLC
- 11.1.2.1. Company Overview
- 11.1.2.2. Products
- 11.1.2.3. Company Financials
- 11.1.2.4. SWOT Analysis
- 11.1.3 Eaton Corporation PLC*List Not Exhaustive
- 11.1.3.1. Company Overview
- 11.1.3.2. Products
- 11.1.3.3. Company Financials
- 11.1.3.4. SWOT Analysis
- 11.1.4 Aggreko Middle East Ltd
- 11.1.4.1. Company Overview
- 11.1.4.2. Products
- 11.1.4.3. Company Financials
- 11.1.4.4. SWOT Analysis
- 11.1.5 Byrne Equipment Rental LLC
- 11.1.5.1. Company Overview
- 11.1.5.2. Products
- 11.1.5.3. Company Financials
- 11.1.5.4. SWOT Analysis
- 11.1.6 Jozi Power Limited
- 11.1.6.1. Company Overview
- 11.1.6.2. Products
- 11.1.6.3. Company Financials
- 11.1.6.4. SWOT Analysis
- 11.1.7 SES SMART Energy Solutions FZCO
- 11.1.7.1. Company Overview
- 11.1.7.2. Products
- 11.1.7.3. Company Financials
- 11.1.7.4. SWOT Analysis
- 11.1.8 KPS Power Generation
- 11.1.8.1. Company Overview
- 11.1.8.2. Products
- 11.1.8.3. Company Financials
- 11.1.8.4. SWOT Analysis
- 11.1.9 Peax Equipment Rental
- 11.1.9.1. Company Overview
- 11.1.9.2. Products
- 11.1.9.3. Company Financials
- 11.1.9.4. SWOT Analysis
- 11.1.1 Rental Solutions & Services LLC
- 11.2. Market Entropy
- 11.2.1 Company's Key Areas Served
- 11.2.2 Recent Developments
- 11.3. Company Market Share Analysis 2025
- 11.3.1 Top 5 Companies Market Share Analysis
- 11.3.2 Top 3 Companies Market Share Analysis
- 11.4. List of Potential Customers
- 12. Research Methodology
List of Figures
- Figure 1: Global MEA Power Rental Industry Revenue Breakdown (billion, %) by Region 2025 & 2033
- Figure 2: South Africa MEA Power Rental Industry Revenue (billion), by End-User 2025 & 2033
- Figure 3: South Africa MEA Power Rental Industry Revenue Share (%), by End-User 2025 & 2033
- Figure 4: South Africa MEA Power Rental Industry Revenue (billion), by Fuel Type 2025 & 2033
- Figure 5: South Africa MEA Power Rental Industry Revenue Share (%), by Fuel Type 2025 & 2033
- Figure 6: South Africa MEA Power Rental Industry Revenue (billion), by Application 2025 & 2033
- Figure 7: South Africa MEA Power Rental Industry Revenue Share (%), by Application 2025 & 2033
- Figure 8: South Africa MEA Power Rental Industry Revenue (billion), by Geography 2025 & 2033
- Figure 9: South Africa MEA Power Rental Industry Revenue Share (%), by Geography 2025 & 2033
- Figure 10: South Africa MEA Power Rental Industry Revenue (billion), by Country 2025 & 2033
- Figure 11: South Africa MEA Power Rental Industry Revenue Share (%), by Country 2025 & 2033
- Figure 12: Saudi Arabia MEA Power Rental Industry Revenue (billion), by End-User 2025 & 2033
- Figure 13: Saudi Arabia MEA Power Rental Industry Revenue Share (%), by End-User 2025 & 2033
- Figure 14: Saudi Arabia MEA Power Rental Industry Revenue (billion), by Fuel Type 2025 & 2033
- Figure 15: Saudi Arabia MEA Power Rental Industry Revenue Share (%), by Fuel Type 2025 & 2033
- Figure 16: Saudi Arabia MEA Power Rental Industry Revenue (billion), by Application 2025 & 2033
- Figure 17: Saudi Arabia MEA Power Rental Industry Revenue Share (%), by Application 2025 & 2033
- Figure 18: Saudi Arabia MEA Power Rental Industry Revenue (billion), by Geography 2025 & 2033
- Figure 19: Saudi Arabia MEA Power Rental Industry Revenue Share (%), by Geography 2025 & 2033
- Figure 20: Saudi Arabia MEA Power Rental Industry Revenue (billion), by Country 2025 & 2033
- Figure 21: Saudi Arabia MEA Power Rental Industry Revenue Share (%), by Country 2025 & 2033
- Figure 22: United Arab Emirates MEA Power Rental Industry Revenue (billion), by End-User 2025 & 2033
- Figure 23: United Arab Emirates MEA Power Rental Industry Revenue Share (%), by End-User 2025 & 2033
- Figure 24: United Arab Emirates MEA Power Rental Industry Revenue (billion), by Fuel Type 2025 & 2033
- Figure 25: United Arab Emirates MEA Power Rental Industry Revenue Share (%), by Fuel Type 2025 & 2033
- Figure 26: United Arab Emirates MEA Power Rental Industry Revenue (billion), by Application 2025 & 2033
- Figure 27: United Arab Emirates MEA Power Rental Industry Revenue Share (%), by Application 2025 & 2033
- Figure 28: United Arab Emirates MEA Power Rental Industry Revenue (billion), by Geography 2025 & 2033
- Figure 29: United Arab Emirates MEA Power Rental Industry Revenue Share (%), by Geography 2025 & 2033
- Figure 30: United Arab Emirates MEA Power Rental Industry Revenue (billion), by Country 2025 & 2033
- Figure 31: United Arab Emirates MEA Power Rental Industry Revenue Share (%), by Country 2025 & 2033
- Figure 32: Rest of Middle East and Africa MEA Power Rental Industry Revenue (billion), by End-User 2025 & 2033
- Figure 33: Rest of Middle East and Africa MEA Power Rental Industry Revenue Share (%), by End-User 2025 & 2033
- Figure 34: Rest of Middle East and Africa MEA Power Rental Industry Revenue (billion), by Fuel Type 2025 & 2033
- Figure 35: Rest of Middle East and Africa MEA Power Rental Industry Revenue Share (%), by Fuel Type 2025 & 2033
- Figure 36: Rest of Middle East and Africa MEA Power Rental Industry Revenue (billion), by Application 2025 & 2033
- Figure 37: Rest of Middle East and Africa MEA Power Rental Industry Revenue Share (%), by Application 2025 & 2033
- Figure 38: Rest of Middle East and Africa MEA Power Rental Industry Revenue (billion), by Geography 2025 & 2033
- Figure 39: Rest of Middle East and Africa MEA Power Rental Industry Revenue Share (%), by Geography 2025 & 2033
- Figure 40: Rest of Middle East and Africa MEA Power Rental Industry Revenue (billion), by Country 2025 & 2033
- Figure 41: Rest of Middle East and Africa MEA Power Rental Industry Revenue Share (%), by Country 2025 & 2033
List of Tables
- Table 1: Global MEA Power Rental Industry Revenue billion Forecast, by End-User 2020 & 2033
- Table 2: Global MEA Power Rental Industry Revenue billion Forecast, by Fuel Type 2020 & 2033
- Table 3: Global MEA Power Rental Industry Revenue billion Forecast, by Application 2020 & 2033
- Table 4: Global MEA Power Rental Industry Revenue billion Forecast, by Geography 2020 & 2033
- Table 5: Global MEA Power Rental Industry Revenue billion Forecast, by Region 2020 & 2033
- Table 6: Global MEA Power Rental Industry Revenue billion Forecast, by End-User 2020 & 2033
- Table 7: Global MEA Power Rental Industry Revenue billion Forecast, by Fuel Type 2020 & 2033
- Table 8: Global MEA Power Rental Industry Revenue billion Forecast, by Application 2020 & 2033
- Table 9: Global MEA Power Rental Industry Revenue billion Forecast, by Geography 2020 & 2033
- Table 10: Global MEA Power Rental Industry Revenue billion Forecast, by Country 2020 & 2033
- Table 11: Global MEA Power Rental Industry Revenue billion Forecast, by End-User 2020 & 2033
- Table 12: Global MEA Power Rental Industry Revenue billion Forecast, by Fuel Type 2020 & 2033
- Table 13: Global MEA Power Rental Industry Revenue billion Forecast, by Application 2020 & 2033
- Table 14: Global MEA Power Rental Industry Revenue billion Forecast, by Geography 2020 & 2033
- Table 15: Global MEA Power Rental Industry Revenue billion Forecast, by Country 2020 & 2033
- Table 16: Global MEA Power Rental Industry Revenue billion Forecast, by End-User 2020 & 2033
- Table 17: Global MEA Power Rental Industry Revenue billion Forecast, by Fuel Type 2020 & 2033
- Table 18: Global MEA Power Rental Industry Revenue billion Forecast, by Application 2020 & 2033
- Table 19: Global MEA Power Rental Industry Revenue billion Forecast, by Geography 2020 & 2033
- Table 20: Global MEA Power Rental Industry Revenue billion Forecast, by Country 2020 & 2033
- Table 21: Global MEA Power Rental Industry Revenue billion Forecast, by End-User 2020 & 2033
- Table 22: Global MEA Power Rental Industry Revenue billion Forecast, by Fuel Type 2020 & 2033
- Table 23: Global MEA Power Rental Industry Revenue billion Forecast, by Application 2020 & 2033
- Table 24: Global MEA Power Rental Industry Revenue billion Forecast, by Geography 2020 & 2033
- Table 25: Global MEA Power Rental Industry Revenue billion Forecast, by Country 2020 & 2033
Frequently Asked Questions
1. What is the projected Compound Annual Growth Rate (CAGR) of the MEA Power Rental Industry?
The projected CAGR is approximately 5.4%.
2. Which companies are prominent players in the MEA Power Rental Industry?
Key companies in the market include Rental Solutions & Services LLC, Jubaili Bros LLC, Eaton Corporation PLC*List Not Exhaustive, Aggreko Middle East Ltd, Byrne Equipment Rental LLC, Jozi Power Limited, SES SMART Energy Solutions FZCO, KPS Power Generation, Peax Equipment Rental.
3. What are the main segments of the MEA Power Rental Industry?
The market segments include End-User, Fuel Type, Application, Geography.
4. Can you provide details about the market size?
The market size is estimated to be USD 2.17 billion as of 2022.
5. What are some drivers contributing to market growth?
4.; Favorable Government Policies.
6. What are the notable trends driving market growth?
Utility Segment to Dominate the Market.
7. Are there any restraints impacting market growth?
4.; Rising Emphasis on Other Alternative Clean Energy Sources.
8. Can you provide examples of recent developments in the market?
N/A
9. What pricing options are available for accessing the report?
Pricing options include single-user, multi-user, and enterprise licenses priced at USD 4750, USD 5250, and USD 8750 respectively.
10. Is the market size provided in terms of value or volume?
The market size is provided in terms of value, measured in billion.
11. Are there any specific market keywords associated with the report?
Yes, the market keyword associated with the report is "MEA Power Rental Industry," which aids in identifying and referencing the specific market segment covered.
12. How do I determine which pricing option suits my needs best?
The pricing options vary based on user requirements and access needs. Individual users may opt for single-user licenses, while businesses requiring broader access may choose multi-user or enterprise licenses for cost-effective access to the report.
13. Are there any additional resources or data provided in the MEA Power Rental Industry report?
While the report offers comprehensive insights, it's advisable to review the specific contents or supplementary materials provided to ascertain if additional resources or data are available.
14. How can I stay updated on further developments or reports in the MEA Power Rental Industry?
To stay informed about further developments, trends, and reports in the MEA Power Rental Industry, consider subscribing to industry newsletters, following relevant companies and organizations, or regularly checking reputable industry news sources and publications.
Methodology
Step 1 - Identification of Relevant Samples Size from Population Database


Step 2 - Approaches for Defining Global Market Size (Value, Volume* & Price*)

Note*: In applicable scenarios
Step 3 - Data Sources
Primary Research
- Web Analytics
- Survey Reports
- Research Institute
- Latest Research Reports
- Opinion Leaders
Secondary Research
- Annual Reports
- White Paper
- Latest Press Release
- Industry Association
- Paid Database
- Investor Presentations

Step 4 - Data Triangulation
Involves using different sources of information in order to increase the validity of a study
These sources are likely to be stakeholders in a program - participants, other researchers, program staff, other community members, and so on.
Then we put all data in single framework & apply various statistical tools to find out the dynamic on the market.
During the analysis stage, feedback from the stakeholder groups would be compared to determine areas of agreement as well as areas of divergence