
Key Insights
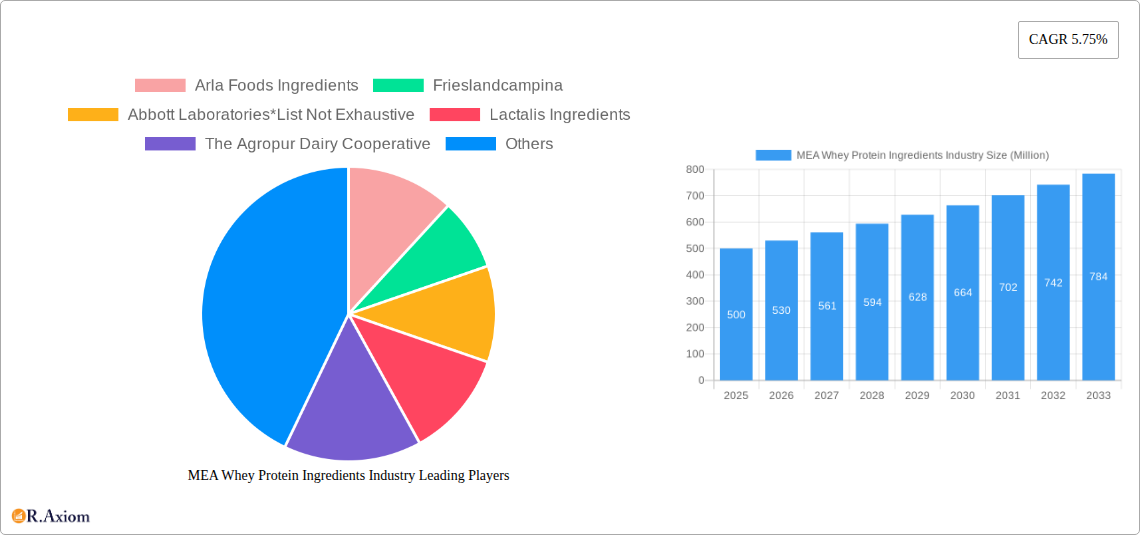
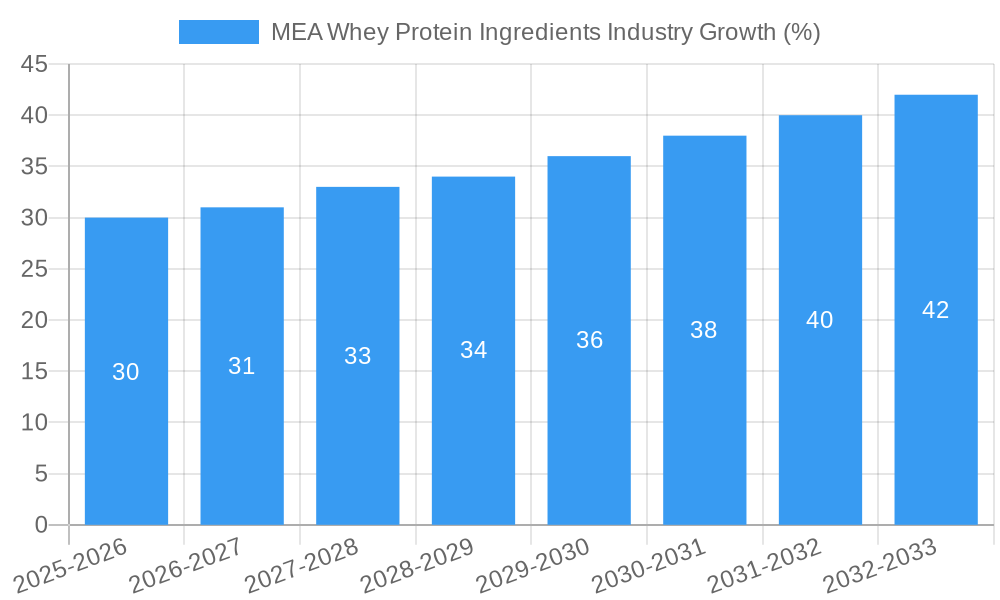
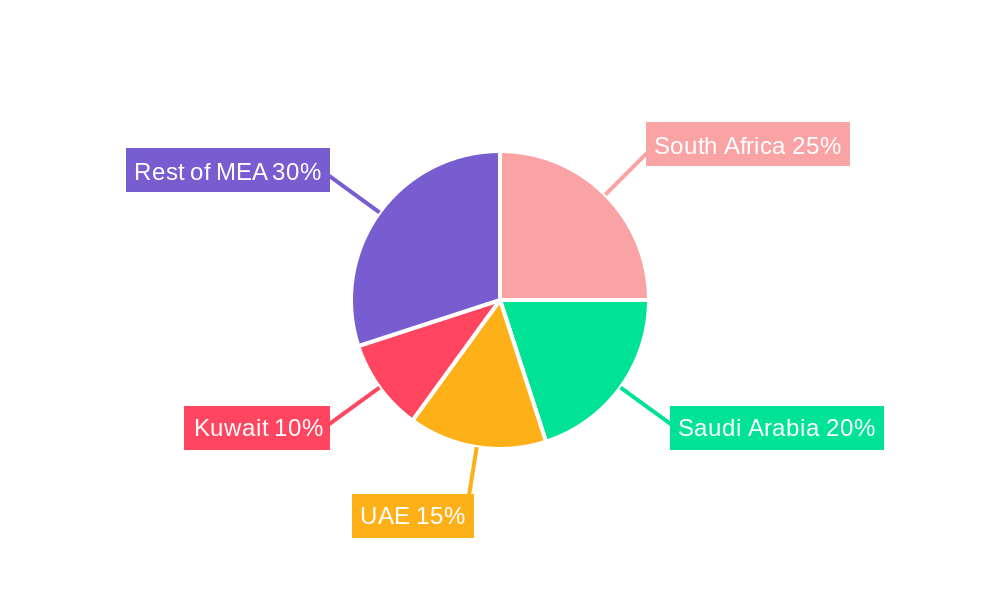
The Middle East and Africa (MEA) whey protein ingredients market, valued at $500 million in 2025, is projected to experience robust growth, driven by a compound annual growth rate (CAGR) of 5.75% from 2025 to 2033. This expansion is fueled by several key factors. The rising popularity of fitness and wellness lifestyles across the region is boosting demand for sports and performance nutrition products, a major application segment for whey protein. Furthermore, the growing awareness of the nutritional benefits of whey protein, particularly its high protein content and ease of digestibility, is driving its incorporation into infant formula and functional foods. The increasing disposable incomes in several MEA countries, coupled with a burgeoning middle class, are also contributing to higher consumer spending on health and wellness products, further bolstering market growth. However, challenges exist, including fluctuating raw material prices and potential supply chain disruptions. Moreover, stringent regulatory frameworks regarding food additives and labeling in certain countries may pose some limitations. The market is segmented by product type (whey protein concentrate, isolate, and hydrolysate), application (sports nutrition, infant formula, functional foods, and others), and geography (South Africa, Saudi Arabia, UAE, Kuwait, and the Rest of MEA). Key players in this dynamic market include established international and regional manufacturers leveraging brand recognition and distribution networks to capture market share.
The market's future trajectory hinges on several factors. Continued growth in health consciousness and fitness adoption, particularly among younger demographics, will be crucial. Innovation in product formulations, including the development of specialized whey protein blends catering to specific dietary needs and preferences, will also influence market dynamics. Strategic partnerships and collaborations between ingredient suppliers and food manufacturers can facilitate product development and wider market penetration. Government initiatives promoting healthy eating and active lifestyles can further accelerate market expansion. Successfully navigating regulatory landscapes and managing supply chain complexities will be critical for continued growth and profitability within the MEA whey protein ingredients market.
This detailed report provides a comprehensive analysis of the Middle East and Africa (MEA) whey protein ingredients industry, offering invaluable insights for industry stakeholders, investors, and strategic decision-makers. The report covers the period from 2019 to 2033, with a focus on the base year 2025 and a forecast period spanning 2025-2033. Key market segments including whey protein concentrate, isolate, and hydrolysate are analyzed across various applications and key MEA countries. The report includes detailed analysis of market size, growth drivers, challenges, opportunities, and competitive dynamics, incorporating data from prominent players such as Arla Foods Ingredients, FrieslandCampina, and Abbott Laboratories, among others.
MEA Whey Protein Ingredients Industry Market Concentration & Innovation
The MEA whey protein ingredients market exhibits a moderately concentrated structure, with a few large multinational players and several regional players holding significant market share. The exact market share for each player is estimated to be xx% in 2025. The industry is characterized by ongoing innovation in product development, focusing on enhanced functionalities, improved bioavailability, and specialized formulations catering to specific consumer needs. Regulatory frameworks, while varying across MEA countries, are generally supportive of the food and beverage sector, though consistency and harmonization across the region could further enhance market growth. Key innovation drivers include increasing consumer demand for health and wellness products, advancements in processing technologies, and the emergence of novel applications in functional foods and dietary supplements. The industry has witnessed significant M&A activity in recent years, with deal values ranging from xx Million to xx Million. These mergers and acquisitions have primarily focused on expanding production capacity, accessing new markets, and strengthening product portfolios. Examples include FrieslandCampina's acquisition of a stake in an Egyptian whey protein production facility. The emergence of substitute proteins presents a challenge, though whey protein's nutritional profile and established market position maintain its dominance. End-user trends indicate a growing preference for convenient, high-quality, and natural protein sources, driving innovation in product formats and delivery systems.
- Market Concentration: Moderately concentrated
- M&A Activity: Significant, with deal values ranging from xx Million to xx Million
- Innovation Drivers: Consumer demand, technological advancements, new applications
- Regulatory Landscape: Supportive, with potential for further harmonization.
MEA Whey Protein Ingredients Industry Industry Trends & Insights
The MEA whey protein ingredients market is experiencing robust growth, driven by increasing health consciousness, rising disposable incomes, and the expanding sports nutrition sector. The market is projected to register a CAGR of xx% during the forecast period (2025-2033). Technological disruptions, including advancements in whey protein processing and formulation, are enhancing product quality, functionality, and shelf life. This includes the increasing use of technologies like microfiltration and ultrafiltration for improved protein purity and yield. Consumer preferences are shifting towards clean-label, organic, and sustainable products, which are placing pressure on manufacturers to adopt more sustainable practices. Competitive dynamics are intensifying, with both established players and new entrants vying for market share through product differentiation, strategic partnerships, and marketing initiatives. Market penetration of whey protein in various applications like infant formula and functional foods is rapidly increasing, while the sports nutrition segment remains a key driver of growth.
Dominant Markets & Segments in MEA Whey Protein Ingredients Industry
The UAE and Saudi Arabia are currently the leading markets for whey protein ingredients in the MEA region, driven by factors such as high disposable incomes, a growing health-conscious population, and a robust food and beverage industry.
By Product Type:
- Whey Protein Concentrate: Holds the largest market share due to its cost-effectiveness.
- Whey Protein Isolate: Experiencing high growth due to its higher protein content and purity.
- Hydrolyzed Whey Protein: Demonstrates significant growth potential, driven by its enhanced digestibility and absorption.
By Application:
- Sports and Performance Nutrition: Remains the dominant application segment.
- Infant Formula: Growing rapidly, fueled by increasing awareness of the nutritional benefits of whey protein.
- Functional/Fortified Food: Shows considerable growth potential, with manufacturers incorporating whey protein into various food products to enhance nutritional value.
By Country:
- UAE & Saudi Arabia: Dominant markets due to high disposable incomes and health-conscious population.
- South Africa: Displays strong growth potential due to its expanding food and beverage industry.
- Kuwait: Shows steady growth, driven by increasing demand for health and wellness products.
Key Drivers: Strong economic growth in several MEA countries, increasing urbanization, rising health awareness, and government initiatives promoting healthy lifestyles are key drivers.
MEA Whey Protein Ingredients Industry Product Developments
Recent product innovations focus on enhancing the functional properties of whey protein, including improved solubility, emulsification, and foaming capabilities. The use of advanced processing technologies allows for the creation of whey protein ingredients tailored to specific applications. New products incorporate added functionalities such as prebiotics, probiotics, or other beneficial ingredients to enhance overall health benefits. Manufacturers are emphasizing the sustainability of their production processes and sourcing practices to meet the growing demand for environmentally responsible products.
Report Scope & Segmentation Analysis
This report segments the MEA whey protein ingredients market by product type (whey protein concentrate, isolate, hydrolysate), application (sports nutrition, infant formula, functional foods, others), and country (South Africa, Saudi Arabia, UAE, Kuwait, Rest of MEA). Each segment's growth projections are detailed, considering the specific market dynamics and competitive landscapes within each region and application. The report estimates that the total market size will reach xx Million by 2033, with whey protein concentrate accounting for the largest share. Competitive dynamics vary across segments, with some dominated by a few key players while others display greater fragmentation.
Key Drivers of MEA Whey Protein Ingredients Industry Growth
Several factors drive the growth of the MEA whey protein ingredients industry: the rising awareness of the health benefits of protein-rich diets, increasing disposable incomes among consumers, and the booming sports and fitness industries. Favorable government regulations and supportive economic policies contribute to the overall positive outlook. The expanding food and beverage sector provides significant opportunities for whey protein incorporation into various products, including functional foods and infant formulas. Technological advancements in whey protein processing enhance product quality and functionality, further fueling market growth.
Challenges in the MEA Whey Protein Ingredients Industry Sector
The industry faces challenges such as fluctuating raw material prices, potential supply chain disruptions, and increasing competition. Stringent regulatory requirements in some MEA countries can increase production costs. The rising prevalence of substitute proteins also presents a challenge for maintaining market share. These factors can influence pricing and profitability and need careful management.
Emerging Opportunities in MEA Whey Protein Ingredients Industry
Emerging opportunities include the growing demand for clean-label and organic whey protein ingredients, the expansion of the functional food sector, and the increasing popularity of plant-based protein blends incorporating whey. The exploration of new applications in areas like nutraceuticals and personalized nutrition presents substantial growth potential. Furthermore, expanding into untapped markets within the MEA region presents opportunities for growth.
Leading Players in the MEA Whey Protein Ingredients Industry Market
- Arla Foods Ingredients
- FrieslandCampina
- Abbott Laboratories
- Lactalis Ingredients
- The Agropur Dairy Cooperative
- Erie Foods International Inc
- Fonterra Co-operative Group Limited
- Carbery Group
- Glanbia Nutritionals
- Ingredients Solutions Inc.
Key Developments in MEA Whey Protein Ingredients Industry Industry
- 2021: Arla Foods Ingredients expands its whey protein production capacity in Saudi Arabia. This expansion significantly increased the supply of whey protein in the region and enhanced the company's market position.
- 2022: FrieslandCampina acquires a minority stake in a whey protein concentrate and isolate manufacturing plant in Egypt. This acquisition granted FrieslandCampina access to a new production facility and broadened its reach in the MEA market.
- 2023: Lactalis Ingredients invests in a new whey protein production line in South Africa. This investment aimed to meet increasing demand for whey protein in the region, reflecting the growth of the market in South Africa.
Strategic Outlook for MEA Whey Protein Ingredients Industry Market
The MEA whey protein ingredients market is poised for continued growth, driven by strong underlying trends like rising health consciousness and economic expansion. Companies that focus on innovation, sustainable production, and strategic partnerships will be well-positioned to capitalize on the emerging opportunities. The demand for high-quality, functional, and sustainably produced whey protein ingredients is expected to increase, presenting significant growth prospects for the industry.
MEA Whey Protein Ingredients Industry Segmentation
-
1. Product Type
- 1.1. Whey Protein Concentrate
- 1.2. Whey Protein Isolate
- 1.3. Hydrolyzed Whey Protein
-
2. Application
- 2.1. Sports and Performance Nutrition
- 2.2. Infant Formula
- 2.3. Functional/Fortified Food
- 2.4. Other Applications
MEA Whey Protein Ingredients Industry Segmentation By Geography
-
1. North America
- 1.1. United States
- 1.2. Canada
- 1.3. Mexico
-
2. South America
- 2.1. Brazil
- 2.2. Argentina
- 2.3. Rest of South America
-
3. Europe
- 3.1. United Kingdom
- 3.2. Germany
- 3.3. France
- 3.4. Italy
- 3.5. Spain
- 3.6. Russia
- 3.7. Benelux
- 3.8. Nordics
- 3.9. Rest of Europe
-
4. Middle East & Africa
- 4.1. Turkey
- 4.2. Israel
- 4.3. GCC
- 4.4. North Africa
- 4.5. South Africa
- 4.6. Rest of Middle East & Africa
-
5. Asia Pacific
- 5.1. China
- 5.2. India
- 5.3. Japan
- 5.4. South Korea
- 5.5. ASEAN
- 5.6. Oceania
- 5.7. Rest of Asia Pacific
MEA Whey Protein Ingredients Industry REPORT HIGHLIGHTS
| Aspects | Details |
|---|---|
| Study Period | 2019-2033 |
| Base Year | 2024 |
| Estimated Year | 2025 |
| Forecast Period | 2025-2033 |
| Historical Period | 2019-2024 |
| Growth Rate | CAGR of 5.75% from 2019-2033 |
| Segmentation |
|
Table of Contents
- 1. Introduction
- 1.1. Research Scope
- 1.2. Market Segmentation
- 1.3. Research Methodology
- 1.4. Definitions and Assumptions
- 2. Executive Summary
- 2.1. Introduction
- 3. Market Dynamics
- 3.1. Introduction
- 3.2. Market Drivers
- 3.2.1. Increasing demand for sports nutritional supplements
- 3.3. Market Restrains
- 3.3.1. Rising demand for plant-based protein
- 3.4. Market Trends
- 3.4.1. Increasing Health and Fitness Club Memberships In The Region
- 4. Market Factor Analysis
- 4.1. Porters Five Forces
- 4.2. Supply/Value Chain
- 4.3. PESTEL analysis
- 4.4. Market Entropy
- 4.5. Patent/Trademark Analysis
- 5. Global MEA Whey Protein Ingredients Industry Analysis, Insights and Forecast, 2019-2031
- 5.1. Market Analysis, Insights and Forecast - by Product Type
- 5.1.1. Whey Protein Concentrate
- 5.1.2. Whey Protein Isolate
- 5.1.3. Hydrolyzed Whey Protein
- 5.2. Market Analysis, Insights and Forecast - by Application
- 5.2.1. Sports and Performance Nutrition
- 5.2.2. Infant Formula
- 5.2.3. Functional/Fortified Food
- 5.2.4. Other Applications
- 5.3. Market Analysis, Insights and Forecast - by Region
- 5.3.1. North America
- 5.3.2. South America
- 5.3.3. Europe
- 5.3.4. Middle East & Africa
- 5.3.5. Asia Pacific
- 5.1. Market Analysis, Insights and Forecast - by Product Type
- 6. North America MEA Whey Protein Ingredients Industry Analysis, Insights and Forecast, 2019-2031
- 6.1. Market Analysis, Insights and Forecast - by Product Type
- 6.1.1. Whey Protein Concentrate
- 6.1.2. Whey Protein Isolate
- 6.1.3. Hydrolyzed Whey Protein
- 6.2. Market Analysis, Insights and Forecast - by Application
- 6.2.1. Sports and Performance Nutrition
- 6.2.2. Infant Formula
- 6.2.3. Functional/Fortified Food
- 6.2.4. Other Applications
- 6.1. Market Analysis, Insights and Forecast - by Product Type
- 7. South America MEA Whey Protein Ingredients Industry Analysis, Insights and Forecast, 2019-2031
- 7.1. Market Analysis, Insights and Forecast - by Product Type
- 7.1.1. Whey Protein Concentrate
- 7.1.2. Whey Protein Isolate
- 7.1.3. Hydrolyzed Whey Protein
- 7.2. Market Analysis, Insights and Forecast - by Application
- 7.2.1. Sports and Performance Nutrition
- 7.2.2. Infant Formula
- 7.2.3. Functional/Fortified Food
- 7.2.4. Other Applications
- 7.1. Market Analysis, Insights and Forecast - by Product Type
- 8. Europe MEA Whey Protein Ingredients Industry Analysis, Insights and Forecast, 2019-2031
- 8.1. Market Analysis, Insights and Forecast - by Product Type
- 8.1.1. Whey Protein Concentrate
- 8.1.2. Whey Protein Isolate
- 8.1.3. Hydrolyzed Whey Protein
- 8.2. Market Analysis, Insights and Forecast - by Application
- 8.2.1. Sports and Performance Nutrition
- 8.2.2. Infant Formula
- 8.2.3. Functional/Fortified Food
- 8.2.4. Other Applications
- 8.1. Market Analysis, Insights and Forecast - by Product Type
- 9. Middle East & Africa MEA Whey Protein Ingredients Industry Analysis, Insights and Forecast, 2019-2031
- 9.1. Market Analysis, Insights and Forecast - by Product Type
- 9.1.1. Whey Protein Concentrate
- 9.1.2. Whey Protein Isolate
- 9.1.3. Hydrolyzed Whey Protein
- 9.2. Market Analysis, Insights and Forecast - by Application
- 9.2.1. Sports and Performance Nutrition
- 9.2.2. Infant Formula
- 9.2.3. Functional/Fortified Food
- 9.2.4. Other Applications
- 9.1. Market Analysis, Insights and Forecast - by Product Type
- 10. Asia Pacific MEA Whey Protein Ingredients Industry Analysis, Insights and Forecast, 2019-2031
- 10.1. Market Analysis, Insights and Forecast - by Product Type
- 10.1.1. Whey Protein Concentrate
- 10.1.2. Whey Protein Isolate
- 10.1.3. Hydrolyzed Whey Protein
- 10.2. Market Analysis, Insights and Forecast - by Application
- 10.2.1. Sports and Performance Nutrition
- 10.2.2. Infant Formula
- 10.2.3. Functional/Fortified Food
- 10.2.4. Other Applications
- 10.1. Market Analysis, Insights and Forecast - by Product Type
- 11. Brazil MEA Whey Protein Ingredients Industry Analysis, Insights and Forecast, 2019-2031
- 11.1. Market Analysis, Insights and Forecast - By Country/Sub-region
- 11.1.1.
- 12. Argentina MEA Whey Protein Ingredients Industry Analysis, Insights and Forecast, 2019-2031
- 12.1. Market Analysis, Insights and Forecast - By Country/Sub-region
- 12.1.1.
- 13. Rest of South America MEA Whey Protein Ingredients Industry Analysis, Insights and Forecast, 2019-2031
- 13.1. Market Analysis, Insights and Forecast - By Country/Sub-region
- 13.1.1.
- 14. Competitive Analysis
- 14.1. Global Market Share Analysis 2024
- 14.2. Company Profiles
- 14.2.1 Arla Foods Ingredients
- 14.2.1.1. Overview
- 14.2.1.2. Products
- 14.2.1.3. SWOT Analysis
- 14.2.1.4. Recent Developments
- 14.2.1.5. Financials (Based on Availability)
- 14.2.2 Frieslandcampina
- 14.2.2.1. Overview
- 14.2.2.2. Products
- 14.2.2.3. SWOT Analysis
- 14.2.2.4. Recent Developments
- 14.2.2.5. Financials (Based on Availability)
- 14.2.3 Abbott Laboratories*List Not Exhaustive
- 14.2.3.1. Overview
- 14.2.3.2. Products
- 14.2.3.3. SWOT Analysis
- 14.2.3.4. Recent Developments
- 14.2.3.5. Financials (Based on Availability)
- 14.2.4 Lactalis Ingredients
- 14.2.4.1. Overview
- 14.2.4.2. Products
- 14.2.4.3. SWOT Analysis
- 14.2.4.4. Recent Developments
- 14.2.4.5. Financials (Based on Availability)
- 14.2.5 The Agropur Dairy Cooperative
- 14.2.5.1. Overview
- 14.2.5.2. Products
- 14.2.5.3. SWOT Analysis
- 14.2.5.4. Recent Developments
- 14.2.5.5. Financials (Based on Availability)
- 14.2.6 Erie Foods International Inc
- 14.2.6.1. Overview
- 14.2.6.2. Products
- 14.2.6.3. SWOT Analysis
- 14.2.6.4. Recent Developments
- 14.2.6.5. Financials (Based on Availability)
- 14.2.7 Fonterra Co-operative Group Limited
- 14.2.7.1. Overview
- 14.2.7.2. Products
- 14.2.7.3. SWOT Analysis
- 14.2.7.4. Recent Developments
- 14.2.7.5. Financials (Based on Availability)
- 14.2.8 Carbery Group
- 14.2.8.1. Overview
- 14.2.8.2. Products
- 14.2.8.3. SWOT Analysis
- 14.2.8.4. Recent Developments
- 14.2.8.5. Financials (Based on Availability)
- 14.2.9 Glanbia Nutritionals
- 14.2.9.1. Overview
- 14.2.9.2. Products
- 14.2.9.3. SWOT Analysis
- 14.2.9.4. Recent Developments
- 14.2.9.5. Financials (Based on Availability)
- 14.2.10 Ingredients Solutions Inc.
- 14.2.10.1. Overview
- 14.2.10.2. Products
- 14.2.10.3. SWOT Analysis
- 14.2.10.4. Recent Developments
- 14.2.10.5. Financials (Based on Availability)
- 14.2.1 Arla Foods Ingredients
List of Figures
- Figure 1: Global MEA Whey Protein Ingredients Industry Revenue Breakdown (Million, %) by Region 2024 & 2032
- Figure 2: Global MEA Whey Protein Ingredients Industry Volume Breakdown (K Tons, %) by Region 2024 & 2032
- Figure 3: Brazil MEA Whey Protein Ingredients Industry Revenue (Million), by Country 2024 & 2032
- Figure 4: Brazil MEA Whey Protein Ingredients Industry Volume (K Tons), by Country 2024 & 2032
- Figure 5: Brazil MEA Whey Protein Ingredients Industry Revenue Share (%), by Country 2024 & 2032
- Figure 6: Brazil MEA Whey Protein Ingredients Industry Volume Share (%), by Country 2024 & 2032
- Figure 7: Argentina MEA Whey Protein Ingredients Industry Revenue (Million), by Country 2024 & 2032
- Figure 8: Argentina MEA Whey Protein Ingredients Industry Volume (K Tons), by Country 2024 & 2032
- Figure 9: Argentina MEA Whey Protein Ingredients Industry Revenue Share (%), by Country 2024 & 2032
- Figure 10: Argentina MEA Whey Protein Ingredients Industry Volume Share (%), by Country 2024 & 2032
- Figure 11: Rest of South America MEA Whey Protein Ingredients Industry Revenue (Million), by Country 2024 & 2032
- Figure 12: Rest of South America MEA Whey Protein Ingredients Industry Volume (K Tons), by Country 2024 & 2032
- Figure 13: Rest of South America MEA Whey Protein Ingredients Industry Revenue Share (%), by Country 2024 & 2032
- Figure 14: Rest of South America MEA Whey Protein Ingredients Industry Volume Share (%), by Country 2024 & 2032
- Figure 15: North America MEA Whey Protein Ingredients Industry Revenue (Million), by Product Type 2024 & 2032
- Figure 16: North America MEA Whey Protein Ingredients Industry Volume (K Tons), by Product Type 2024 & 2032
- Figure 17: North America MEA Whey Protein Ingredients Industry Revenue Share (%), by Product Type 2024 & 2032
- Figure 18: North America MEA Whey Protein Ingredients Industry Volume Share (%), by Product Type 2024 & 2032
- Figure 19: North America MEA Whey Protein Ingredients Industry Revenue (Million), by Application 2024 & 2032
- Figure 20: North America MEA Whey Protein Ingredients Industry Volume (K Tons), by Application 2024 & 2032
- Figure 21: North America MEA Whey Protein Ingredients Industry Revenue Share (%), by Application 2024 & 2032
- Figure 22: North America MEA Whey Protein Ingredients Industry Volume Share (%), by Application 2024 & 2032
- Figure 23: North America MEA Whey Protein Ingredients Industry Revenue (Million), by Country 2024 & 2032
- Figure 24: North America MEA Whey Protein Ingredients Industry Volume (K Tons), by Country 2024 & 2032
- Figure 25: North America MEA Whey Protein Ingredients Industry Revenue Share (%), by Country 2024 & 2032
- Figure 26: North America MEA Whey Protein Ingredients Industry Volume Share (%), by Country 2024 & 2032
- Figure 27: South America MEA Whey Protein Ingredients Industry Revenue (Million), by Product Type 2024 & 2032
- Figure 28: South America MEA Whey Protein Ingredients Industry Volume (K Tons), by Product Type 2024 & 2032
- Figure 29: South America MEA Whey Protein Ingredients Industry Revenue Share (%), by Product Type 2024 & 2032
- Figure 30: South America MEA Whey Protein Ingredients Industry Volume Share (%), by Product Type 2024 & 2032
- Figure 31: South America MEA Whey Protein Ingredients Industry Revenue (Million), by Application 2024 & 2032
- Figure 32: South America MEA Whey Protein Ingredients Industry Volume (K Tons), by Application 2024 & 2032
- Figure 33: South America MEA Whey Protein Ingredients Industry Revenue Share (%), by Application 2024 & 2032
- Figure 34: South America MEA Whey Protein Ingredients Industry Volume Share (%), by Application 2024 & 2032
- Figure 35: South America MEA Whey Protein Ingredients Industry Revenue (Million), by Country 2024 & 2032
- Figure 36: South America MEA Whey Protein Ingredients Industry Volume (K Tons), by Country 2024 & 2032
- Figure 37: South America MEA Whey Protein Ingredients Industry Revenue Share (%), by Country 2024 & 2032
- Figure 38: South America MEA Whey Protein Ingredients Industry Volume Share (%), by Country 2024 & 2032
- Figure 39: Europe MEA Whey Protein Ingredients Industry Revenue (Million), by Product Type 2024 & 2032
- Figure 40: Europe MEA Whey Protein Ingredients Industry Volume (K Tons), by Product Type 2024 & 2032
- Figure 41: Europe MEA Whey Protein Ingredients Industry Revenue Share (%), by Product Type 2024 & 2032
- Figure 42: Europe MEA Whey Protein Ingredients Industry Volume Share (%), by Product Type 2024 & 2032
- Figure 43: Europe MEA Whey Protein Ingredients Industry Revenue (Million), by Application 2024 & 2032
- Figure 44: Europe MEA Whey Protein Ingredients Industry Volume (K Tons), by Application 2024 & 2032
- Figure 45: Europe MEA Whey Protein Ingredients Industry Revenue Share (%), by Application 2024 & 2032
- Figure 46: Europe MEA Whey Protein Ingredients Industry Volume Share (%), by Application 2024 & 2032
- Figure 47: Europe MEA Whey Protein Ingredients Industry Revenue (Million), by Country 2024 & 2032
- Figure 48: Europe MEA Whey Protein Ingredients Industry Volume (K Tons), by Country 2024 & 2032
- Figure 49: Europe MEA Whey Protein Ingredients Industry Revenue Share (%), by Country 2024 & 2032
- Figure 50: Europe MEA Whey Protein Ingredients Industry Volume Share (%), by Country 2024 & 2032
- Figure 51: Middle East & Africa MEA Whey Protein Ingredients Industry Revenue (Million), by Product Type 2024 & 2032
- Figure 52: Middle East & Africa MEA Whey Protein Ingredients Industry Volume (K Tons), by Product Type 2024 & 2032
- Figure 53: Middle East & Africa MEA Whey Protein Ingredients Industry Revenue Share (%), by Product Type 2024 & 2032
- Figure 54: Middle East & Africa MEA Whey Protein Ingredients Industry Volume Share (%), by Product Type 2024 & 2032
- Figure 55: Middle East & Africa MEA Whey Protein Ingredients Industry Revenue (Million), by Application 2024 & 2032
- Figure 56: Middle East & Africa MEA Whey Protein Ingredients Industry Volume (K Tons), by Application 2024 & 2032
- Figure 57: Middle East & Africa MEA Whey Protein Ingredients Industry Revenue Share (%), by Application 2024 & 2032
- Figure 58: Middle East & Africa MEA Whey Protein Ingredients Industry Volume Share (%), by Application 2024 & 2032
- Figure 59: Middle East & Africa MEA Whey Protein Ingredients Industry Revenue (Million), by Country 2024 & 2032
- Figure 60: Middle East & Africa MEA Whey Protein Ingredients Industry Volume (K Tons), by Country 2024 & 2032
- Figure 61: Middle East & Africa MEA Whey Protein Ingredients Industry Revenue Share (%), by Country 2024 & 2032
- Figure 62: Middle East & Africa MEA Whey Protein Ingredients Industry Volume Share (%), by Country 2024 & 2032
- Figure 63: Asia Pacific MEA Whey Protein Ingredients Industry Revenue (Million), by Product Type 2024 & 2032
- Figure 64: Asia Pacific MEA Whey Protein Ingredients Industry Volume (K Tons), by Product Type 2024 & 2032
- Figure 65: Asia Pacific MEA Whey Protein Ingredients Industry Revenue Share (%), by Product Type 2024 & 2032
- Figure 66: Asia Pacific MEA Whey Protein Ingredients Industry Volume Share (%), by Product Type 2024 & 2032
- Figure 67: Asia Pacific MEA Whey Protein Ingredients Industry Revenue (Million), by Application 2024 & 2032
- Figure 68: Asia Pacific MEA Whey Protein Ingredients Industry Volume (K Tons), by Application 2024 & 2032
- Figure 69: Asia Pacific MEA Whey Protein Ingredients Industry Revenue Share (%), by Application 2024 & 2032
- Figure 70: Asia Pacific MEA Whey Protein Ingredients Industry Volume Share (%), by Application 2024 & 2032
- Figure 71: Asia Pacific MEA Whey Protein Ingredients Industry Revenue (Million), by Country 2024 & 2032
- Figure 72: Asia Pacific MEA Whey Protein Ingredients Industry Volume (K Tons), by Country 2024 & 2032
- Figure 73: Asia Pacific MEA Whey Protein Ingredients Industry Revenue Share (%), by Country 2024 & 2032
- Figure 74: Asia Pacific MEA Whey Protein Ingredients Industry Volume Share (%), by Country 2024 & 2032
List of Tables
- Table 1: Global MEA Whey Protein Ingredients Industry Revenue Million Forecast, by Region 2019 & 2032
- Table 2: Global MEA Whey Protein Ingredients Industry Volume K Tons Forecast, by Region 2019 & 2032
- Table 3: Global MEA Whey Protein Ingredients Industry Revenue Million Forecast, by Product Type 2019 & 2032
- Table 4: Global MEA Whey Protein Ingredients Industry Volume K Tons Forecast, by Product Type 2019 & 2032
- Table 5: Global MEA Whey Protein Ingredients Industry Revenue Million Forecast, by Application 2019 & 2032
- Table 6: Global MEA Whey Protein Ingredients Industry Volume K Tons Forecast, by Application 2019 & 2032
- Table 7: Global MEA Whey Protein Ingredients Industry Revenue Million Forecast, by Region 2019 & 2032
- Table 8: Global MEA Whey Protein Ingredients Industry Volume K Tons Forecast, by Region 2019 & 2032
- Table 9: Global MEA Whey Protein Ingredients Industry Revenue Million Forecast, by Country 2019 & 2032
- Table 10: Global MEA Whey Protein Ingredients Industry Volume K Tons Forecast, by Country 2019 & 2032
- Table 11: MEA Whey Protein Ingredients Industry Revenue (Million) Forecast, by Application 2019 & 2032
- Table 12: MEA Whey Protein Ingredients Industry Volume (K Tons) Forecast, by Application 2019 & 2032
- Table 13: Global MEA Whey Protein Ingredients Industry Revenue Million Forecast, by Country 2019 & 2032
- Table 14: Global MEA Whey Protein Ingredients Industry Volume K Tons Forecast, by Country 2019 & 2032
- Table 15: MEA Whey Protein Ingredients Industry Revenue (Million) Forecast, by Application 2019 & 2032
- Table 16: MEA Whey Protein Ingredients Industry Volume (K Tons) Forecast, by Application 2019 & 2032
- Table 17: Global MEA Whey Protein Ingredients Industry Revenue Million Forecast, by Country 2019 & 2032
- Table 18: Global MEA Whey Protein Ingredients Industry Volume K Tons Forecast, by Country 2019 & 2032
- Table 19: MEA Whey Protein Ingredients Industry Revenue (Million) Forecast, by Application 2019 & 2032
- Table 20: MEA Whey Protein Ingredients Industry Volume (K Tons) Forecast, by Application 2019 & 2032
- Table 21: Global MEA Whey Protein Ingredients Industry Revenue Million Forecast, by Product Type 2019 & 2032
- Table 22: Global MEA Whey Protein Ingredients Industry Volume K Tons Forecast, by Product Type 2019 & 2032
- Table 23: Global MEA Whey Protein Ingredients Industry Revenue Million Forecast, by Application 2019 & 2032
- Table 24: Global MEA Whey Protein Ingredients Industry Volume K Tons Forecast, by Application 2019 & 2032
- Table 25: Global MEA Whey Protein Ingredients Industry Revenue Million Forecast, by Country 2019 & 2032
- Table 26: Global MEA Whey Protein Ingredients Industry Volume K Tons Forecast, by Country 2019 & 2032
- Table 27: United States MEA Whey Protein Ingredients Industry Revenue (Million) Forecast, by Application 2019 & 2032
- Table 28: United States MEA Whey Protein Ingredients Industry Volume (K Tons) Forecast, by Application 2019 & 2032
- Table 29: Canada MEA Whey Protein Ingredients Industry Revenue (Million) Forecast, by Application 2019 & 2032
- Table 30: Canada MEA Whey Protein Ingredients Industry Volume (K Tons) Forecast, by Application 2019 & 2032
- Table 31: Mexico MEA Whey Protein Ingredients Industry Revenue (Million) Forecast, by Application 2019 & 2032
- Table 32: Mexico MEA Whey Protein Ingredients Industry Volume (K Tons) Forecast, by Application 2019 & 2032
- Table 33: Global MEA Whey Protein Ingredients Industry Revenue Million Forecast, by Product Type 2019 & 2032
- Table 34: Global MEA Whey Protein Ingredients Industry Volume K Tons Forecast, by Product Type 2019 & 2032
- Table 35: Global MEA Whey Protein Ingredients Industry Revenue Million Forecast, by Application 2019 & 2032
- Table 36: Global MEA Whey Protein Ingredients Industry Volume K Tons Forecast, by Application 2019 & 2032
- Table 37: Global MEA Whey Protein Ingredients Industry Revenue Million Forecast, by Country 2019 & 2032
- Table 38: Global MEA Whey Protein Ingredients Industry Volume K Tons Forecast, by Country 2019 & 2032
- Table 39: Brazil MEA Whey Protein Ingredients Industry Revenue (Million) Forecast, by Application 2019 & 2032
- Table 40: Brazil MEA Whey Protein Ingredients Industry Volume (K Tons) Forecast, by Application 2019 & 2032
- Table 41: Argentina MEA Whey Protein Ingredients Industry Revenue (Million) Forecast, by Application 2019 & 2032
- Table 42: Argentina MEA Whey Protein Ingredients Industry Volume (K Tons) Forecast, by Application 2019 & 2032
- Table 43: Rest of South America MEA Whey Protein Ingredients Industry Revenue (Million) Forecast, by Application 2019 & 2032
- Table 44: Rest of South America MEA Whey Protein Ingredients Industry Volume (K Tons) Forecast, by Application 2019 & 2032
- Table 45: Global MEA Whey Protein Ingredients Industry Revenue Million Forecast, by Product Type 2019 & 2032
- Table 46: Global MEA Whey Protein Ingredients Industry Volume K Tons Forecast, by Product Type 2019 & 2032
- Table 47: Global MEA Whey Protein Ingredients Industry Revenue Million Forecast, by Application 2019 & 2032
- Table 48: Global MEA Whey Protein Ingredients Industry Volume K Tons Forecast, by Application 2019 & 2032
- Table 49: Global MEA Whey Protein Ingredients Industry Revenue Million Forecast, by Country 2019 & 2032
- Table 50: Global MEA Whey Protein Ingredients Industry Volume K Tons Forecast, by Country 2019 & 2032
- Table 51: United Kingdom MEA Whey Protein Ingredients Industry Revenue (Million) Forecast, by Application 2019 & 2032
- Table 52: United Kingdom MEA Whey Protein Ingredients Industry Volume (K Tons) Forecast, by Application 2019 & 2032
- Table 53: Germany MEA Whey Protein Ingredients Industry Revenue (Million) Forecast, by Application 2019 & 2032
- Table 54: Germany MEA Whey Protein Ingredients Industry Volume (K Tons) Forecast, by Application 2019 & 2032
- Table 55: France MEA Whey Protein Ingredients Industry Revenue (Million) Forecast, by Application 2019 & 2032
- Table 56: France MEA Whey Protein Ingredients Industry Volume (K Tons) Forecast, by Application 2019 & 2032
- Table 57: Italy MEA Whey Protein Ingredients Industry Revenue (Million) Forecast, by Application 2019 & 2032
- Table 58: Italy MEA Whey Protein Ingredients Industry Volume (K Tons) Forecast, by Application 2019 & 2032
- Table 59: Spain MEA Whey Protein Ingredients Industry Revenue (Million) Forecast, by Application 2019 & 2032
- Table 60: Spain MEA Whey Protein Ingredients Industry Volume (K Tons) Forecast, by Application 2019 & 2032
- Table 61: Russia MEA Whey Protein Ingredients Industry Revenue (Million) Forecast, by Application 2019 & 2032
- Table 62: Russia MEA Whey Protein Ingredients Industry Volume (K Tons) Forecast, by Application 2019 & 2032
- Table 63: Benelux MEA Whey Protein Ingredients Industry Revenue (Million) Forecast, by Application 2019 & 2032
- Table 64: Benelux MEA Whey Protein Ingredients Industry Volume (K Tons) Forecast, by Application 2019 & 2032
- Table 65: Nordics MEA Whey Protein Ingredients Industry Revenue (Million) Forecast, by Application 2019 & 2032
- Table 66: Nordics MEA Whey Protein Ingredients Industry Volume (K Tons) Forecast, by Application 2019 & 2032
- Table 67: Rest of Europe MEA Whey Protein Ingredients Industry Revenue (Million) Forecast, by Application 2019 & 2032
- Table 68: Rest of Europe MEA Whey Protein Ingredients Industry Volume (K Tons) Forecast, by Application 2019 & 2032
- Table 69: Global MEA Whey Protein Ingredients Industry Revenue Million Forecast, by Product Type 2019 & 2032
- Table 70: Global MEA Whey Protein Ingredients Industry Volume K Tons Forecast, by Product Type 2019 & 2032
- Table 71: Global MEA Whey Protein Ingredients Industry Revenue Million Forecast, by Application 2019 & 2032
- Table 72: Global MEA Whey Protein Ingredients Industry Volume K Tons Forecast, by Application 2019 & 2032
- Table 73: Global MEA Whey Protein Ingredients Industry Revenue Million Forecast, by Country 2019 & 2032
- Table 74: Global MEA Whey Protein Ingredients Industry Volume K Tons Forecast, by Country 2019 & 2032
- Table 75: Turkey MEA Whey Protein Ingredients Industry Revenue (Million) Forecast, by Application 2019 & 2032
- Table 76: Turkey MEA Whey Protein Ingredients Industry Volume (K Tons) Forecast, by Application 2019 & 2032
- Table 77: Israel MEA Whey Protein Ingredients Industry Revenue (Million) Forecast, by Application 2019 & 2032
- Table 78: Israel MEA Whey Protein Ingredients Industry Volume (K Tons) Forecast, by Application 2019 & 2032
- Table 79: GCC MEA Whey Protein Ingredients Industry Revenue (Million) Forecast, by Application 2019 & 2032
- Table 80: GCC MEA Whey Protein Ingredients Industry Volume (K Tons) Forecast, by Application 2019 & 2032
- Table 81: North Africa MEA Whey Protein Ingredients Industry Revenue (Million) Forecast, by Application 2019 & 2032
- Table 82: North Africa MEA Whey Protein Ingredients Industry Volume (K Tons) Forecast, by Application 2019 & 2032
- Table 83: South Africa MEA Whey Protein Ingredients Industry Revenue (Million) Forecast, by Application 2019 & 2032
- Table 84: South Africa MEA Whey Protein Ingredients Industry Volume (K Tons) Forecast, by Application 2019 & 2032
- Table 85: Rest of Middle East & Africa MEA Whey Protein Ingredients Industry Revenue (Million) Forecast, by Application 2019 & 2032
- Table 86: Rest of Middle East & Africa MEA Whey Protein Ingredients Industry Volume (K Tons) Forecast, by Application 2019 & 2032
- Table 87: Global MEA Whey Protein Ingredients Industry Revenue Million Forecast, by Product Type 2019 & 2032
- Table 88: Global MEA Whey Protein Ingredients Industry Volume K Tons Forecast, by Product Type 2019 & 2032
- Table 89: Global MEA Whey Protein Ingredients Industry Revenue Million Forecast, by Application 2019 & 2032
- Table 90: Global MEA Whey Protein Ingredients Industry Volume K Tons Forecast, by Application 2019 & 2032
- Table 91: Global MEA Whey Protein Ingredients Industry Revenue Million Forecast, by Country 2019 & 2032
- Table 92: Global MEA Whey Protein Ingredients Industry Volume K Tons Forecast, by Country 2019 & 2032
- Table 93: China MEA Whey Protein Ingredients Industry Revenue (Million) Forecast, by Application 2019 & 2032
- Table 94: China MEA Whey Protein Ingredients Industry Volume (K Tons) Forecast, by Application 2019 & 2032
- Table 95: India MEA Whey Protein Ingredients Industry Revenue (Million) Forecast, by Application 2019 & 2032
- Table 96: India MEA Whey Protein Ingredients Industry Volume (K Tons) Forecast, by Application 2019 & 2032
- Table 97: Japan MEA Whey Protein Ingredients Industry Revenue (Million) Forecast, by Application 2019 & 2032
- Table 98: Japan MEA Whey Protein Ingredients Industry Volume (K Tons) Forecast, by Application 2019 & 2032
- Table 99: South Korea MEA Whey Protein Ingredients Industry Revenue (Million) Forecast, by Application 2019 & 2032
- Table 100: South Korea MEA Whey Protein Ingredients Industry Volume (K Tons) Forecast, by Application 2019 & 2032
- Table 101: ASEAN MEA Whey Protein Ingredients Industry Revenue (Million) Forecast, by Application 2019 & 2032
- Table 102: ASEAN MEA Whey Protein Ingredients Industry Volume (K Tons) Forecast, by Application 2019 & 2032
- Table 103: Oceania MEA Whey Protein Ingredients Industry Revenue (Million) Forecast, by Application 2019 & 2032
- Table 104: Oceania MEA Whey Protein Ingredients Industry Volume (K Tons) Forecast, by Application 2019 & 2032
- Table 105: Rest of Asia Pacific MEA Whey Protein Ingredients Industry Revenue (Million) Forecast, by Application 2019 & 2032
- Table 106: Rest of Asia Pacific MEA Whey Protein Ingredients Industry Volume (K Tons) Forecast, by Application 2019 & 2032
Frequently Asked Questions
1. What is the projected Compound Annual Growth Rate (CAGR) of the MEA Whey Protein Ingredients Industry?
The projected CAGR is approximately 5.75%.
2. Which companies are prominent players in the MEA Whey Protein Ingredients Industry?
Key companies in the market include Arla Foods Ingredients, Frieslandcampina, Abbott Laboratories*List Not Exhaustive, Lactalis Ingredients, The Agropur Dairy Cooperative, Erie Foods International Inc, Fonterra Co-operative Group Limited, Carbery Group, Glanbia Nutritionals, Ingredients Solutions Inc..
3. What are the main segments of the MEA Whey Protein Ingredients Industry?
The market segments include Product Type, Application.
4. Can you provide details about the market size?
The market size is estimated to be USD 500 Million as of 2022.
5. What are some drivers contributing to market growth?
Increasing demand for sports nutritional supplements.
6. What are the notable trends driving market growth?
Increasing Health and Fitness Club Memberships In The Region.
7. Are there any restraints impacting market growth?
Rising demand for plant-based protein.
8. Can you provide examples of recent developments in the market?
2021: Arla Foods Ingredients expands its whey protein production capacity in Saudi Arabia.
9. What pricing options are available for accessing the report?
Pricing options include single-user, multi-user, and enterprise licenses priced at USD 3800, USD 4500, and USD 5800 respectively.
10. Is the market size provided in terms of value or volume?
The market size is provided in terms of value, measured in Million and volume, measured in K Tons.
11. Are there any specific market keywords associated with the report?
Yes, the market keyword associated with the report is "MEA Whey Protein Ingredients Industry," which aids in identifying and referencing the specific market segment covered.
12. How do I determine which pricing option suits my needs best?
The pricing options vary based on user requirements and access needs. Individual users may opt for single-user licenses, while businesses requiring broader access may choose multi-user or enterprise licenses for cost-effective access to the report.
13. Are there any additional resources or data provided in the MEA Whey Protein Ingredients Industry report?
While the report offers comprehensive insights, it's advisable to review the specific contents or supplementary materials provided to ascertain if additional resources or data are available.
14. How can I stay updated on further developments or reports in the MEA Whey Protein Ingredients Industry?
To stay informed about further developments, trends, and reports in the MEA Whey Protein Ingredients Industry, consider subscribing to industry newsletters, following relevant companies and organizations, or regularly checking reputable industry news sources and publications.
Methodology
Step 1 - Identification of Relevant Samples Size from Population Database


Step 2 - Approaches for Defining Global Market Size (Value, Volume* & Price*)

Note*: In applicable scenarios
Step 3 - Data Sources
Primary Research
- Web Analytics
- Survey Reports
- Research Institute
- Latest Research Reports
- Opinion Leaders
Secondary Research
- Annual Reports
- White Paper
- Latest Press Release
- Industry Association
- Paid Database
- Investor Presentations

Step 4 - Data Triangulation
Involves using different sources of information in order to increase the validity of a study
These sources are likely to be stakeholders in a program - participants, other researchers, program staff, other community members, and so on.
Then we put all data in single framework & apply various statistical tools to find out the dynamic on the market.
During the analysis stage, feedback from the stakeholder groups would be compared to determine areas of agreement as well as areas of divergence


