

Key Insights
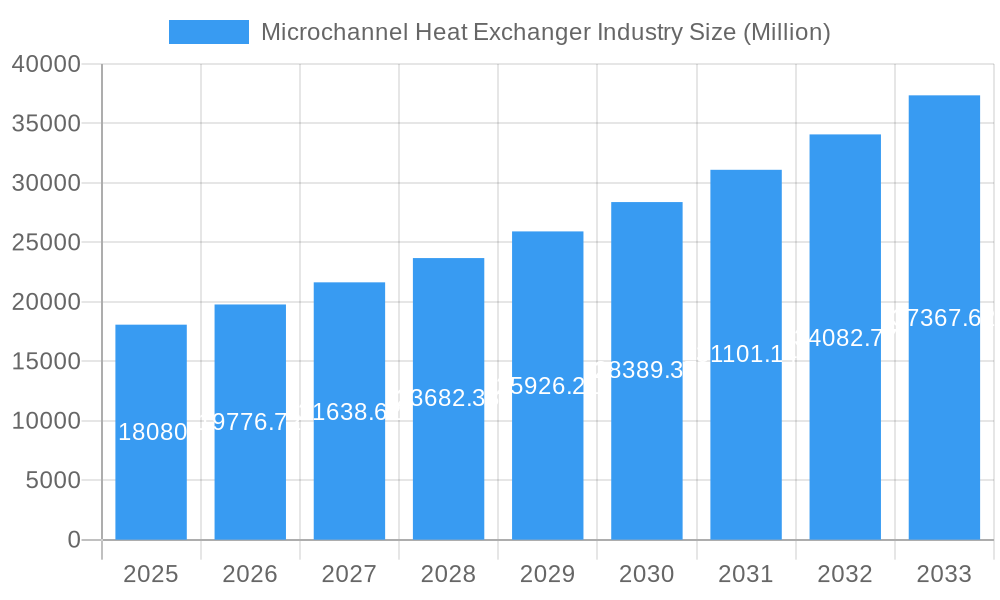
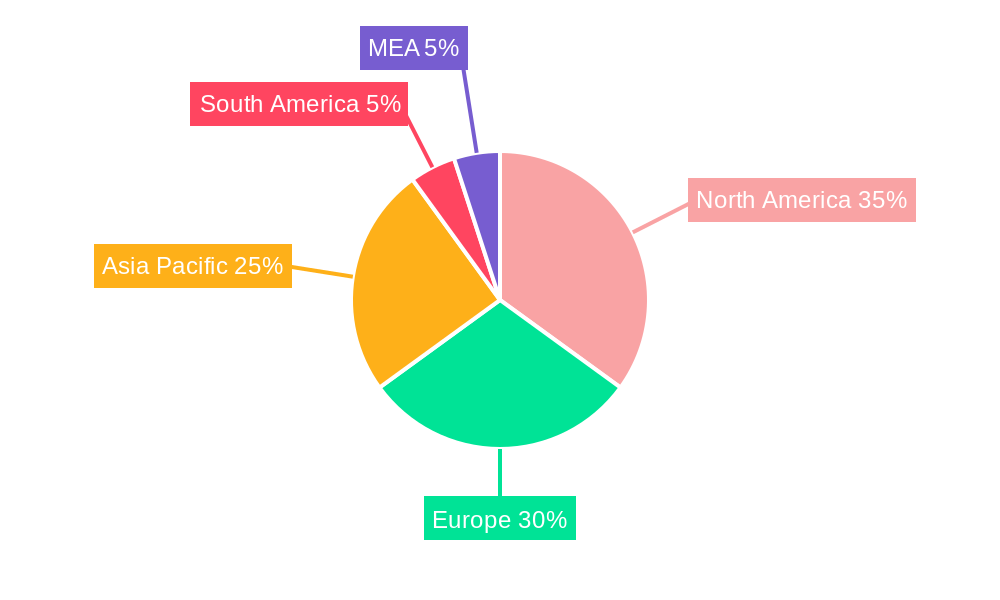
The microchannel heat exchanger (MHX) market is experiencing robust growth, projected to reach a market size of $18.08 billion in 2025 and exhibiting a Compound Annual Growth Rate (CAGR) of 9.34% from 2025 to 2033. This expansion is fueled by several key drivers. The increasing demand for energy efficiency across various sectors, particularly in oil and gas, power generation, and chemical processing, is a primary catalyst. These industries are adopting MHX technology due to its superior heat transfer capabilities compared to traditional heat exchangers, leading to reduced energy consumption and operational costs. Furthermore, advancements in manufacturing techniques and the development of novel materials are contributing to improved performance, durability, and cost-effectiveness of MHX systems. The growing emphasis on reducing carbon emissions and adopting sustainable technologies further bolsters market growth, as MHX contributes to enhanced energy efficiency and reduced environmental impact. Shell and tube construction types currently dominate the market, but plate frame exchangers are gaining traction due to their compact design and ease of maintenance. Geographically, North America and Europe hold significant market share, driven by strong industrial presence and early adoption of advanced technologies; however, the Asia-Pacific region is projected to witness the fastest growth rate, fueled by rapid industrialization and increasing investments in energy-efficient infrastructure.
Microchannel Heat Exchanger Industry Market Size (In Billion)
The competitive landscape is characterized by a mix of established players and emerging companies. Key players like Danfoss AS, Thermax Limited, and Kelvion Holding GmbH are leveraging their technological expertise and extensive market reach to maintain a strong position. However, the market is also witnessing increased competition from smaller companies offering specialized solutions and innovative designs. The forecast period (2025-2033) anticipates continued growth, driven by the factors mentioned above. However, potential restraints, such as the relatively high initial investment cost of MHX compared to conventional systems, and the need for specialized expertise in design and installation, may slightly moderate the market's overall trajectory. Nevertheless, the long-term benefits of enhanced energy efficiency and reduced environmental impact will continue to drive the adoption of microchannel heat exchangers across various industrial applications.
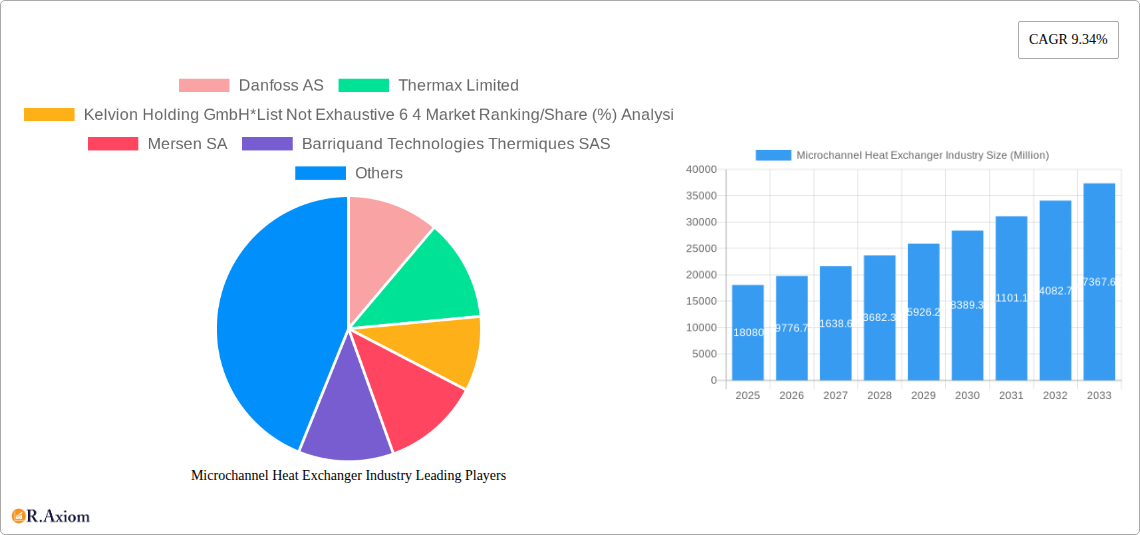
Microchannel Heat Exchanger Industry Company Market Share
Microchannel Heat Exchanger Industry Market Report: 2019-2033
This comprehensive report provides a detailed analysis of the microchannel heat exchanger industry, covering market size, segmentation, growth drivers, challenges, and key players. The study period spans from 2019 to 2033, with 2025 serving as the base and estimated year. The report offers actionable insights for industry stakeholders, investors, and businesses seeking to navigate this dynamic market. The global market value is projected to reach xx Million by 2033.
Microchannel Heat Exchanger Industry Market Concentration & Innovation
The microchannel heat exchanger market exhibits a moderately concentrated structure, with several key players vying for market share. While precise market share data for each company is proprietary and varies across segments, a ranking based on 2024 estimates reveals that the top 10 companies hold approximately 64% of the global market. Companies like Danfoss AS, Alfa Laval AB, SPX Flow Inc., and Kelvion Holding GmbH are significant players, driving innovation and shaping market trends.
Market concentration is influenced by factors such as:
- Research and Development (R&D) Investments: Leading companies consistently invest in R&D to develop advanced microchannel heat exchanger designs with improved efficiency, durability, and compact form factors.
- Mergers and Acquisitions (M&A) Activities: The industry witnesses periodic M&A activity, with larger companies acquiring smaller players to expand their product portfolio and market reach. While the total value of M&A deals in the past five years is not publicly available in full detail, it is estimated to be in the range of xx Million.
- Regulatory Frameworks: Stringent environmental regulations globally push the adoption of energy-efficient technologies, benefiting the microchannel heat exchanger market.
- Product Substitutes: While other heat exchanger types exist, microchannel heat exchangers offer superior efficiency and compactness, limiting the impact of substitutes.
- End-User Trends: Growing demand for energy efficiency in various end-use industries (Oil & Gas, Power Generation, Chemical Processing, etc.) fuels the market growth.
Microchannel Heat Exchanger Industry Industry Trends & Insights
The microchannel heat exchanger industry is experiencing robust growth, driven by increasing energy efficiency demands and technological advancements. The Compound Annual Growth Rate (CAGR) during the historical period (2019-2024) was approximately xx%, and projections for the forecast period (2025-2033) indicate a CAGR of xx%. Market penetration in key sectors is steadily rising as manufacturers offer improved designs and integrate advanced materials.
Key trends shaping the market include:
- Technological Disruptions: Advancements in materials science, manufacturing processes, and simulation technologies are leading to more efficient and cost-effective microchannel heat exchangers.
- Consumer Preferences: End-users increasingly prioritize energy efficiency and reduced operational costs, boosting demand for these high-performance heat exchangers.
- Competitive Dynamics: The market is characterized by intense competition among established players and emerging entrants, driving innovation and price optimization.
Dominant Markets & Segments in Microchannel Heat Exchanger Industry
The global microchannel heat exchanger market is geographically diverse, with significant contributions from various regions. North America and Europe currently hold the largest market shares, driven by robust industrial activity and stringent environmental regulations. However, Asia-Pacific is poised for significant growth due to rapid industrialization and increasing investments in energy infrastructure.
Within the various segments, we observe the following dominance:
- Construction Type: Plate frame heat exchangers are dominating, accounting for the largest market share, owing to their high efficiency, compact size, and relatively low cost.
- End User: The Oil and Gas Industry currently holds the highest market share due to high demand for efficient heat transfer in refineries and processing plants. However, the Power Generation segment shows promising future growth prospects due to the increasing adoption of renewable energy sources, which benefit greatly from efficient heat exchange solutions. Chemical, food and beverage industries also constitute substantial market segments.
Key Drivers:
- North America & Europe: Stringent environmental regulations, high energy costs, and robust industrial infrastructure are major drivers of market dominance.
- Asia-Pacific: Rapid industrialization, increasing energy demands, and government support for renewable energy technologies are driving market growth.
Microchannel Heat Exchanger Industry Product Developments
Recent years have witnessed significant advancements in microchannel heat exchanger technology, focusing on enhancing efficiency, durability, and ease of use. Companies are introducing innovative designs, materials, and manufacturing processes to cater to the specific needs of different end-use applications. For example, the launch of Alfa Laval's AlfaNova GL50 specifically addresses the requirements of fuel cell systems, while SPX FLOW's FastFrame plate heat exchanger improves usability and durability for food and beverage operators. These innovations highlight the industry's commitment to providing optimized solutions for various applications.
Report Scope & Segmentation Analysis
This report segments the microchannel heat exchanger market based on construction type and end-user industries.
Construction Type:
- Shell and Tube: This segment offers robust and reliable performance, particularly in high-pressure applications. Market size is projected to reach xx Million by 2033.
- Plate Frame: This segment's dominance is driven by superior efficiency and compact design, with an expected market size of xx Million by 2033.
- Other Construction Types: This includes various specialized designs catering to niche applications, projected to reach xx Million by 2033.
End User:
- Oil and Gas Industry: This segment currently holds a large share, driven by the demand for efficient heat transfer in refineries and processing plants. Market growth will continue, potentially reaching xx Million by 2033.
- Power Generation: This segment is witnessing significant growth due to the adoption of renewable energy sources and enhanced efficiency requirements in thermal power plants. Projected size by 2033: xx Million.
- Chemical: The chemical industry’s demand for efficient and reliable heat exchange solutions maintains this segment as a substantial market contributor, predicted to reach xx Million by 2033.
- Food and Beverages: This segment is fueled by demand for hygienic and efficient heat exchangers for pasteurization and other processes. Projected size by 2033: xx Million.
- Other End Users: This segment encompasses various industries like HVAC, pharmaceuticals, etc., projected to reach xx Million by 2033.
Key Drivers of Microchannel Heat Exchanger Industry Growth
Several factors drive the growth of the microchannel heat exchanger industry:
- Increasing Demand for Energy Efficiency: Global efforts to reduce carbon emissions and improve energy efficiency are boosting demand for high-performance heat exchangers.
- Technological Advancements: Innovations in materials and manufacturing processes are leading to improved performance, durability, and cost-effectiveness.
- Government Regulations and Incentives: Supportive policies and incentives for energy-efficient technologies are driving market adoption. For example, incentives in many European Union countries directly influence the market.
Challenges in the Microchannel Heat Exchanger Industry Sector
The microchannel heat exchanger industry faces several challenges:
- High Initial Investment Costs: The high initial investment costs can hinder adoption, especially for smaller companies or developing economies.
- Supply Chain Disruptions: Global supply chain disruptions can impact the availability of raw materials and components.
- Intense Competition: The industry is highly competitive, with numerous players vying for market share.
Emerging Opportunities in Microchannel Heat Exchanger Industry
The microchannel heat exchanger industry presents exciting opportunities:
- Expansion into New Markets: Emerging economies offer significant growth potential as industrialization and infrastructure development accelerate.
- Development of Novel Applications: Emerging applications in sectors like renewable energy, electric vehicles, and data centers present growth prospects.
- Integration of Smart Technologies: Integration of smart technologies like sensors and IoT for predictive maintenance offers increased efficiency and reduced downtime.
Leading Players in the Microchannel Heat Exchanger Industry Market
- Danfoss AS
- Thermax Limited
- Kelvion Holding GmbH
- Mersen SA
- Barriquand Technologies Thermiques SAS
- SPX Flow Inc
- General Electric Company
- Hisaka Works Ltd
- Alfa Laval AB
Key Developments in Microchannel Heat Exchanger Industry Industry
- September 2023: APV (SPX FLOW) launched the FastFrame plate heat exchanger, enhancing usability and durability for food and beverage applications. This improved product is expected to significantly impact the market share in the food processing sector.
- April 2023: Researchers in India developed a PV-powered earth-to-air heat exchanger, demonstrating the potential for integrating renewable energy with space heating and cooling systems. This development could significantly impact the adoption of microchannel heat exchangers in the building sector.
- March 2023: Alfa Laval introduced the AlfaNova GL50, the first heat exchanger designed explicitly for fuel cell systems. This launch signifies the expansion of microchannel heat exchanger applications into the burgeoning fuel cell technology market.
Strategic Outlook for Microchannel Heat Exchanger Industry Market
The microchannel heat exchanger market is poised for continued growth, driven by factors such as increasing demand for energy efficiency, technological innovation, and supportive government policies. Expanding into new markets, developing novel applications, and integrating smart technologies will be key strategies for success in this dynamic sector. The market's future potential is substantial, with opportunities for both established players and new entrants to capitalize on the growing demand for high-performance heat exchange solutions.
Microchannel Heat Exchanger Industry Segmentation
-
1. Construction Type
- 1.1. Shell and Tube
- 1.2. Plate Frame
- 1.3. Other Construction Types
-
2. End User
- 2.1. Oil and Gas Industry
- 2.2. Power Generation
- 2.3. Chemical
- 2.4. Food and Beverages
- 2.5. Other End Users
Microchannel Heat Exchanger Industry Segmentation By Geography
-
1. North America
- 1.1. United States
- 1.2. Canada
- 1.3. Mexico
- 1.4. Rest of North America
-
2. Europe
- 2.1. United Kingdom
- 2.2. Germany
- 2.3. France
- 2.4. Russia
- 2.5. NORDIC
- 2.6. Italy
- 2.7. Spain
- 2.8. Rest of Europe
-
3. Asia Pacific
- 3.1. India
- 3.2. China
- 3.3. Japan
- 3.4. Australia
- 3.5. Thailand
- 3.6. Indonesia
- 3.7. Malaysia
- 3.8. Rest of Asia Pacific
-
4. South America
- 4.1. Brazil
- 4.2. Argentina
- 4.3. Colombia
- 4.4. Rest of South America
-
5. Middle East and Africa
- 5.1. United Arab Emirates
- 5.2. Saudi Arabia
- 5.3. Qatar
- 5.4. Nigeria
- 5.5. South Africa
- 5.6. Egypt
- 5.7. Rest of the Middle East and Africa
Microchannel Heat Exchanger Industry Regional Market Share
Geographic Coverage of Microchannel Heat Exchanger Industry
Microchannel Heat Exchanger Industry REPORT HIGHLIGHTS
| Aspects | Details |
|---|---|
| Study Period | 2020-2034 |
| Base Year | 2025 |
| Estimated Year | 2026 |
| Forecast Period | 2026-2034 |
| Historical Period | 2020-2025 |
| Growth Rate | CAGR of 9.34% from 2020-2034 |
| Segmentation |
|
Table of Contents
- 1. Introduction
- 1.1. Research Scope
- 1.2. Market Segmentation
- 1.3. Research Objective
- 1.4. Definitions and Assumptions
- 2. Executive Summary
- 2.1. Market Snapshot
- 3. Market Dynamics
- 3.1. Market Drivers
- 3.2. Market Restrains
- 3.3. Market Trends
- 3.4. Market Opportunities
- 4. Market Factor Analysis
- 4.1. Porters Five Forces
- 4.1.1. Bargaining Power of Suppliers
- 4.1.2. Bargaining Power of Buyers
- 4.1.3. Threat of New Entrants
- 4.1.4. Threat of Substitutes
- 4.1.5. Competitive Rivalry
- 4.2. PESTEL analysis
- 4.3. BCG Analysis
- 4.3.1. Stars (High Growth, High Market Share)
- 4.3.2. Cash Cows (Low Growth, High Market Share)
- 4.3.3. Question Mark (High Growth, Low Market Share)
- 4.3.4. Dogs (Low Growth, Low Market Share)
- 4.4. Ansoff Matrix Analysis
- 4.5. Supply Chain Analysis
- 4.6. Regulatory Landscape
- 4.7. Current Market Potential and Opportunity Assessment (TAM–SAM–SOM Framework)
- 4.8. RAX Analyst Note
- 4.1. Porters Five Forces
- 5. Market Analysis, Insights and Forecast 2021-2033
- 5.1. Market Analysis, Insights and Forecast - by Construction Type
- 5.1.1. Shell and Tube
- 5.1.2. Plate Frame
- 5.1.3. Other Construction Types
- 5.2. Market Analysis, Insights and Forecast - by End User
- 5.2.1. Oil and Gas Industry
- 5.2.2. Power Generation
- 5.2.3. Chemical
- 5.2.4. Food and Beverages
- 5.2.5. Other End Users
- 5.3. Market Analysis, Insights and Forecast - by Region
- 5.3.1. North America
- 5.3.2. Europe
- 5.3.3. Asia Pacific
- 5.3.4. South America
- 5.3.5. Middle East and Africa
- 5.1. Market Analysis, Insights and Forecast - by Construction Type
- 6. Global Microchannel Heat Exchanger Industry Analysis, Insights and Forecast, 2021-2033
- 6.1. Market Analysis, Insights and Forecast - by Construction Type
- 6.1.1. Shell and Tube
- 6.1.2. Plate Frame
- 6.1.3. Other Construction Types
- 6.2. Market Analysis, Insights and Forecast - by End User
- 6.2.1. Oil and Gas Industry
- 6.2.2. Power Generation
- 6.2.3. Chemical
- 6.2.4. Food and Beverages
- 6.2.5. Other End Users
- 6.1. Market Analysis, Insights and Forecast - by Construction Type
- 7. North America Microchannel Heat Exchanger Industry Analysis, Insights and Forecast, 2020-2032
- 7.1. Market Analysis, Insights and Forecast - by Construction Type
- 7.1.1. Shell and Tube
- 7.1.2. Plate Frame
- 7.1.3. Other Construction Types
- 7.2. Market Analysis, Insights and Forecast - by End User
- 7.2.1. Oil and Gas Industry
- 7.2.2. Power Generation
- 7.2.3. Chemical
- 7.2.4. Food and Beverages
- 7.2.5. Other End Users
- 7.1. Market Analysis, Insights and Forecast - by Construction Type
- 8. Europe Microchannel Heat Exchanger Industry Analysis, Insights and Forecast, 2020-2032
- 8.1. Market Analysis, Insights and Forecast - by Construction Type
- 8.1.1. Shell and Tube
- 8.1.2. Plate Frame
- 8.1.3. Other Construction Types
- 8.2. Market Analysis, Insights and Forecast - by End User
- 8.2.1. Oil and Gas Industry
- 8.2.2. Power Generation
- 8.2.3. Chemical
- 8.2.4. Food and Beverages
- 8.2.5. Other End Users
- 8.1. Market Analysis, Insights and Forecast - by Construction Type
- 9. Asia Pacific Microchannel Heat Exchanger Industry Analysis, Insights and Forecast, 2020-2032
- 9.1. Market Analysis, Insights and Forecast - by Construction Type
- 9.1.1. Shell and Tube
- 9.1.2. Plate Frame
- 9.1.3. Other Construction Types
- 9.2. Market Analysis, Insights and Forecast - by End User
- 9.2.1. Oil and Gas Industry
- 9.2.2. Power Generation
- 9.2.3. Chemical
- 9.2.4. Food and Beverages
- 9.2.5. Other End Users
- 9.1. Market Analysis, Insights and Forecast - by Construction Type
- 10. South America Microchannel Heat Exchanger Industry Analysis, Insights and Forecast, 2020-2032
- 10.1. Market Analysis, Insights and Forecast - by Construction Type
- 10.1.1. Shell and Tube
- 10.1.2. Plate Frame
- 10.1.3. Other Construction Types
- 10.2. Market Analysis, Insights and Forecast - by End User
- 10.2.1. Oil and Gas Industry
- 10.2.2. Power Generation
- 10.2.3. Chemical
- 10.2.4. Food and Beverages
- 10.2.5. Other End Users
- 10.1. Market Analysis, Insights and Forecast - by Construction Type
- 11. Middle East and Africa Microchannel Heat Exchanger Industry Analysis, Insights and Forecast, 2020-2032
- 11.1. Market Analysis, Insights and Forecast - by Construction Type
- 11.1.1. Shell and Tube
- 11.1.2. Plate Frame
- 11.1.3. Other Construction Types
- 11.2. Market Analysis, Insights and Forecast - by End User
- 11.2.1. Oil and Gas Industry
- 11.2.2. Power Generation
- 11.2.3. Chemical
- 11.2.4. Food and Beverages
- 11.2.5. Other End Users
- 11.1. Market Analysis, Insights and Forecast - by Construction Type
- 12. Competitive Analysis
- 12.1. Company Profiles
- 12.1.1 Danfoss AS
- 12.1.1.1. Company Overview
- 12.1.1.2. Products
- 12.1.1.3. Company Financials
- 12.1.1.4. SWOT Analysis
- 12.1.2 Thermax Limited
- 12.1.2.1. Company Overview
- 12.1.2.2. Products
- 12.1.2.3. Company Financials
- 12.1.2.4. SWOT Analysis
- 12.1.3 Kelvion Holding GmbH*List Not Exhaustive 6 4 Market Ranking/Share (%) Analysi
- 12.1.3.1. Company Overview
- 12.1.3.2. Products
- 12.1.3.3. Company Financials
- 12.1.3.4. SWOT Analysis
- 12.1.4 Mersen SA
- 12.1.4.1. Company Overview
- 12.1.4.2. Products
- 12.1.4.3. Company Financials
- 12.1.4.4. SWOT Analysis
- 12.1.5 Barriquand Technologies Thermiques SAS
- 12.1.5.1. Company Overview
- 12.1.5.2. Products
- 12.1.5.3. Company Financials
- 12.1.5.4. SWOT Analysis
- 12.1.6 SPX Flow Inc
- 12.1.6.1. Company Overview
- 12.1.6.2. Products
- 12.1.6.3. Company Financials
- 12.1.6.4. SWOT Analysis
- 12.1.7 General Electric Company
- 12.1.7.1. Company Overview
- 12.1.7.2. Products
- 12.1.7.3. Company Financials
- 12.1.7.4. SWOT Analysis
- 12.1.8 Hisaka Works Ltd
- 12.1.8.1. Company Overview
- 12.1.8.2. Products
- 12.1.8.3. Company Financials
- 12.1.8.4. SWOT Analysis
- 12.1.9 Alfa Laval AB
- 12.1.9.1. Company Overview
- 12.1.9.2. Products
- 12.1.9.3. Company Financials
- 12.1.9.4. SWOT Analysis
- 12.1.1 Danfoss AS
- 12.2. Market Entropy
- 12.2.1 Company's Key Areas Served
- 12.2.2 Recent Developments
- 12.3. Company Market Share Analysis 2025
- 12.3.1 Top 5 Companies Market Share Analysis
- 12.3.2 Top 3 Companies Market Share Analysis
- 12.4. List of Potential Customers
- 13. Research Methodology
List of Figures
- Figure 1: Global Microchannel Heat Exchanger Industry Revenue Breakdown (Million, %) by Region 2025 & 2033
- Figure 2: North America Microchannel Heat Exchanger Industry Revenue (Million), by Construction Type 2025 & 2033
- Figure 3: North America Microchannel Heat Exchanger Industry Revenue Share (%), by Construction Type 2025 & 2033
- Figure 4: North America Microchannel Heat Exchanger Industry Revenue (Million), by End User 2025 & 2033
- Figure 5: North America Microchannel Heat Exchanger Industry Revenue Share (%), by End User 2025 & 2033
- Figure 6: North America Microchannel Heat Exchanger Industry Revenue (Million), by Country 2025 & 2033
- Figure 7: North America Microchannel Heat Exchanger Industry Revenue Share (%), by Country 2025 & 2033
- Figure 8: Europe Microchannel Heat Exchanger Industry Revenue (Million), by Construction Type 2025 & 2033
- Figure 9: Europe Microchannel Heat Exchanger Industry Revenue Share (%), by Construction Type 2025 & 2033
- Figure 10: Europe Microchannel Heat Exchanger Industry Revenue (Million), by End User 2025 & 2033
- Figure 11: Europe Microchannel Heat Exchanger Industry Revenue Share (%), by End User 2025 & 2033
- Figure 12: Europe Microchannel Heat Exchanger Industry Revenue (Million), by Country 2025 & 2033
- Figure 13: Europe Microchannel Heat Exchanger Industry Revenue Share (%), by Country 2025 & 2033
- Figure 14: Asia Pacific Microchannel Heat Exchanger Industry Revenue (Million), by Construction Type 2025 & 2033
- Figure 15: Asia Pacific Microchannel Heat Exchanger Industry Revenue Share (%), by Construction Type 2025 & 2033
- Figure 16: Asia Pacific Microchannel Heat Exchanger Industry Revenue (Million), by End User 2025 & 2033
- Figure 17: Asia Pacific Microchannel Heat Exchanger Industry Revenue Share (%), by End User 2025 & 2033
- Figure 18: Asia Pacific Microchannel Heat Exchanger Industry Revenue (Million), by Country 2025 & 2033
- Figure 19: Asia Pacific Microchannel Heat Exchanger Industry Revenue Share (%), by Country 2025 & 2033
- Figure 20: South America Microchannel Heat Exchanger Industry Revenue (Million), by Construction Type 2025 & 2033
- Figure 21: South America Microchannel Heat Exchanger Industry Revenue Share (%), by Construction Type 2025 & 2033
- Figure 22: South America Microchannel Heat Exchanger Industry Revenue (Million), by End User 2025 & 2033
- Figure 23: South America Microchannel Heat Exchanger Industry Revenue Share (%), by End User 2025 & 2033
- Figure 24: South America Microchannel Heat Exchanger Industry Revenue (Million), by Country 2025 & 2033
- Figure 25: South America Microchannel Heat Exchanger Industry Revenue Share (%), by Country 2025 & 2033
- Figure 26: Middle East and Africa Microchannel Heat Exchanger Industry Revenue (Million), by Construction Type 2025 & 2033
- Figure 27: Middle East and Africa Microchannel Heat Exchanger Industry Revenue Share (%), by Construction Type 2025 & 2033
- Figure 28: Middle East and Africa Microchannel Heat Exchanger Industry Revenue (Million), by End User 2025 & 2033
- Figure 29: Middle East and Africa Microchannel Heat Exchanger Industry Revenue Share (%), by End User 2025 & 2033
- Figure 30: Middle East and Africa Microchannel Heat Exchanger Industry Revenue (Million), by Country 2025 & 2033
- Figure 31: Middle East and Africa Microchannel Heat Exchanger Industry Revenue Share (%), by Country 2025 & 2033
List of Tables
- Table 1: Global Microchannel Heat Exchanger Industry Revenue Million Forecast, by Construction Type 2020 & 2033
- Table 2: Global Microchannel Heat Exchanger Industry Revenue Million Forecast, by End User 2020 & 2033
- Table 3: Global Microchannel Heat Exchanger Industry Revenue Million Forecast, by Region 2020 & 2033
- Table 4: Global Microchannel Heat Exchanger Industry Revenue Million Forecast, by Construction Type 2020 & 2033
- Table 5: Global Microchannel Heat Exchanger Industry Revenue Million Forecast, by End User 2020 & 2033
- Table 6: Global Microchannel Heat Exchanger Industry Revenue Million Forecast, by Country 2020 & 2033
- Table 7: United States Microchannel Heat Exchanger Industry Revenue (Million) Forecast, by Application 2020 & 2033
- Table 8: Canada Microchannel Heat Exchanger Industry Revenue (Million) Forecast, by Application 2020 & 2033
- Table 9: Mexico Microchannel Heat Exchanger Industry Revenue (Million) Forecast, by Application 2020 & 2033
- Table 10: Rest of North America Microchannel Heat Exchanger Industry Revenue (Million) Forecast, by Application 2020 & 2033
- Table 11: Global Microchannel Heat Exchanger Industry Revenue Million Forecast, by Construction Type 2020 & 2033
- Table 12: Global Microchannel Heat Exchanger Industry Revenue Million Forecast, by End User 2020 & 2033
- Table 13: Global Microchannel Heat Exchanger Industry Revenue Million Forecast, by Country 2020 & 2033
- Table 14: United Kingdom Microchannel Heat Exchanger Industry Revenue (Million) Forecast, by Application 2020 & 2033
- Table 15: Germany Microchannel Heat Exchanger Industry Revenue (Million) Forecast, by Application 2020 & 2033
- Table 16: France Microchannel Heat Exchanger Industry Revenue (Million) Forecast, by Application 2020 & 2033
- Table 17: Russia Microchannel Heat Exchanger Industry Revenue (Million) Forecast, by Application 2020 & 2033
- Table 18: NORDIC Microchannel Heat Exchanger Industry Revenue (Million) Forecast, by Application 2020 & 2033
- Table 19: Italy Microchannel Heat Exchanger Industry Revenue (Million) Forecast, by Application 2020 & 2033
- Table 20: Spain Microchannel Heat Exchanger Industry Revenue (Million) Forecast, by Application 2020 & 2033
- Table 21: Rest of Europe Microchannel Heat Exchanger Industry Revenue (Million) Forecast, by Application 2020 & 2033
- Table 22: Global Microchannel Heat Exchanger Industry Revenue Million Forecast, by Construction Type 2020 & 2033
- Table 23: Global Microchannel Heat Exchanger Industry Revenue Million Forecast, by End User 2020 & 2033
- Table 24: Global Microchannel Heat Exchanger Industry Revenue Million Forecast, by Country 2020 & 2033
- Table 25: India Microchannel Heat Exchanger Industry Revenue (Million) Forecast, by Application 2020 & 2033
- Table 26: China Microchannel Heat Exchanger Industry Revenue (Million) Forecast, by Application 2020 & 2033
- Table 27: Japan Microchannel Heat Exchanger Industry Revenue (Million) Forecast, by Application 2020 & 2033
- Table 28: Australia Microchannel Heat Exchanger Industry Revenue (Million) Forecast, by Application 2020 & 2033
- Table 29: Thailand Microchannel Heat Exchanger Industry Revenue (Million) Forecast, by Application 2020 & 2033
- Table 30: Indonesia Microchannel Heat Exchanger Industry Revenue (Million) Forecast, by Application 2020 & 2033
- Table 31: Malaysia Microchannel Heat Exchanger Industry Revenue (Million) Forecast, by Application 2020 & 2033
- Table 32: Rest of Asia Pacific Microchannel Heat Exchanger Industry Revenue (Million) Forecast, by Application 2020 & 2033
- Table 33: Global Microchannel Heat Exchanger Industry Revenue Million Forecast, by Construction Type 2020 & 2033
- Table 34: Global Microchannel Heat Exchanger Industry Revenue Million Forecast, by End User 2020 & 2033
- Table 35: Global Microchannel Heat Exchanger Industry Revenue Million Forecast, by Country 2020 & 2033
- Table 36: Brazil Microchannel Heat Exchanger Industry Revenue (Million) Forecast, by Application 2020 & 2033
- Table 37: Argentina Microchannel Heat Exchanger Industry Revenue (Million) Forecast, by Application 2020 & 2033
- Table 38: Colombia Microchannel Heat Exchanger Industry Revenue (Million) Forecast, by Application 2020 & 2033
- Table 39: Rest of South America Microchannel Heat Exchanger Industry Revenue (Million) Forecast, by Application 2020 & 2033
- Table 40: Global Microchannel Heat Exchanger Industry Revenue Million Forecast, by Construction Type 2020 & 2033
- Table 41: Global Microchannel Heat Exchanger Industry Revenue Million Forecast, by End User 2020 & 2033
- Table 42: Global Microchannel Heat Exchanger Industry Revenue Million Forecast, by Country 2020 & 2033
- Table 43: United Arab Emirates Microchannel Heat Exchanger Industry Revenue (Million) Forecast, by Application 2020 & 2033
- Table 44: Saudi Arabia Microchannel Heat Exchanger Industry Revenue (Million) Forecast, by Application 2020 & 2033
- Table 45: Qatar Microchannel Heat Exchanger Industry Revenue (Million) Forecast, by Application 2020 & 2033
- Table 46: Nigeria Microchannel Heat Exchanger Industry Revenue (Million) Forecast, by Application 2020 & 2033
- Table 47: South Africa Microchannel Heat Exchanger Industry Revenue (Million) Forecast, by Application 2020 & 2033
- Table 48: Egypt Microchannel Heat Exchanger Industry Revenue (Million) Forecast, by Application 2020 & 2033
- Table 49: Rest of the Middle East and Africa Microchannel Heat Exchanger Industry Revenue (Million) Forecast, by Application 2020 & 2033
Frequently Asked Questions
1. What is the projected Compound Annual Growth Rate (CAGR) of the Microchannel Heat Exchanger Industry?
The projected CAGR is approximately 9.34%.
2. Which companies are prominent players in the Microchannel Heat Exchanger Industry?
Key companies in the market include Danfoss AS, Thermax Limited, Kelvion Holding GmbH*List Not Exhaustive 6 4 Market Ranking/Share (%) Analysi, Mersen SA, Barriquand Technologies Thermiques SAS, SPX Flow Inc, General Electric Company, Hisaka Works Ltd, Alfa Laval AB.
3. What are the main segments of the Microchannel Heat Exchanger Industry?
The market segments include Construction Type, End User.
4. Can you provide details about the market size?
The market size is estimated to be USD 18.08 Million as of 2022.
5. What are some drivers contributing to market growth?
4.; Increasing Industrialization across the World4.; Expansion and Development of New Power Plants.
6. What are the notable trends driving market growth?
Power Generation Expected to Dominate the Market.
7. Are there any restraints impacting market growth?
4.; Increasing Adoption of Renewable Energy.
8. Can you provide examples of recent developments in the market?
September 2023: APV, a part of SPX FLOW’s suite of process solutions, introduced the new Plate Heat Exchanger FastFrame. The product has improved usability and durability, which is expected to save time and money for food and beverage operators.
9. What pricing options are available for accessing the report?
Pricing options include single-user, multi-user, and enterprise licenses priced at USD 4750, USD 5250, and USD 8750 respectively.
10. Is the market size provided in terms of value or volume?
The market size is provided in terms of value, measured in Million.
11. Are there any specific market keywords associated with the report?
Yes, the market keyword associated with the report is "Microchannel Heat Exchanger Industry," which aids in identifying and referencing the specific market segment covered.
12. How do I determine which pricing option suits my needs best?
The pricing options vary based on user requirements and access needs. Individual users may opt for single-user licenses, while businesses requiring broader access may choose multi-user or enterprise licenses for cost-effective access to the report.
13. Are there any additional resources or data provided in the Microchannel Heat Exchanger Industry report?
While the report offers comprehensive insights, it's advisable to review the specific contents or supplementary materials provided to ascertain if additional resources or data are available.
14. How can I stay updated on further developments or reports in the Microchannel Heat Exchanger Industry?
To stay informed about further developments, trends, and reports in the Microchannel Heat Exchanger Industry, consider subscribing to industry newsletters, following relevant companies and organizations, or regularly checking reputable industry news sources and publications.
Methodology
Step 1 - Identification of Relevant Samples Size from Population Database


Step 2 - Approaches for Defining Global Market Size (Value, Volume* & Price*)

Note*: In applicable scenarios
Step 3 - Data Sources
Primary Research
- Web Analytics
- Survey Reports
- Research Institute
- Latest Research Reports
- Opinion Leaders
Secondary Research
- Annual Reports
- White Paper
- Latest Press Release
- Industry Association
- Paid Database
- Investor Presentations

Step 4 - Data Triangulation
Involves using different sources of information in order to increase the validity of a study
These sources are likely to be stakeholders in a program - participants, other researchers, program staff, other community members, and so on.
Then we put all data in single framework & apply various statistical tools to find out the dynamic on the market.
During the analysis stage, feedback from the stakeholder groups would be compared to determine areas of agreement as well as areas of divergence