

Key Insights
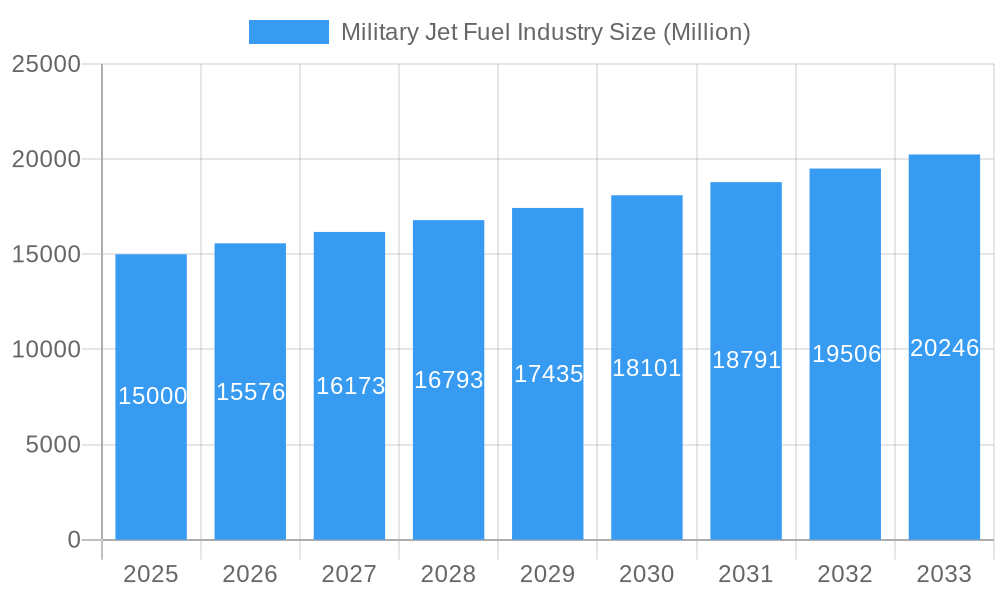
The global military jet fuel market, valued at approximately $15 billion in 2025, is projected to experience steady growth, driven by increasing defense budgets globally and a rising demand for air superiority. The market's Compound Annual Growth Rate (CAGR) of 3.84% from 2025 to 2033 reflects a consistent, albeit moderate, expansion. Key growth drivers include modernization of existing military aircraft fleets, the procurement of advanced fighter jets, and an increase in military exercises and operations. The segment dominated by Air Turbine Fuel (ATF) is expected to retain its market leadership due to its established performance characteristics and widespread use. However, the adoption of Renewable Aviation Fuel (RAF) is anticipated to gain momentum during the forecast period, driven by environmental concerns and government initiatives promoting sustainable aviation. While geopolitical instability and fluctuations in crude oil prices pose challenges, the long-term outlook for the military jet fuel market remains positive, particularly in regions with significant military spending such as North America and the Asia-Pacific.
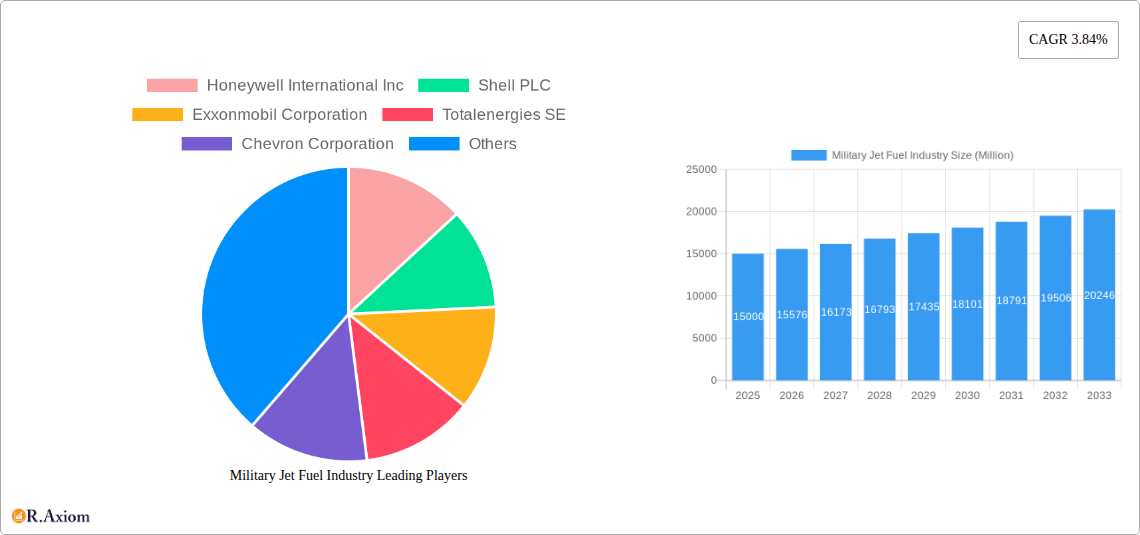
Military Jet Fuel Industry Market Size (In Billion)
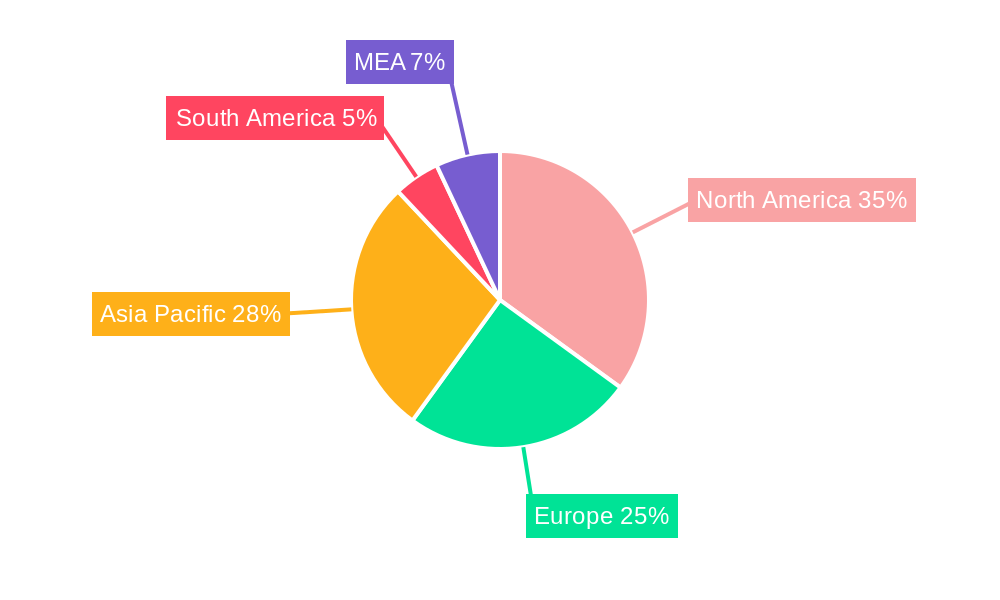
The market segmentation reveals a significant reliance on traditional ATF, though the emergence of RAF presents a compelling long-term opportunity. Competition among major players like Honeywell International Inc., Shell PLC, and ExxonMobil Corporation is fierce, characterized by continuous innovation in fuel formulations to enhance performance and efficiency. Regional variations in market growth are expected, with North America and Asia-Pacific leading the charge, fueled by robust military modernization programs and geopolitical factors. Europe is also a significant market player, though growth may be slightly more moderate due to varying defense spending priorities across nations. The continued integration of technological advancements aimed at improving fuel efficiency and reducing emissions will further shape the trajectory of this vital sector within the global defense industry.
Military Jet Fuel Industry Company Market Share
Military Jet Fuel Industry: A Comprehensive Market Report (2019-2033)
This in-depth report provides a comprehensive analysis of the Military Jet Fuel industry, covering market dynamics, key players, and future growth prospects from 2019 to 2033. The study period spans from 2019-2024 (historical period), with 2025 serving as the base and estimated year. The forecast period extends from 2025-2033, offering valuable insights for industry stakeholders, investors, and strategic decision-makers. The report incorporates data on key segments – Air Turbine Fuel and Renewable Aviation Fuel – and profiles major companies including Honeywell International Inc, Shell PLC, ExxonMobil Corporation, TotalEnergies SE, Chevron Corporation, GS Caltex Corporation, BP PLC, and Repsol SA. The report projects a xx Million market value by 2033, with a CAGR of xx%.
Military Jet Fuel Industry Market Concentration & Innovation
This section analyzes market concentration, innovation drivers, regulatory frameworks, and other key factors shaping the industry. The global military jet fuel market is characterized by a moderately concentrated landscape, with a handful of major players holding significant market share. However, regional variations exist, with some regions exhibiting higher levels of fragmentation.
- Market Share: ExxonMobil, Shell, and Chevron collectively account for an estimated xx% of the global market share in 2025, while other players such as Honeywell and TotalEnergies SE hold significant, yet smaller, portions. Exact percentages are available in the full report.
- Innovation Drivers: The primary driver of innovation is the ongoing need for enhanced fuel efficiency, reduced emissions, and improved performance under extreme conditions. Research and development efforts focus on sustainable aviation fuels (SAFs) and the development of advanced additives to enhance fuel properties.
- Regulatory Frameworks: Stringent environmental regulations and safety standards imposed by governments worldwide significantly influence the industry, promoting the adoption of cleaner fuels and stricter quality control measures.
- Product Substitutes: Currently, there are limited viable substitutes for conventional air turbine fuel in military applications. However, the increasing development and adoption of SAFs present a potential long-term substitute.
- End-User Trends: The demand for jet fuel is primarily driven by military aircraft operations globally. Future demand is projected to be influenced by geopolitical factors, defense budgets, and technological advancements in aircraft propulsion systems.
- M&A Activities: Consolidation through mergers and acquisitions remains a strategic priority for many industry players. Recent M&A deal values have ranged from xx Million to xx Million, reflecting ongoing industry consolidation. Detailed information about significant M&A activities within the studied period is presented in the full report.
Military Jet Fuel Industry Industry Trends & Insights
The global military jet fuel market is experiencing steady growth, driven by factors such as rising defense spending, increased military aircraft operations, and geopolitical instability. However, environmental concerns and the increasing focus on sustainability are compelling a shift towards SAFs. The market penetration of SAFs is currently low but expected to grow significantly over the forecast period, driven by governmental incentives and growing environmental awareness. Technological advancements are driving efficiency gains and the development of advanced fuel formulations. The competitive landscape is dynamic, with both established players and new entrants vying for market share.
Dominant Markets & Segments in Military Jet Fuel Industry
The North American and European regions currently dominate the military jet fuel market, driven by significant military spending and a large fleet of military aircraft. However, Asia-Pacific is anticipated to show the strongest growth over the forecast period due to rising defense budgets and expanding air forces.
Air Turbine Fuel: This segment currently holds the largest market share, driven by its extensive use in military aircraft. Key growth drivers include:
- Increased military aircraft operations.
- Rising defense budgets in several key regions.
- Technological advancements in aircraft engines that require specialized fuels.
Renewable Aviation Fuel (RAF): This segment is currently a small but rapidly growing portion of the market. Key drivers for growth include:
- Stringent environmental regulations.
- Government incentives and subsidies for sustainable aviation fuels.
- Growing environmental awareness and the desire to reduce carbon emissions.
Detailed market size projections and analyses for each segment and region are available in the complete report.
Military Jet Fuel Industry Product Developments
Recent product innovations focus on improving fuel efficiency, enhancing performance in extreme conditions, and reducing emissions. The development of SAFs is a critical area of focus, with many companies investing heavily in research and development to create cost-effective and readily available alternatives to conventional fuels. These advancements are enhancing the market fit by addressing environmental concerns and regulatory pressures while improving aircraft performance.
Report Scope & Segmentation Analysis
This report segments the military jet fuel market based on fuel type (Air Turbine Fuel and Renewable Aviation Fuel) and geography. Each segment's market size, growth projections, and competitive dynamics are analyzed in detail. Growth projections for Air Turbine Fuel are relatively stable, whereas the Renewable Aviation Fuel segment is expected to exhibit substantial growth due to regulatory pressures and increasing environmental awareness. Competitive dynamics vary across segments and regions.
Key Drivers of Military Jet Fuel Industry Growth
Several factors are driving the growth of the military jet fuel market. These include:
- Increased military spending globally.
- Modernization and expansion of military air forces in several key regions.
- Advancements in aircraft technology and engine efficiency.
- Government support for the development and adoption of SAFs.
Challenges in the Military Jet Fuel Industry Sector
The industry faces several challenges, including:
- Fluctuations in crude oil prices, impacting the cost of production.
- Stringent environmental regulations and the pressure to reduce emissions.
- Geopolitical instability and supply chain disruptions impacting fuel availability and pricing.
- The relatively high cost of SAFs compared to conventional fuels.
Emerging Opportunities in Military Jet Fuel Industry
The market presents several promising opportunities, including:
- The growing demand for SAFs driven by environmental concerns.
- The potential for technological breakthroughs in fuel production and efficiency.
- The expansion of military air forces in emerging markets.
Leading Players in the Military Jet Fuel Industry Market
- Honeywell International Inc
- Shell PLC
- ExxonMobil Corporation
- TotalEnergies SE
- Chevron Corporation
- GS Caltex Corporation
- BP PLC
- Repsol SA
Key Developments in Military Jet Fuel Industry Industry
July 2023: Viva Energy Refining Pty Ltd secured a six-year (potentially 12-year) contract with the Australian Department of Defense to supply aviation, marine, and ground fuel, including the resumption of JP-5 production at the Geelong Refinery. This significantly boosts Viva Energy's position in the Australian military fuel market.
March 2023: US sanctions on Myanmar's military regime impacted jet fuel supply to its armed forces, highlighting geopolitical risks and supply chain vulnerabilities within the industry.
Strategic Outlook for Military Jet Fuel Industry Market
The future of the military jet fuel market is promising, driven by sustained military spending, technological advancements, and the growing adoption of SAFs. While challenges remain, the industry is poised for continued growth, with significant opportunities for companies that can effectively navigate the regulatory landscape, embrace technological innovation, and secure strategic partnerships. The shift toward SAFs will play a key role in shaping the industry's trajectory over the forecast period.
Military Jet Fuel Industry Segmentation
-
1. Fuel Type
- 1.1. Air Turbine Fuel
- 1.2. Renewable Avaition Fuel
Military Jet Fuel Industry Segmentation By Geography
-
1. North America
- 1.1. United States
- 1.2. Canada
- 1.3. Rest of North America
-
2. Europe
- 2.1. Germany
- 2.2. United Kingdom
- 2.3. Italy
- 2.4. France
- 2.5. Russia
- 2.6. Rest of North America
-
3. Asia Pacific
- 3.1. China
- 3.2. India
- 3.3. Japan
- 3.4. South Korea
- 3.5. Rest of Asia Pacific
-
4. Rest of the World
- 4.1. Saudi Arabia
- 4.2. United Arab Emirates
- 4.3. South Africa
- 4.4. Algeria
Military Jet Fuel Industry Regional Market Share
Geographic Coverage of Military Jet Fuel Industry
Military Jet Fuel Industry REPORT HIGHLIGHTS
| Aspects | Details |
|---|---|
| Study Period | 2020-2034 |
| Base Year | 2025 |
| Estimated Year | 2026 |
| Forecast Period | 2026-2034 |
| Historical Period | 2020-2025 |
| Growth Rate | CAGR of 14.3% from 2020-2034 |
| Segmentation |
|
Table of Contents
- 1. Introduction
- 1.1. Research Scope
- 1.2. Market Segmentation
- 1.3. Research Objective
- 1.4. Definitions and Assumptions
- 2. Executive Summary
- 2.1. Market Snapshot
- 3. Market Dynamics
- 3.1. Market Drivers
- 3.2. Market Restrains
- 3.3. Market Trends
- 3.4. Market Opportunities
- 4. Market Factor Analysis
- 4.1. Porters Five Forces
- 4.1.1. Bargaining Power of Suppliers
- 4.1.2. Bargaining Power of Buyers
- 4.1.3. Threat of New Entrants
- 4.1.4. Threat of Substitutes
- 4.1.5. Competitive Rivalry
- 4.2. PESTEL analysis
- 4.3. BCG Analysis
- 4.3.1. Stars (High Growth, High Market Share)
- 4.3.2. Cash Cows (Low Growth, High Market Share)
- 4.3.3. Question Mark (High Growth, Low Market Share)
- 4.3.4. Dogs (Low Growth, Low Market Share)
- 4.4. Ansoff Matrix Analysis
- 4.5. Supply Chain Analysis
- 4.6. Regulatory Landscape
- 4.7. Current Market Potential and Opportunity Assessment (TAM–SAM–SOM Framework)
- 4.8. RAX Analyst Note
- 4.1. Porters Five Forces
- 5. Market Analysis, Insights and Forecast 2021-2033
- 5.1. Market Analysis, Insights and Forecast - by Fuel Type
- 5.1.1. Air Turbine Fuel
- 5.1.2. Renewable Avaition Fuel
- 5.2. Market Analysis, Insights and Forecast - by Region
- 5.2.1. North America
- 5.2.2. Europe
- 5.2.3. Asia Pacific
- 5.2.4. Rest of the World
- 5.1. Market Analysis, Insights and Forecast - by Fuel Type
- 6. Global Military Jet Fuel Industry Analysis, Insights and Forecast, 2021-2033
- 6.1. Market Analysis, Insights and Forecast - by Fuel Type
- 6.1.1. Air Turbine Fuel
- 6.1.2. Renewable Avaition Fuel
- 6.1. Market Analysis, Insights and Forecast - by Fuel Type
- 7. North America Military Jet Fuel Industry Analysis, Insights and Forecast, 2020-2032
- 7.1. Market Analysis, Insights and Forecast - by Fuel Type
- 7.1.1. Air Turbine Fuel
- 7.1.2. Renewable Avaition Fuel
- 7.1. Market Analysis, Insights and Forecast - by Fuel Type
- 8. Europe Military Jet Fuel Industry Analysis, Insights and Forecast, 2020-2032
- 8.1. Market Analysis, Insights and Forecast - by Fuel Type
- 8.1.1. Air Turbine Fuel
- 8.1.2. Renewable Avaition Fuel
- 8.1. Market Analysis, Insights and Forecast - by Fuel Type
- 9. Asia Pacific Military Jet Fuel Industry Analysis, Insights and Forecast, 2020-2032
- 9.1. Market Analysis, Insights and Forecast - by Fuel Type
- 9.1.1. Air Turbine Fuel
- 9.1.2. Renewable Avaition Fuel
- 9.1. Market Analysis, Insights and Forecast - by Fuel Type
- 10. Rest of the World Military Jet Fuel Industry Analysis, Insights and Forecast, 2020-2032
- 10.1. Market Analysis, Insights and Forecast - by Fuel Type
- 10.1.1. Air Turbine Fuel
- 10.1.2. Renewable Avaition Fuel
- 10.1. Market Analysis, Insights and Forecast - by Fuel Type
- 11. Competitive Analysis
- 11.1. Company Profiles
- 11.1.1 Honeywell International Inc
- 11.1.1.1. Company Overview
- 11.1.1.2. Products
- 11.1.1.3. Company Financials
- 11.1.1.4. SWOT Analysis
- 11.1.2 Shell PLC
- 11.1.2.1. Company Overview
- 11.1.2.2. Products
- 11.1.2.3. Company Financials
- 11.1.2.4. SWOT Analysis
- 11.1.3 Exxonmobil Corporation
- 11.1.3.1. Company Overview
- 11.1.3.2. Products
- 11.1.3.3. Company Financials
- 11.1.3.4. SWOT Analysis
- 11.1.4 Totalenergies SE
- 11.1.4.1. Company Overview
- 11.1.4.2. Products
- 11.1.4.3. Company Financials
- 11.1.4.4. SWOT Analysis
- 11.1.5 Chevron Corporation
- 11.1.5.1. Company Overview
- 11.1.5.2. Products
- 11.1.5.3. Company Financials
- 11.1.5.4. SWOT Analysis
- 11.1.6 GS Caltex Corporation
- 11.1.6.1. Company Overview
- 11.1.6.2. Products
- 11.1.6.3. Company Financials
- 11.1.6.4. SWOT Analysis
- 11.1.7 BP PLC
- 11.1.7.1. Company Overview
- 11.1.7.2. Products
- 11.1.7.3. Company Financials
- 11.1.7.4. SWOT Analysis
- 11.1.8 Repsol SA
- 11.1.8.1. Company Overview
- 11.1.8.2. Products
- 11.1.8.3. Company Financials
- 11.1.8.4. SWOT Analysis
- 11.1.1 Honeywell International Inc
- 11.2. Market Entropy
- 11.2.1 Company's Key Areas Served
- 11.2.2 Recent Developments
- 11.3. Company Market Share Analysis 2025
- 11.3.1 Top 5 Companies Market Share Analysis
- 11.3.2 Top 3 Companies Market Share Analysis
- 11.4. List of Potential Customers
- 12. Research Methodology
List of Figures
- Figure 1: Global Military Jet Fuel Industry Revenue Breakdown (billion, %) by Region 2025 & 2033
- Figure 2: Global Military Jet Fuel Industry Volume Breakdown (Litre, %) by Region 2025 & 2033
- Figure 3: North America Military Jet Fuel Industry Revenue (billion), by Fuel Type 2025 & 2033
- Figure 4: North America Military Jet Fuel Industry Volume (Litre), by Fuel Type 2025 & 2033
- Figure 5: North America Military Jet Fuel Industry Revenue Share (%), by Fuel Type 2025 & 2033
- Figure 6: North America Military Jet Fuel Industry Volume Share (%), by Fuel Type 2025 & 2033
- Figure 7: North America Military Jet Fuel Industry Revenue (billion), by Country 2025 & 2033
- Figure 8: North America Military Jet Fuel Industry Volume (Litre), by Country 2025 & 2033
- Figure 9: North America Military Jet Fuel Industry Revenue Share (%), by Country 2025 & 2033
- Figure 10: North America Military Jet Fuel Industry Volume Share (%), by Country 2025 & 2033
- Figure 11: Europe Military Jet Fuel Industry Revenue (billion), by Fuel Type 2025 & 2033
- Figure 12: Europe Military Jet Fuel Industry Volume (Litre), by Fuel Type 2025 & 2033
- Figure 13: Europe Military Jet Fuel Industry Revenue Share (%), by Fuel Type 2025 & 2033
- Figure 14: Europe Military Jet Fuel Industry Volume Share (%), by Fuel Type 2025 & 2033
- Figure 15: Europe Military Jet Fuel Industry Revenue (billion), by Country 2025 & 2033
- Figure 16: Europe Military Jet Fuel Industry Volume (Litre), by Country 2025 & 2033
- Figure 17: Europe Military Jet Fuel Industry Revenue Share (%), by Country 2025 & 2033
- Figure 18: Europe Military Jet Fuel Industry Volume Share (%), by Country 2025 & 2033
- Figure 19: Asia Pacific Military Jet Fuel Industry Revenue (billion), by Fuel Type 2025 & 2033
- Figure 20: Asia Pacific Military Jet Fuel Industry Volume (Litre), by Fuel Type 2025 & 2033
- Figure 21: Asia Pacific Military Jet Fuel Industry Revenue Share (%), by Fuel Type 2025 & 2033
- Figure 22: Asia Pacific Military Jet Fuel Industry Volume Share (%), by Fuel Type 2025 & 2033
- Figure 23: Asia Pacific Military Jet Fuel Industry Revenue (billion), by Country 2025 & 2033
- Figure 24: Asia Pacific Military Jet Fuel Industry Volume (Litre), by Country 2025 & 2033
- Figure 25: Asia Pacific Military Jet Fuel Industry Revenue Share (%), by Country 2025 & 2033
- Figure 26: Asia Pacific Military Jet Fuel Industry Volume Share (%), by Country 2025 & 2033
- Figure 27: Rest of the World Military Jet Fuel Industry Revenue (billion), by Fuel Type 2025 & 2033
- Figure 28: Rest of the World Military Jet Fuel Industry Volume (Litre), by Fuel Type 2025 & 2033
- Figure 29: Rest of the World Military Jet Fuel Industry Revenue Share (%), by Fuel Type 2025 & 2033
- Figure 30: Rest of the World Military Jet Fuel Industry Volume Share (%), by Fuel Type 2025 & 2033
- Figure 31: Rest of the World Military Jet Fuel Industry Revenue (billion), by Country 2025 & 2033
- Figure 32: Rest of the World Military Jet Fuel Industry Volume (Litre), by Country 2025 & 2033
- Figure 33: Rest of the World Military Jet Fuel Industry Revenue Share (%), by Country 2025 & 2033
- Figure 34: Rest of the World Military Jet Fuel Industry Volume Share (%), by Country 2025 & 2033
List of Tables
- Table 1: Global Military Jet Fuel Industry Revenue billion Forecast, by Fuel Type 2020 & 2033
- Table 2: Global Military Jet Fuel Industry Volume Litre Forecast, by Fuel Type 2020 & 2033
- Table 3: Global Military Jet Fuel Industry Revenue billion Forecast, by Region 2020 & 2033
- Table 4: Global Military Jet Fuel Industry Volume Litre Forecast, by Region 2020 & 2033
- Table 5: Global Military Jet Fuel Industry Revenue billion Forecast, by Fuel Type 2020 & 2033
- Table 6: Global Military Jet Fuel Industry Volume Litre Forecast, by Fuel Type 2020 & 2033
- Table 7: Global Military Jet Fuel Industry Revenue billion Forecast, by Country 2020 & 2033
- Table 8: Global Military Jet Fuel Industry Volume Litre Forecast, by Country 2020 & 2033
- Table 9: United States Military Jet Fuel Industry Revenue (billion) Forecast, by Application 2020 & 2033
- Table 10: United States Military Jet Fuel Industry Volume (Litre) Forecast, by Application 2020 & 2033
- Table 11: Canada Military Jet Fuel Industry Revenue (billion) Forecast, by Application 2020 & 2033
- Table 12: Canada Military Jet Fuel Industry Volume (Litre) Forecast, by Application 2020 & 2033
- Table 13: Rest of North America Military Jet Fuel Industry Revenue (billion) Forecast, by Application 2020 & 2033
- Table 14: Rest of North America Military Jet Fuel Industry Volume (Litre) Forecast, by Application 2020 & 2033
- Table 15: Global Military Jet Fuel Industry Revenue billion Forecast, by Fuel Type 2020 & 2033
- Table 16: Global Military Jet Fuel Industry Volume Litre Forecast, by Fuel Type 2020 & 2033
- Table 17: Global Military Jet Fuel Industry Revenue billion Forecast, by Country 2020 & 2033
- Table 18: Global Military Jet Fuel Industry Volume Litre Forecast, by Country 2020 & 2033
- Table 19: Germany Military Jet Fuel Industry Revenue (billion) Forecast, by Application 2020 & 2033
- Table 20: Germany Military Jet Fuel Industry Volume (Litre) Forecast, by Application 2020 & 2033
- Table 21: United Kingdom Military Jet Fuel Industry Revenue (billion) Forecast, by Application 2020 & 2033
- Table 22: United Kingdom Military Jet Fuel Industry Volume (Litre) Forecast, by Application 2020 & 2033
- Table 23: Italy Military Jet Fuel Industry Revenue (billion) Forecast, by Application 2020 & 2033
- Table 24: Italy Military Jet Fuel Industry Volume (Litre) Forecast, by Application 2020 & 2033
- Table 25: France Military Jet Fuel Industry Revenue (billion) Forecast, by Application 2020 & 2033
- Table 26: France Military Jet Fuel Industry Volume (Litre) Forecast, by Application 2020 & 2033
- Table 27: Russia Military Jet Fuel Industry Revenue (billion) Forecast, by Application 2020 & 2033
- Table 28: Russia Military Jet Fuel Industry Volume (Litre) Forecast, by Application 2020 & 2033
- Table 29: Rest of North America Military Jet Fuel Industry Revenue (billion) Forecast, by Application 2020 & 2033
- Table 30: Rest of North America Military Jet Fuel Industry Volume (Litre) Forecast, by Application 2020 & 2033
- Table 31: Global Military Jet Fuel Industry Revenue billion Forecast, by Fuel Type 2020 & 2033
- Table 32: Global Military Jet Fuel Industry Volume Litre Forecast, by Fuel Type 2020 & 2033
- Table 33: Global Military Jet Fuel Industry Revenue billion Forecast, by Country 2020 & 2033
- Table 34: Global Military Jet Fuel Industry Volume Litre Forecast, by Country 2020 & 2033
- Table 35: China Military Jet Fuel Industry Revenue (billion) Forecast, by Application 2020 & 2033
- Table 36: China Military Jet Fuel Industry Volume (Litre) Forecast, by Application 2020 & 2033
- Table 37: India Military Jet Fuel Industry Revenue (billion) Forecast, by Application 2020 & 2033
- Table 38: India Military Jet Fuel Industry Volume (Litre) Forecast, by Application 2020 & 2033
- Table 39: Japan Military Jet Fuel Industry Revenue (billion) Forecast, by Application 2020 & 2033
- Table 40: Japan Military Jet Fuel Industry Volume (Litre) Forecast, by Application 2020 & 2033
- Table 41: South Korea Military Jet Fuel Industry Revenue (billion) Forecast, by Application 2020 & 2033
- Table 42: South Korea Military Jet Fuel Industry Volume (Litre) Forecast, by Application 2020 & 2033
- Table 43: Rest of Asia Pacific Military Jet Fuel Industry Revenue (billion) Forecast, by Application 2020 & 2033
- Table 44: Rest of Asia Pacific Military Jet Fuel Industry Volume (Litre) Forecast, by Application 2020 & 2033
- Table 45: Global Military Jet Fuel Industry Revenue billion Forecast, by Fuel Type 2020 & 2033
- Table 46: Global Military Jet Fuel Industry Volume Litre Forecast, by Fuel Type 2020 & 2033
- Table 47: Global Military Jet Fuel Industry Revenue billion Forecast, by Country 2020 & 2033
- Table 48: Global Military Jet Fuel Industry Volume Litre Forecast, by Country 2020 & 2033
- Table 49: Saudi Arabia Military Jet Fuel Industry Revenue (billion) Forecast, by Application 2020 & 2033
- Table 50: Saudi Arabia Military Jet Fuel Industry Volume (Litre) Forecast, by Application 2020 & 2033
- Table 51: United Arab Emirates Military Jet Fuel Industry Revenue (billion) Forecast, by Application 2020 & 2033
- Table 52: United Arab Emirates Military Jet Fuel Industry Volume (Litre) Forecast, by Application 2020 & 2033
- Table 53: South Africa Military Jet Fuel Industry Revenue (billion) Forecast, by Application 2020 & 2033
- Table 54: South Africa Military Jet Fuel Industry Volume (Litre) Forecast, by Application 2020 & 2033
- Table 55: Algeria Military Jet Fuel Industry Revenue (billion) Forecast, by Application 2020 & 2033
- Table 56: Algeria Military Jet Fuel Industry Volume (Litre) Forecast, by Application 2020 & 2033
Frequently Asked Questions
1. What is the projected Compound Annual Growth Rate (CAGR) of the Military Jet Fuel Industry?
The projected CAGR is approximately 14.3%.
2. Which companies are prominent players in the Military Jet Fuel Industry?
Key companies in the market include Honeywell International Inc, Shell PLC, Exxonmobil Corporation, Totalenergies SE, Chevron Corporation, GS Caltex Corporation, BP PLC, Repsol SA.
3. What are the main segments of the Military Jet Fuel Industry?
The market segments include Fuel Type.
4. Can you provide details about the market size?
The market size is estimated to be USD 11.3 billion as of 2022.
5. What are some drivers contributing to market growth?
4.; Modernization and Upgrades of Existing Military Aircraft Fleets4.; Increasing Defense Budgets.
6. What are the notable trends driving market growth?
Renewable Aviation Fuel to be the Fastest Growing Market.
7. Are there any restraints impacting market growth?
4.; Shift Toward Unmanned Aircraft.
8. Can you provide examples of recent developments in the market?
July 2023: Viva Energy Refining Pty Ltd (Viva Energy) secured a contract with the Department of Defense to supply aviation, marine, and ground fuel to the Australian Defense Force (ADF). The Fuel Supply Contract is for an initial six-year term which may be extended to 12 years. As part of the deal and an essential Australian Industry Capability activity, Viva Energy is expected to resume production at Geelong Refinery of F-44 (Avcat) or JP-5, a military specification aviation turbine fuel used on aircraft carriers.
9. What pricing options are available for accessing the report?
Pricing options include single-user, multi-user, and enterprise licenses priced at USD 4750, USD 5250, and USD 8750 respectively.
10. Is the market size provided in terms of value or volume?
The market size is provided in terms of value, measured in billion and volume, measured in Litre.
11. Are there any specific market keywords associated with the report?
Yes, the market keyword associated with the report is "Military Jet Fuel Industry," which aids in identifying and referencing the specific market segment covered.
12. How do I determine which pricing option suits my needs best?
The pricing options vary based on user requirements and access needs. Individual users may opt for single-user licenses, while businesses requiring broader access may choose multi-user or enterprise licenses for cost-effective access to the report.
13. Are there any additional resources or data provided in the Military Jet Fuel Industry report?
While the report offers comprehensive insights, it's advisable to review the specific contents or supplementary materials provided to ascertain if additional resources or data are available.
14. How can I stay updated on further developments or reports in the Military Jet Fuel Industry?
To stay informed about further developments, trends, and reports in the Military Jet Fuel Industry, consider subscribing to industry newsletters, following relevant companies and organizations, or regularly checking reputable industry news sources and publications.
Methodology
Step 1 - Identification of Relevant Samples Size from Population Database


Step 2 - Approaches for Defining Global Market Size (Value, Volume* & Price*)

Note*: In applicable scenarios
Step 3 - Data Sources
Primary Research
- Web Analytics
- Survey Reports
- Research Institute
- Latest Research Reports
- Opinion Leaders
Secondary Research
- Annual Reports
- White Paper
- Latest Press Release
- Industry Association
- Paid Database
- Investor Presentations

Step 4 - Data Triangulation
Involves using different sources of information in order to increase the validity of a study
These sources are likely to be stakeholders in a program - participants, other researchers, program staff, other community members, and so on.
Then we put all data in single framework & apply various statistical tools to find out the dynamic on the market.
During the analysis stage, feedback from the stakeholder groups would be compared to determine areas of agreement as well as areas of divergence