

Key Insights
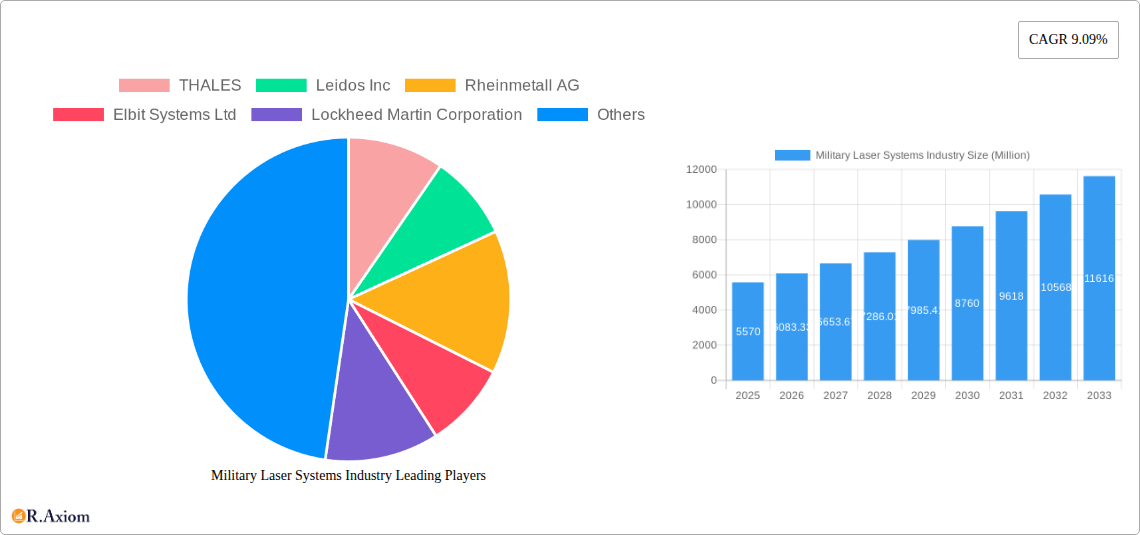
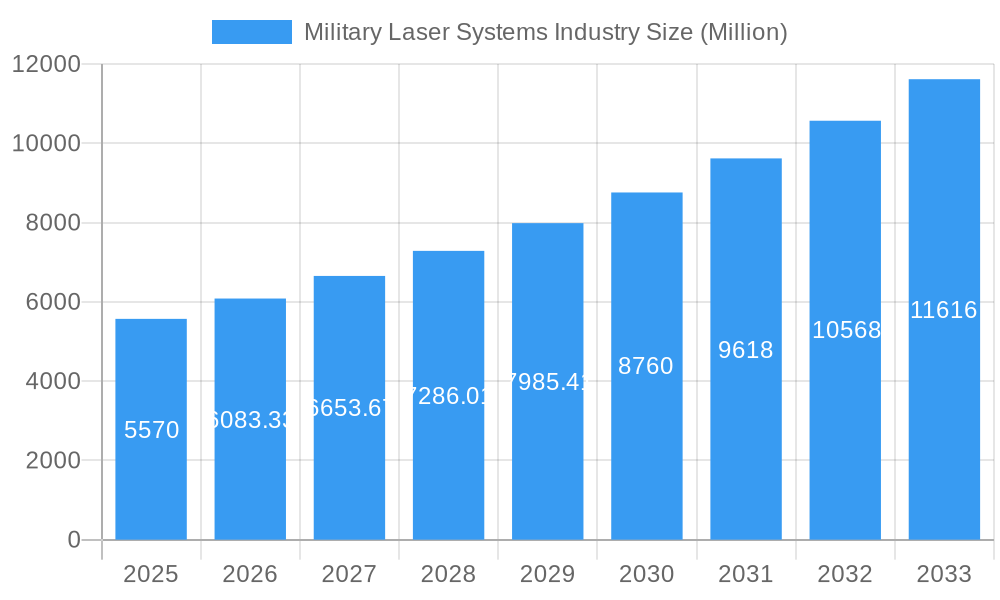
The Military Laser Systems market, valued at $5.57 billion in 2025, is projected to experience robust growth, driven by a Compound Annual Growth Rate (CAGR) of 9.09% from 2025 to 2033. This expansion is fueled by several key factors. Firstly, the increasing demand for advanced directed energy weapons (DEWs) across various military applications is a significant driver. DEWs offer significant advantages over traditional weaponry, including precision targeting, reduced collateral damage, and cost-effectiveness in the long run. Secondly, technological advancements in solid-state lasers and other laser technologies are leading to more compact, efficient, and powerful laser systems. This miniaturization allows for easier integration into various platforms, from fighter jets to ground vehicles, expanding their potential applications. Furthermore, the growing need for enhanced guidance systems and improved targeting capabilities in modern warfare is bolstering market growth. Laser rangefinders and designators offer superior accuracy and speed compared to conventional methods. Finally, rising defense budgets globally and geopolitical instability are contributing to increased investments in military laser systems.
Military Laser Systems Industry Market Size (In Billion)
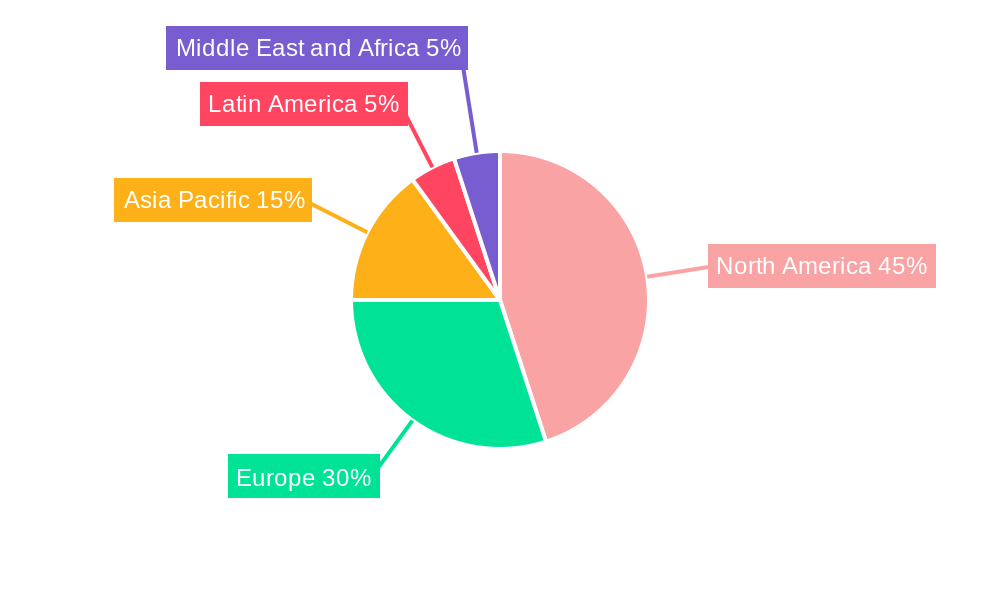
However, certain restraints impact market growth. High initial investment costs associated with developing and deploying these sophisticated systems can be a barrier for some nations. The technological complexity and the need for specialized maintenance and skilled personnel also represent challenges. Despite these restraints, the long-term strategic advantages offered by military laser systems are expected to outweigh these limitations, resulting in sustained market growth over the forecast period. The market segmentation reveals a strong focus on solid-state lasers, driven by their superior efficiency and versatility. The directed energy weapons segment is anticipated to hold the largest market share, driven by ongoing research and development efforts worldwide. North America and Europe currently dominate the market, due to the presence of major defense contractors and substantial military spending. However, the Asia-Pacific region is expected to witness significant growth in the coming years, fuelled by increased military modernization initiatives in countries like China and India. The competitive landscape is characterized by the presence of prominent players such as Thales, Lockheed Martin, and Raytheon, constantly striving for innovation and technological advancements.
Military Laser Systems Industry Company Market Share
Military Laser Systems Industry: A Comprehensive Market Analysis (2019-2033)
This in-depth report provides a comprehensive analysis of the Military Laser Systems industry, encompassing market size, growth drivers, technological advancements, competitive landscape, and future outlook. The study period spans from 2019 to 2033, with 2025 serving as the base and estimated year. The report offers actionable insights for industry stakeholders, including manufacturers, investors, and government agencies. The total market value in 2025 is estimated at xx Million, with a projected value of xx Million by 2033.
Military Laser Systems Industry Market Concentration & Innovation
The Military Laser Systems market is characterized by a moderately concentrated landscape, with a few major players holding significant market share. Companies like Lockheed Martin Corporation, THALES, The Boeing Company, and RTX Corporation dominate the market, collectively accounting for an estimated xx% of the global revenue in 2025. However, smaller, specialized companies are also contributing significantly through innovation and niche applications.
Innovation is a key driver, fueled by the continuous demand for improved accuracy, range, and power efficiency in laser systems. Government funding for R&D, particularly in directed energy weapons, significantly contributes to technological advancements. Stringent regulatory frameworks governing the development and deployment of military laser technology influence market dynamics. While few direct substitutes exist, technological breakthroughs in other directed energy weapon technologies (e.g., microwave weapons) pose potential long-term competitive pressure.
End-user trends are shifting toward more compact, mobile, and easily integrated laser systems, necessitating adaptable designs and lightweight materials. Mergers and acquisitions (M&A) activities are prevalent in the industry, with deal values exceeding xx Million in the last five years, driven by companies seeking to expand their product portfolios and technological capabilities. Notable examples include [Insert specific M&A examples if available, including deal values].
Military Laser Systems Industry Industry Trends & Insights
The Military Laser Systems market is experiencing robust growth, driven by increasing defense budgets globally and a growing need for advanced military technologies. The market is expected to exhibit a Compound Annual Growth Rate (CAGR) of xx% during the forecast period (2025-2033). Technological disruptions, particularly in solid-state laser technology, are contributing to improved performance and reduced costs, increasing market penetration. Consumer preferences are shifting towards systems with increased power output, improved accuracy and tracking capabilities, and reduced operational costs.
The competitive dynamics are intensified by the continuous development of advanced laser technologies and the strategic partnerships between major players and smaller technology companies. Market leaders are focusing on developing next-generation systems with enhanced capabilities, aiming for higher market share and securing lucrative government contracts.
Dominant Markets & Segments in Military Laser Systems Industry
The North American region holds a dominant position in the Military Laser Systems market, driven by substantial defense spending and technological advancements within the US military. This dominance is attributed to several factors:
- High defense budgets: Significant investment in R&D and procurement of advanced military technologies.
- Technological leadership: Presence of leading laser technology companies and extensive research capabilities within the US defense industry.
- Stringent defense requirements: Demand for high-performance and reliable laser systems for military applications.
Within the technology segments, solid-state lasers are experiencing rapid growth due to their advantages in size, weight, power efficiency, and adaptability to various military platforms. In terms of application, directed energy weapons (DEWs) are driving substantial growth, owing to rising geopolitical tensions and the need for advanced defense systems.
- Solid-State Lasers: Benefits include improved efficiency, higher power output, and compact size, making them well-suited for integration into various military platforms.
- Gas Lasers: Mature technology but limited applications compared to solid-state lasers, largely because of limitations in power efficiency and size.
- Directed Energy Weapons (DEWs): High growth potential due to their ability to disable or destroy targets from a distance.
- Guidance Systems: Increasing integration of laser technology into missile guidance systems.
- Laser Sights, Designators, and Rangefinders: Established market with continuous demand for improved accuracy and range.
Military Laser Systems Industry Product Developments
Recent product innovations are centered around high-power, solid-state lasers, aiming for improved power efficiency, reduced size, and increased reliability. Miniaturization is a key trend, enabling integration of laser systems into smaller platforms such as unmanned aerial vehicles (UAVs) and ground vehicles. Companies are leveraging advanced cooling technologies and materials to enhance laser performance and durability. These developments directly address market needs for lightweight, robust, and easily deployable laser systems.
Report Scope & Segmentation Analysis
This report segments the Military Laser Systems market based on technology (Solid State Lasers, Gas Lasers, Others) and application (Directed Energy Weapons, Guidance Systems, Laser Sights, Designators and Rangefinders, Others). Each segment is analyzed in detail, providing insights into market size, growth projections, and competitive dynamics. For example, the solid-state laser segment is projected to show robust growth due to its technological advancements and suitability for various applications. The directed energy weapons segment is expected to be the fastest-growing application segment, driven by increased defense budgets and geopolitical instability.
Key Drivers of Military Laser Systems Industry Growth
Several factors are fueling the growth of the Military Laser Systems industry: increasing defense spending by major global powers; the ongoing development of advanced laser technologies offering improved performance and cost-effectiveness; the growing demand for directed energy weapons and precision-guided munitions; and the ongoing technological advancements in solid-state laser technology. These factors collectively contribute to a significant expansion of the market over the forecast period.
Challenges in the Military Laser Systems Industry Sector
The Military Laser Systems industry faces several challenges. High manufacturing costs associated with advanced laser systems, particularly directed energy weapons, limit broader adoption. The complexity of integrating these systems into existing military platforms presents a significant technological hurdle. Additionally, regulatory hurdles and export controls for sensitive laser technology create barriers to market entry for certain companies.
Emerging Opportunities in Military Laser Systems Industry
The industry offers several emerging opportunities. The development of compact, highly efficient solid-state lasers is opening up new applications in smaller, more mobile platforms. Growing interest in directed energy weapons (DEWs) is creating a demand for advanced laser systems with higher power and accuracy. The development of advanced cooling and power management systems is enhancing the performance and durability of these laser systems, creating broader market opportunities.
Leading Players in the Military Laser Systems Industry Market
- THALES
- Leidos Inc
- Rheinmetall AG
- Elbit Systems Ltd
- Lockheed Martin Corporation
- MBDA
- IAI
- Rafael Advanced Defense Systems Ltd
- RTX Corporation
- BAE Systems plc
- Northrop Grumman Corporation
- The Boeing Company
Key Developments in Military Laser Systems Industry Industry
June 2023: RTX Corporation delivered the fourth combat-ready laser weapon to the US Air Force, showcasing advancements in high-power, mobile laser systems. This development demonstrates significant progress in the fielding of directed energy weapons.
April 2023: The US Department of Defence (DoD) awarded NUBURU Inc. a contract for solid-state high-energy laser (HEL) weapon system prototypes, underscoring the government's commitment to advanced laser technologies. This signals the continued investment in solid-state laser technology for military applications.
March 2023: Blighter Surveillance Systems' contract with Raytheon UK for radar systems in a laser weapon project with the UK MoD highlights the increasing importance of integrated sensor and weapon systems. This indicates a growing trend towards the development of integrated systems combining laser weapons with advanced sensor technologies.
Strategic Outlook for Military Laser Systems Industry Market
The Military Laser Systems market is poised for continued growth, driven by sustained investment in advanced military technologies and the increasing adoption of directed energy weapons. Technological advancements in solid-state lasers, coupled with ongoing efforts to miniaturize and integrate these systems into diverse platforms, will create substantial opportunities for growth. The market's future success hinges on ongoing innovation, effective integration strategies, and strategic partnerships to overcome technological and regulatory hurdles.
Military Laser Systems Industry Segmentation
-
1. Technology
- 1.1. Solid-state Lasers
- 1.2. Gas Lasers
- 1.3. Other Technologies
-
2. Application
- 2.1. Directed Energy Weapons
- 2.2. Guidance Systems
- 2.3. Laser Sights, Designators, and Rangefinders
- 2.4. Other Applications
Military Laser Systems Industry Segmentation By Geography
-
1. North America
- 1.1. United States
- 1.2. Canada
-
2. Europe
- 2.1. United Kingdom
- 2.2. Germany
- 2.3. France
- 2.4. Italy
- 2.5. Russia
- 2.6. Rest of Europe
-
3. Asia Pacific
- 3.1. China
- 3.2. India
- 3.3. Japan
- 3.4. South Korea
- 3.5. Rest of Asia Pacific
-
4. Latin America
- 4.1. Brazil
- 4.2. Rest of Latin America
-
5. Middle East and Africa
- 5.1. United Arab Emirates
- 5.2. Saudi Arabia
- 5.3. Israel
- 5.4. Rest of Middle East and Africa
Military Laser Systems Industry Regional Market Share
Geographic Coverage of Military Laser Systems Industry
Military Laser Systems Industry REPORT HIGHLIGHTS
| Aspects | Details |
|---|---|
| Study Period | 2020-2034 |
| Base Year | 2025 |
| Estimated Year | 2026 |
| Forecast Period | 2026-2034 |
| Historical Period | 2020-2025 |
| Growth Rate | CAGR of 9.09% from 2020-2034 |
| Segmentation |
|
Table of Contents
- 1. Introduction
- 1.1. Research Scope
- 1.2. Market Segmentation
- 1.3. Research Objective
- 1.4. Definitions and Assumptions
- 2. Executive Summary
- 2.1. Market Snapshot
- 3. Market Dynamics
- 3.1. Market Drivers
- 3.2. Market Restrains
- 3.3. Market Trends
- 3.4. Market Opportunities
- 4. Market Factor Analysis
- 4.1. Porters Five Forces
- 4.1.1. Bargaining Power of Suppliers
- 4.1.2. Bargaining Power of Buyers
- 4.1.3. Threat of New Entrants
- 4.1.4. Threat of Substitutes
- 4.1.5. Competitive Rivalry
- 4.2. PESTEL analysis
- 4.3. BCG Analysis
- 4.3.1. Stars (High Growth, High Market Share)
- 4.3.2. Cash Cows (Low Growth, High Market Share)
- 4.3.3. Question Mark (High Growth, Low Market Share)
- 4.3.4. Dogs (Low Growth, Low Market Share)
- 4.4. Ansoff Matrix Analysis
- 4.5. Supply Chain Analysis
- 4.6. Regulatory Landscape
- 4.7. Current Market Potential and Opportunity Assessment (TAM–SAM–SOM Framework)
- 4.8. RAX Analyst Note
- 4.1. Porters Five Forces
- 5. Market Analysis, Insights and Forecast 2021-2033
- 5.1. Market Analysis, Insights and Forecast - by Technology
- 5.1.1. Solid-state Lasers
- 5.1.2. Gas Lasers
- 5.1.3. Other Technologies
- 5.2. Market Analysis, Insights and Forecast - by Application
- 5.2.1. Directed Energy Weapons
- 5.2.2. Guidance Systems
- 5.2.3. Laser Sights, Designators, and Rangefinders
- 5.2.4. Other Applications
- 5.3. Market Analysis, Insights and Forecast - by Region
- 5.3.1. North America
- 5.3.2. Europe
- 5.3.3. Asia Pacific
- 5.3.4. Latin America
- 5.3.5. Middle East and Africa
- 5.1. Market Analysis, Insights and Forecast - by Technology
- 6. Global Military Laser Systems Industry Analysis, Insights and Forecast, 2021-2033
- 6.1. Market Analysis, Insights and Forecast - by Technology
- 6.1.1. Solid-state Lasers
- 6.1.2. Gas Lasers
- 6.1.3. Other Technologies
- 6.2. Market Analysis, Insights and Forecast - by Application
- 6.2.1. Directed Energy Weapons
- 6.2.2. Guidance Systems
- 6.2.3. Laser Sights, Designators, and Rangefinders
- 6.2.4. Other Applications
- 6.1. Market Analysis, Insights and Forecast - by Technology
- 7. North America Military Laser Systems Industry Analysis, Insights and Forecast, 2020-2032
- 7.1. Market Analysis, Insights and Forecast - by Technology
- 7.1.1. Solid-state Lasers
- 7.1.2. Gas Lasers
- 7.1.3. Other Technologies
- 7.2. Market Analysis, Insights and Forecast - by Application
- 7.2.1. Directed Energy Weapons
- 7.2.2. Guidance Systems
- 7.2.3. Laser Sights, Designators, and Rangefinders
- 7.2.4. Other Applications
- 7.1. Market Analysis, Insights and Forecast - by Technology
- 8. Europe Military Laser Systems Industry Analysis, Insights and Forecast, 2020-2032
- 8.1. Market Analysis, Insights and Forecast - by Technology
- 8.1.1. Solid-state Lasers
- 8.1.2. Gas Lasers
- 8.1.3. Other Technologies
- 8.2. Market Analysis, Insights and Forecast - by Application
- 8.2.1. Directed Energy Weapons
- 8.2.2. Guidance Systems
- 8.2.3. Laser Sights, Designators, and Rangefinders
- 8.2.4. Other Applications
- 8.1. Market Analysis, Insights and Forecast - by Technology
- 9. Asia Pacific Military Laser Systems Industry Analysis, Insights and Forecast, 2020-2032
- 9.1. Market Analysis, Insights and Forecast - by Technology
- 9.1.1. Solid-state Lasers
- 9.1.2. Gas Lasers
- 9.1.3. Other Technologies
- 9.2. Market Analysis, Insights and Forecast - by Application
- 9.2.1. Directed Energy Weapons
- 9.2.2. Guidance Systems
- 9.2.3. Laser Sights, Designators, and Rangefinders
- 9.2.4. Other Applications
- 9.1. Market Analysis, Insights and Forecast - by Technology
- 10. Latin America Military Laser Systems Industry Analysis, Insights and Forecast, 2020-2032
- 10.1. Market Analysis, Insights and Forecast - by Technology
- 10.1.1. Solid-state Lasers
- 10.1.2. Gas Lasers
- 10.1.3. Other Technologies
- 10.2. Market Analysis, Insights and Forecast - by Application
- 10.2.1. Directed Energy Weapons
- 10.2.2. Guidance Systems
- 10.2.3. Laser Sights, Designators, and Rangefinders
- 10.2.4. Other Applications
- 10.1. Market Analysis, Insights and Forecast - by Technology
- 11. Middle East and Africa Military Laser Systems Industry Analysis, Insights and Forecast, 2020-2032
- 11.1. Market Analysis, Insights and Forecast - by Technology
- 11.1.1. Solid-state Lasers
- 11.1.2. Gas Lasers
- 11.1.3. Other Technologies
- 11.2. Market Analysis, Insights and Forecast - by Application
- 11.2.1. Directed Energy Weapons
- 11.2.2. Guidance Systems
- 11.2.3. Laser Sights, Designators, and Rangefinders
- 11.2.4. Other Applications
- 11.1. Market Analysis, Insights and Forecast - by Technology
- 12. Competitive Analysis
- 12.1. Company Profiles
- 12.1.1 THALES
- 12.1.1.1. Company Overview
- 12.1.1.2. Products
- 12.1.1.3. Company Financials
- 12.1.1.4. SWOT Analysis
- 12.1.2 Leidos Inc
- 12.1.2.1. Company Overview
- 12.1.2.2. Products
- 12.1.2.3. Company Financials
- 12.1.2.4. SWOT Analysis
- 12.1.3 Rheinmetall AG
- 12.1.3.1. Company Overview
- 12.1.3.2. Products
- 12.1.3.3. Company Financials
- 12.1.3.4. SWOT Analysis
- 12.1.4 Elbit Systems Ltd
- 12.1.4.1. Company Overview
- 12.1.4.2. Products
- 12.1.4.3. Company Financials
- 12.1.4.4. SWOT Analysis
- 12.1.5 Lockheed Martin Corporation
- 12.1.5.1. Company Overview
- 12.1.5.2. Products
- 12.1.5.3. Company Financials
- 12.1.5.4. SWOT Analysis
- 12.1.6 MBDA
- 12.1.6.1. Company Overview
- 12.1.6.2. Products
- 12.1.6.3. Company Financials
- 12.1.6.4. SWOT Analysis
- 12.1.7 IAI
- 12.1.7.1. Company Overview
- 12.1.7.2. Products
- 12.1.7.3. Company Financials
- 12.1.7.4. SWOT Analysis
- 12.1.8 Rafael Advanced Defense Systems Ltd
- 12.1.8.1. Company Overview
- 12.1.8.2. Products
- 12.1.8.3. Company Financials
- 12.1.8.4. SWOT Analysis
- 12.1.9 RTX Corporation
- 12.1.9.1. Company Overview
- 12.1.9.2. Products
- 12.1.9.3. Company Financials
- 12.1.9.4. SWOT Analysis
- 12.1.10 BAE Systems plc
- 12.1.10.1. Company Overview
- 12.1.10.2. Products
- 12.1.10.3. Company Financials
- 12.1.10.4. SWOT Analysis
- 12.1.11 Northrop Grumman Corporation
- 12.1.11.1. Company Overview
- 12.1.11.2. Products
- 12.1.11.3. Company Financials
- 12.1.11.4. SWOT Analysis
- 12.1.12 The Boeing Company
- 12.1.12.1. Company Overview
- 12.1.12.2. Products
- 12.1.12.3. Company Financials
- 12.1.12.4. SWOT Analysis
- 12.1.1 THALES
- 12.2. Market Entropy
- 12.2.1 Company's Key Areas Served
- 12.2.2 Recent Developments
- 12.3. Company Market Share Analysis 2025
- 12.3.1 Top 5 Companies Market Share Analysis
- 12.3.2 Top 3 Companies Market Share Analysis
- 12.4. List of Potential Customers
- 13. Research Methodology
List of Figures
- Figure 1: Global Military Laser Systems Industry Revenue Breakdown (Million, %) by Region 2025 & 2033
- Figure 2: North America Military Laser Systems Industry Revenue (Million), by Technology 2025 & 2033
- Figure 3: North America Military Laser Systems Industry Revenue Share (%), by Technology 2025 & 2033
- Figure 4: North America Military Laser Systems Industry Revenue (Million), by Application 2025 & 2033
- Figure 5: North America Military Laser Systems Industry Revenue Share (%), by Application 2025 & 2033
- Figure 6: North America Military Laser Systems Industry Revenue (Million), by Country 2025 & 2033
- Figure 7: North America Military Laser Systems Industry Revenue Share (%), by Country 2025 & 2033
- Figure 8: Europe Military Laser Systems Industry Revenue (Million), by Technology 2025 & 2033
- Figure 9: Europe Military Laser Systems Industry Revenue Share (%), by Technology 2025 & 2033
- Figure 10: Europe Military Laser Systems Industry Revenue (Million), by Application 2025 & 2033
- Figure 11: Europe Military Laser Systems Industry Revenue Share (%), by Application 2025 & 2033
- Figure 12: Europe Military Laser Systems Industry Revenue (Million), by Country 2025 & 2033
- Figure 13: Europe Military Laser Systems Industry Revenue Share (%), by Country 2025 & 2033
- Figure 14: Asia Pacific Military Laser Systems Industry Revenue (Million), by Technology 2025 & 2033
- Figure 15: Asia Pacific Military Laser Systems Industry Revenue Share (%), by Technology 2025 & 2033
- Figure 16: Asia Pacific Military Laser Systems Industry Revenue (Million), by Application 2025 & 2033
- Figure 17: Asia Pacific Military Laser Systems Industry Revenue Share (%), by Application 2025 & 2033
- Figure 18: Asia Pacific Military Laser Systems Industry Revenue (Million), by Country 2025 & 2033
- Figure 19: Asia Pacific Military Laser Systems Industry Revenue Share (%), by Country 2025 & 2033
- Figure 20: Latin America Military Laser Systems Industry Revenue (Million), by Technology 2025 & 2033
- Figure 21: Latin America Military Laser Systems Industry Revenue Share (%), by Technology 2025 & 2033
- Figure 22: Latin America Military Laser Systems Industry Revenue (Million), by Application 2025 & 2033
- Figure 23: Latin America Military Laser Systems Industry Revenue Share (%), by Application 2025 & 2033
- Figure 24: Latin America Military Laser Systems Industry Revenue (Million), by Country 2025 & 2033
- Figure 25: Latin America Military Laser Systems Industry Revenue Share (%), by Country 2025 & 2033
- Figure 26: Middle East and Africa Military Laser Systems Industry Revenue (Million), by Technology 2025 & 2033
- Figure 27: Middle East and Africa Military Laser Systems Industry Revenue Share (%), by Technology 2025 & 2033
- Figure 28: Middle East and Africa Military Laser Systems Industry Revenue (Million), by Application 2025 & 2033
- Figure 29: Middle East and Africa Military Laser Systems Industry Revenue Share (%), by Application 2025 & 2033
- Figure 30: Middle East and Africa Military Laser Systems Industry Revenue (Million), by Country 2025 & 2033
- Figure 31: Middle East and Africa Military Laser Systems Industry Revenue Share (%), by Country 2025 & 2033
List of Tables
- Table 1: Global Military Laser Systems Industry Revenue Million Forecast, by Technology 2020 & 2033
- Table 2: Global Military Laser Systems Industry Revenue Million Forecast, by Application 2020 & 2033
- Table 3: Global Military Laser Systems Industry Revenue Million Forecast, by Region 2020 & 2033
- Table 4: Global Military Laser Systems Industry Revenue Million Forecast, by Technology 2020 & 2033
- Table 5: Global Military Laser Systems Industry Revenue Million Forecast, by Application 2020 & 2033
- Table 6: Global Military Laser Systems Industry Revenue Million Forecast, by Country 2020 & 2033
- Table 7: United States Military Laser Systems Industry Revenue (Million) Forecast, by Application 2020 & 2033
- Table 8: Canada Military Laser Systems Industry Revenue (Million) Forecast, by Application 2020 & 2033
- Table 9: Global Military Laser Systems Industry Revenue Million Forecast, by Technology 2020 & 2033
- Table 10: Global Military Laser Systems Industry Revenue Million Forecast, by Application 2020 & 2033
- Table 11: Global Military Laser Systems Industry Revenue Million Forecast, by Country 2020 & 2033
- Table 12: United Kingdom Military Laser Systems Industry Revenue (Million) Forecast, by Application 2020 & 2033
- Table 13: Germany Military Laser Systems Industry Revenue (Million) Forecast, by Application 2020 & 2033
- Table 14: France Military Laser Systems Industry Revenue (Million) Forecast, by Application 2020 & 2033
- Table 15: Italy Military Laser Systems Industry Revenue (Million) Forecast, by Application 2020 & 2033
- Table 16: Russia Military Laser Systems Industry Revenue (Million) Forecast, by Application 2020 & 2033
- Table 17: Rest of Europe Military Laser Systems Industry Revenue (Million) Forecast, by Application 2020 & 2033
- Table 18: Global Military Laser Systems Industry Revenue Million Forecast, by Technology 2020 & 2033
- Table 19: Global Military Laser Systems Industry Revenue Million Forecast, by Application 2020 & 2033
- Table 20: Global Military Laser Systems Industry Revenue Million Forecast, by Country 2020 & 2033
- Table 21: China Military Laser Systems Industry Revenue (Million) Forecast, by Application 2020 & 2033
- Table 22: India Military Laser Systems Industry Revenue (Million) Forecast, by Application 2020 & 2033
- Table 23: Japan Military Laser Systems Industry Revenue (Million) Forecast, by Application 2020 & 2033
- Table 24: South Korea Military Laser Systems Industry Revenue (Million) Forecast, by Application 2020 & 2033
- Table 25: Rest of Asia Pacific Military Laser Systems Industry Revenue (Million) Forecast, by Application 2020 & 2033
- Table 26: Global Military Laser Systems Industry Revenue Million Forecast, by Technology 2020 & 2033
- Table 27: Global Military Laser Systems Industry Revenue Million Forecast, by Application 2020 & 2033
- Table 28: Global Military Laser Systems Industry Revenue Million Forecast, by Country 2020 & 2033
- Table 29: Brazil Military Laser Systems Industry Revenue (Million) Forecast, by Application 2020 & 2033
- Table 30: Rest of Latin America Military Laser Systems Industry Revenue (Million) Forecast, by Application 2020 & 2033
- Table 31: Global Military Laser Systems Industry Revenue Million Forecast, by Technology 2020 & 2033
- Table 32: Global Military Laser Systems Industry Revenue Million Forecast, by Application 2020 & 2033
- Table 33: Global Military Laser Systems Industry Revenue Million Forecast, by Country 2020 & 2033
- Table 34: United Arab Emirates Military Laser Systems Industry Revenue (Million) Forecast, by Application 2020 & 2033
- Table 35: Saudi Arabia Military Laser Systems Industry Revenue (Million) Forecast, by Application 2020 & 2033
- Table 36: Israel Military Laser Systems Industry Revenue (Million) Forecast, by Application 2020 & 2033
- Table 37: Rest of Middle East and Africa Military Laser Systems Industry Revenue (Million) Forecast, by Application 2020 & 2033
Frequently Asked Questions
1. What is the projected Compound Annual Growth Rate (CAGR) of the Military Laser Systems Industry?
The projected CAGR is approximately 9.09%.
2. Which companies are prominent players in the Military Laser Systems Industry?
Key companies in the market include THALES, Leidos Inc, Rheinmetall AG, Elbit Systems Ltd, Lockheed Martin Corporation, MBDA, IAI, Rafael Advanced Defense Systems Ltd, RTX Corporation, BAE Systems plc, Northrop Grumman Corporation, The Boeing Company.
3. What are the main segments of the Military Laser Systems Industry?
The market segments include Technology, Application.
4. Can you provide details about the market size?
The market size is estimated to be USD 5.57 Million as of 2022.
5. What are some drivers contributing to market growth?
Increase in Internet of Things (IoT) and Autonomous Systems; Rise in Demand for Military and Defense Satellite Communication Solutions.
6. What are the notable trends driving market growth?
Directed Energy Weapons Segment Projected to Exhibit the Highest CAGR During the Forecast Period.
7. Are there any restraints impacting market growth?
Cybersecurity Threats to Satellite Communication; Interference in Transmission of Data.
8. Can you provide examples of recent developments in the market?
June 2023: RTX Corporation delivered the fourth combat-ready laser weapon to the US Air Force. The new palletized laser weapon was the first 10 KW laser built to US military specifications in a stand-alone configuration that can be moved and mounted anywhere it's needed.
9. What pricing options are available for accessing the report?
Pricing options include single-user, multi-user, and enterprise licenses priced at USD 4750, USD 5250, and USD 8750 respectively.
10. Is the market size provided in terms of value or volume?
The market size is provided in terms of value, measured in Million.
11. Are there any specific market keywords associated with the report?
Yes, the market keyword associated with the report is "Military Laser Systems Industry," which aids in identifying and referencing the specific market segment covered.
12. How do I determine which pricing option suits my needs best?
The pricing options vary based on user requirements and access needs. Individual users may opt for single-user licenses, while businesses requiring broader access may choose multi-user or enterprise licenses for cost-effective access to the report.
13. Are there any additional resources or data provided in the Military Laser Systems Industry report?
While the report offers comprehensive insights, it's advisable to review the specific contents or supplementary materials provided to ascertain if additional resources or data are available.
14. How can I stay updated on further developments or reports in the Military Laser Systems Industry?
To stay informed about further developments, trends, and reports in the Military Laser Systems Industry, consider subscribing to industry newsletters, following relevant companies and organizations, or regularly checking reputable industry news sources and publications.
Methodology
Step 1 - Identification of Relevant Samples Size from Population Database


Step 2 - Approaches for Defining Global Market Size (Value, Volume* & Price*)

Note*: In applicable scenarios
Step 3 - Data Sources
Primary Research
- Web Analytics
- Survey Reports
- Research Institute
- Latest Research Reports
- Opinion Leaders
Secondary Research
- Annual Reports
- White Paper
- Latest Press Release
- Industry Association
- Paid Database
- Investor Presentations

Step 4 - Data Triangulation
Involves using different sources of information in order to increase the validity of a study
These sources are likely to be stakeholders in a program - participants, other researchers, program staff, other community members, and so on.
Then we put all data in single framework & apply various statistical tools to find out the dynamic on the market.
During the analysis stage, feedback from the stakeholder groups would be compared to determine areas of agreement as well as areas of divergence