


Key Insights
The global mobile analytics software and tools market is projected to reach $9.55 billion by 2025, demonstrating a significant Compound Annual Growth Rate (CAGR) of 19.3%. This robust expansion is driven by the increasing need for businesses to understand user behavior, optimize app performance, and enhance user experiences. The proliferation of mobile devices and the subsequent surge in data generation are fundamental catalysts. As app ecosystem competition intensifies, companies are prioritizing advanced analytics to gain a competitive advantage, improve customer retention, and maximize revenue. This necessitates sophisticated tools for tracking user journeys, identifying pain points, and enabling data-driven decision-making across all business functions.
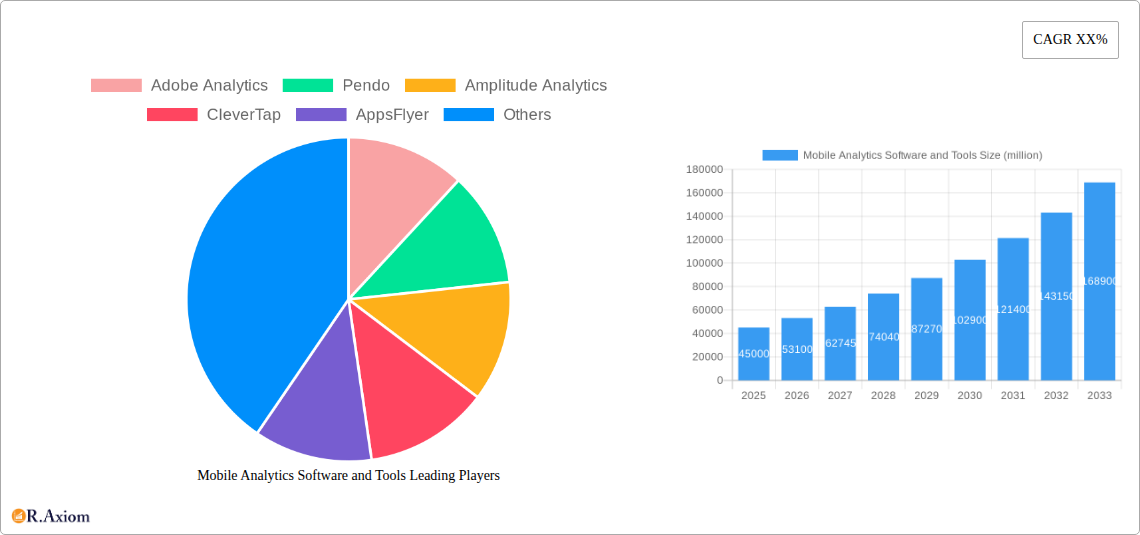
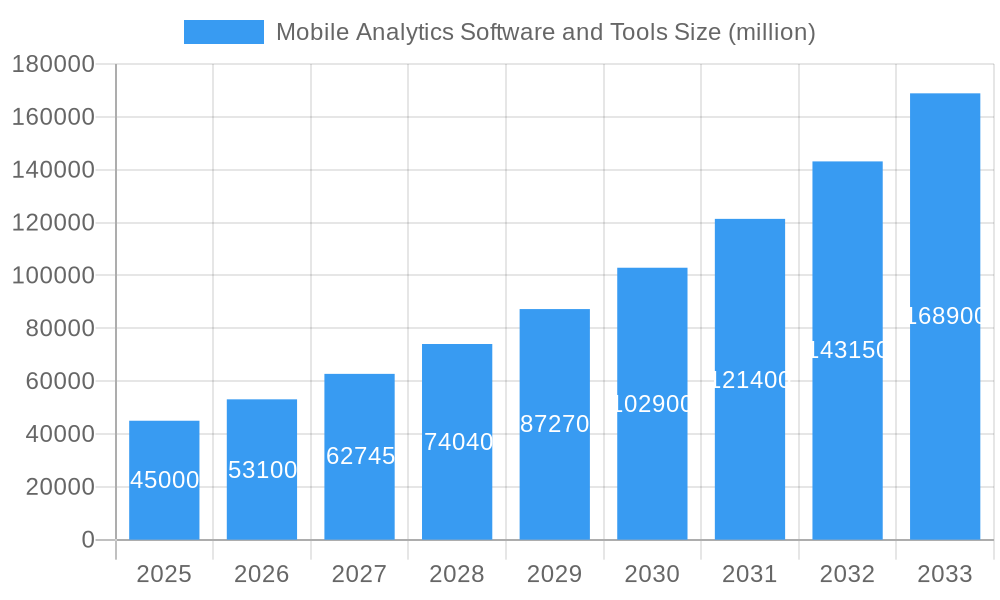
Mobile Analytics Software and Tools Market Size (In Billion)

The market segments by application and type. The Small and Medium-sized Enterprises (SMEs) segment is expected to experience strong growth, driven by the increasing affordability and accessibility of powerful mobile analytics solutions. Large enterprises will continue to be a substantial segment, utilizing these tools for in-depth strategic insights and complex data analysis. Within software types, Mobile App Analytics Software will lead, offering features from user engagement tracking to conversion rate optimization. Mobile Crash Reporting Software is also vital for ensuring app stability and a seamless user experience. Leading players like Adobe Analytics, Pendo, Amplitude Analytics, AppsFlyer, and Mixpanel are shaping the competitive landscape with comprehensive solutions. North America and Asia Pacific are anticipated to lead market adoption due to high smartphone penetration and advanced digital economies, with emerging markets also showing significant growth potential.
Mobile Analytics Software and Tools Company Market Share
Mobile Analytics Software and Tools Market Concentration & Innovation
The mobile analytics software and tools market exhibits a dynamic landscape characterized by moderate to high concentration, driven by continuous innovation. Leading companies such as Adobe Analytics, Pendo, Amplitude Analytics, CleverTap, AppsFlyer, Branch, Heap, Mixpanel, Smartlook, Crashlytics, Instabug, Sentry, Raygun, Bugsee, and QuincyKit are actively shaping market dynamics through strategic investments in R&D. The innovation drivers are primarily centered around enhancing user engagement, optimizing conversion funnels, and providing deeper insights into user behavior. Regulatory frameworks, including data privacy laws like GDPR and CCPA, are increasingly influencing product development and market strategies, fostering a greater emphasis on secure and compliant data handling. Product substitutes, while present in the form of generic business intelligence tools, are largely outmatched by the specialized functionalities offered by dedicated mobile analytics platforms. End-user trends are leaning towards integrated solutions that offer both behavioral analytics and crash reporting capabilities, thereby streamlining app development and maintenance processes. Mergers and acquisitions (M&A) activities are notable, with estimated deal values reaching millions of dollars annually as larger players seek to acquire innovative technologies or expand their market reach. For instance, M&A activities are projected to contribute over $500 million in deal value in the forecast period. The market share of the top five players is estimated to be around 65% in the base year of 2025.
Mobile Analytics Software and Tools Industry Trends & Insights
The global mobile analytics software and tools market is projected for robust growth, with an estimated Compound Annual Growth Rate (CAGR) of 18.5% over the forecast period of 2025–2033. This significant expansion is fueled by several interconnected market growth drivers. The burgeoning adoption of smartphones and the increasing complexity of mobile applications necessitate sophisticated tools for understanding user behavior and performance. Businesses across all sectors are recognizing the critical role of data-driven decision-making to enhance user experience, improve customer retention, and maximize revenue. Technological disruptions, including advancements in AI and machine learning, are enabling more predictive analytics, personalized user journeys, and proactive issue detection. These technologies are becoming integral to platforms from Adobe Analytics and Amplitude Analytics, offering capabilities that were unimaginable just a few years ago. Consumer preferences are increasingly demanding seamless and intuitive mobile experiences, pushing app developers to leverage analytics to identify pain points and optimize engagement strategies. Platforms like Pendo and CleverTap are at the forefront of facilitating this user-centric approach. The competitive dynamics within the industry are intense, with a constant stream of new feature releases and platform enhancements from established players and emerging startups. Market penetration for advanced mobile analytics solutions is expected to reach 75% by 2033, driven by the growing awareness of their ROI. In the historical period of 2019–2024, the market saw a CAGR of approximately 16.2%, indicating a steady upward trajectory. The increasing number of mobile applications developed globally, projected to exceed 6.5 million by 2025, directly correlates with the demand for these analytical tools. Furthermore, the rise of the digital economy and the necessity for businesses to maintain a strong online presence further augment the demand for mobile analytics.
Dominant Markets & Segments in Mobile Analytics Software and Tools
The mobile analytics software and tools market is dominated by regions demonstrating high digital penetration and a thriving mobile application ecosystem. North America, particularly the United States, is a leading market, driven by a concentration of tech giants and a strong SME sector actively investing in app development and optimization. The economic policies in this region are supportive of technological innovation and venture capital funding, which fuels the growth of companies like AppsFlyer and Branch. The dominance in the Type segment is clearly with Mobile App Analytics Software, accounting for an estimated 80% of the market share in the base year 2025. This is primarily due to the pervasive need for understanding user behavior within apps. However, Mobile Crash Reporting Software is a rapidly growing segment, with a projected CAGR of 19.8% over the forecast period, driven by the increasing demand for app stability and reliability. Companies like Crashlytics, Instabug, Sentry, Raygun, Bugsee, and QuincyKit are key players in this specialized niche.
In terms of Application, Large Enterprises represent a significant segment, contributing over 60% to the market revenue. This dominance is attributed to their substantial budgets for sophisticated analytics solutions and the critical need for comprehensive insights to manage large user bases and complex business objectives. Economic policies supporting digital transformation initiatives further bolster this segment. However, the Small and Medium-sized Enterprises (SMEs) segment is witnessing accelerated growth, with an estimated CAGR of 20.1% from 2025 to 2033. This surge is driven by the increasing affordability and accessibility of cloud-based mobile analytics tools, enabling smaller businesses to leverage data for competitive advantage. For instance, the growing number of startups and e-commerce businesses is a significant driver for SME adoption. Infrastructure development, such as widespread high-speed internet access, also plays a crucial role in enabling these segments to fully utilize mobile analytics platforms.
Mobile Analytics Software and Tools Product Developments
Product developments in the mobile analytics software and tools sector are characterized by a relentless focus on enhancing predictive capabilities, real-time data processing, and seamless integration across various platforms. Innovations are geared towards providing deeper insights into user journeys, enabling hyper-personalization of in-app experiences, and automating anomaly detection for both user behavior and app performance. Companies are increasingly incorporating AI and machine learning algorithms to offer advanced segmentation, churn prediction, and sentiment analysis. Competitive advantages are being carved out through intuitive user interfaces, robust data visualization tools, and the ability to consolidate data from multiple sources. The market is also seeing a trend towards specialized solutions that address specific industry needs, such as e-commerce analytics or gaming analytics, ensuring market fit and addressing unique challenges faced by different sectors.
Report Scope & Segmentation Analysis
This report delves into the comprehensive market segmentation of mobile analytics software and tools across key application and type categories. For the Application segment, the analysis covers SMEs and Large Enterprises, examining their distinct needs, adoption rates, and growth trajectories. Large Enterprises, projected to hold a market share of approximately 60% in 2025, are characterized by their extensive use of advanced features and enterprise-grade solutions. SMEs, on the other hand, are expected to experience a higher CAGR of 20.1% from 2025–2033, indicating their rapid adoption and growing reliance on these tools for competitive growth.
In the Type segment, the report differentiates between Mobile App Analytics Software and Mobile Crash Reporting Software. Mobile App Analytics Software, estimated to capture 80% of the market in 2025, encompasses tools for understanding user behavior, engagement, and retention. Mobile Crash Reporting Software, while a smaller segment in 2025, is projected to grow at an impressive CAGR of 19.8% throughout the forecast period, driven by the increasing emphasis on app stability and user satisfaction. The competitive dynamics within each segment vary, with established players often dominating the enterprise space, while agile startups cater to the evolving needs of SMEs and specialized crash reporting demands.
Key Drivers of Mobile Analytics Software and Tools Growth
The growth of the mobile analytics software and tools sector is propelled by a confluence of technological advancements, economic imperatives, and evolving consumer expectations. The proliferation of mobile devices globally, with an estimated installed base of over 7.5 billion by 2025, forms the foundational driver. Businesses across all industries are increasingly reliant on mobile applications to reach and engage their customers, necessitating robust analytical tools to understand user behavior, optimize app performance, and drive conversion rates. The exponential growth of data generated by mobile apps, estimated to reach over 150 zettabytes annually by 2025, presents both a challenge and an opportunity, fueling the demand for sophisticated analytics solutions capable of processing and interpreting this vast information. Furthermore, the competitive pressure to deliver superior user experiences is a significant catalyst, compelling companies to leverage insights from mobile analytics to personalize interactions, reduce churn, and enhance customer loyalty. For instance, advanced segmentation capabilities offered by platforms like Amplitude Analytics enable businesses to tailor offerings, increasing customer lifetime value.
Challenges in the Mobile Analytics Software and Tools Sector
Despite its robust growth trajectory, the mobile analytics software and tools sector faces several significant challenges. Data privacy and security concerns remain paramount, with increasingly stringent regulations such as GDPR and CCPA demanding strict compliance, which can lead to increased operational costs and complexities. The technical expertise required to effectively utilize advanced analytics platforms can be a barrier for some organizations, particularly SMEs, leading to underutilization of invested resources. Furthermore, the market is characterized by intense competition, with a large number of players vying for market share, leading to price pressures and the constant need for innovation to stay ahead. Ensuring data accuracy and reliability across diverse mobile operating systems and device fragmentation can also pose technical hurdles. The cost of sophisticated analytics solutions, while decreasing, can still be a limiting factor for smaller businesses, impacting market penetration in certain segments. Supply chain disruptions, though less prevalent for software, can impact the hardware infrastructure supporting cloud-based analytics.
Emerging Opportunities in Mobile Analytics Software and Tools
The mobile analytics software and tools market is rife with emerging opportunities, driven by evolving technological landscapes and shifting consumer behaviors. The burgeoning adoption of Artificial Intelligence (AI) and Machine Learning (ML) is opening new frontiers for predictive analytics, enabling businesses to anticipate user needs and proactively address potential issues. The demand for hyper-personalization in mobile experiences presents a significant opportunity for analytics platforms that can facilitate granular user segmentation and tailored engagement strategies. The increasing focus on user privacy, paradoxically, creates opportunities for analytics tools that prioritize data anonymization and ethical data handling, fostering trust and compliance. The growth of the Internet of Things (IoT) ecosystem, with its interconnected devices generating vast amounts of data, presents a new avenue for mobile analytics integration and insights. Furthermore, the rise of emerging economies and the rapid expansion of smartphone penetration in these regions offer substantial untapped market potential for mobile analytics solutions.
Leading Players in the Mobile Analytics Software and Tools Market
- Adobe Analytics
- Pendo
- Amplitude Analytics
- CleverTap
- AppsFlyer
- Branch
- Heap
- Mixpanel
- Smartlook
- Crashlytics
- Instabug
- Sentry
- Raygun
- Bugsee
- QuincyKit
Key Developments in Mobile Analytics Software and Tools Industry
- 2023/10: Amplitude Analytics launched advanced AI-powered insights for predictive churn analysis, enhancing its ability to forecast user retention.
- 2023/08: Pendo introduced enhanced product analytics features, focusing on helping companies understand user adoption of new features in real-time.
- 2023/05: CleverTap expanded its customer engagement platform with new automation capabilities for personalized marketing campaigns.
- 2023/03: AppsFlyer released enhanced fraud detection measures to safeguard mobile ad spend for marketers.
- 2022/12: Mixpanel unveiled a redesigned dashboard for improved data visualization and user experience.
- 2022/09: Sentry announced significant improvements in its error tracking and debugging capabilities for mobile applications.
Strategic Outlook for Mobile Analytics Software and Tools Market
The strategic outlook for the mobile analytics software and tools market is exceptionally bright, characterized by sustained growth and continuous innovation. The increasing commoditization of basic analytics functions will drive a greater emphasis on advanced capabilities such as AI-driven predictive modeling, hyper-personalization, and sophisticated data visualization. Strategic partnerships and acquisitions will remain crucial for market players seeking to expand their feature sets, geographical reach, and customer base, with an anticipated increase in M&A activities targeting specialized solutions. The growing regulatory landscape will necessitate a focus on compliance and data security, creating opportunities for platforms that excel in these areas. As businesses across all sectors increasingly recognize the indispensability of data-driven decision-making for mobile success, the demand for comprehensive and insightful mobile analytics tools is set to surge, promising substantial future market potential.
Mobile Analytics Software and Tools Segmentation
-
1. Application
- 1.1. SMEs
- 1.2. Large Enterprises
-
2. Types
- 2.1. Mobile App Analytics Software
- 2.2. Mobile Crash Reporting Software
Mobile Analytics Software and Tools Segmentation By Geography
-
1. North America
- 1.1. United States
- 1.2. Canada
- 1.3. Mexico
-
2. South America
- 2.1. Brazil
- 2.2. Argentina
- 2.3. Rest of South America
-
3. Europe
- 3.1. United Kingdom
- 3.2. Germany
- 3.3. France
- 3.4. Italy
- 3.5. Spain
- 3.6. Russia
- 3.7. Benelux
- 3.8. Nordics
- 3.9. Rest of Europe
-
4. Middle East & Africa
- 4.1. Turkey
- 4.2. Israel
- 4.3. GCC
- 4.4. North Africa
- 4.5. South Africa
- 4.6. Rest of Middle East & Africa
-
5. Asia Pacific
- 5.1. China
- 5.2. India
- 5.3. Japan
- 5.4. South Korea
- 5.5. ASEAN
- 5.6. Oceania
- 5.7. Rest of Asia Pacific
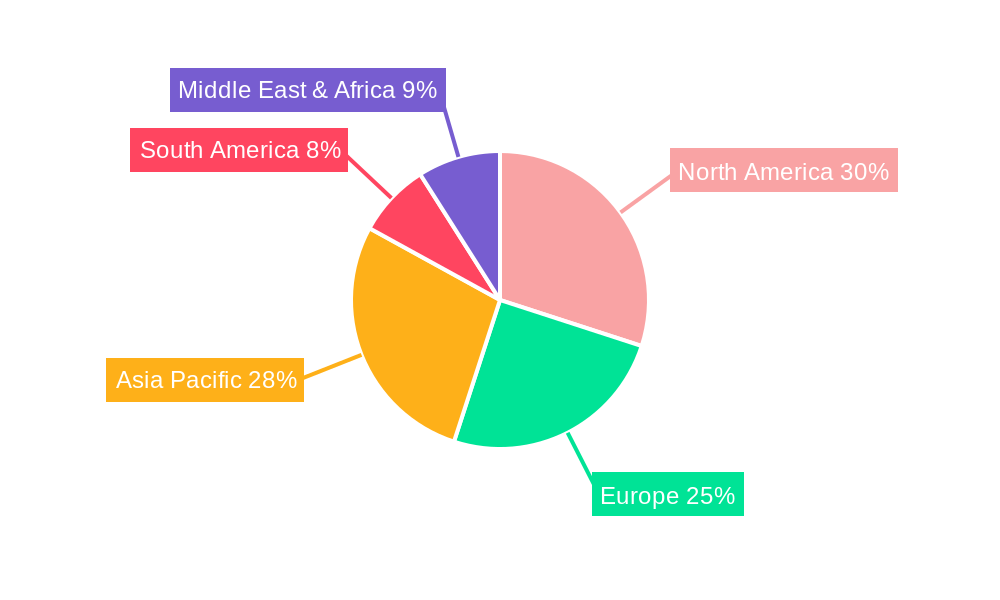
Mobile Analytics Software and Tools Regional Market Share
Geographic Coverage of Mobile Analytics Software and Tools
Mobile Analytics Software and Tools REPORT HIGHLIGHTS
| Aspects | Details |
|---|---|
| Study Period | 2020-2034 |
| Base Year | 2025 |
| Estimated Year | 2026 |
| Forecast Period | 2026-2034 |
| Historical Period | 2020-2025 |
| Growth Rate | CAGR of 19.3% from 2020-2034 |
| Segmentation |
|
Table of Contents
- 1. Introduction
- 1.1. Research Scope
- 1.2. Market Segmentation
- 1.3. Research Methodology
- 1.4. Definitions and Assumptions
- 2. Executive Summary
- 2.1. Introduction
- 3. Market Dynamics
- 3.1. Introduction
- 3.2. Market Drivers
- 3.3. Market Restrains
- 3.4. Market Trends
- 4. Market Factor Analysis
- 4.1. Porters Five Forces
- 4.2. Supply/Value Chain
- 4.3. PESTEL analysis
- 4.4. Market Entropy
- 4.5. Patent/Trademark Analysis
- 5. Global Mobile Analytics Software and Tools Analysis, Insights and Forecast, 2020-2032
- 5.1. Market Analysis, Insights and Forecast - by Application
- 5.1.1. SMEs
- 5.1.2. Large Enterprises
- 5.2. Market Analysis, Insights and Forecast - by Types
- 5.2.1. Mobile App Analytics Software
- 5.2.2. Mobile Crash Reporting Software
- 5.3. Market Analysis, Insights and Forecast - by Region
- 5.3.1. North America
- 5.3.2. South America
- 5.3.3. Europe
- 5.3.4. Middle East & Africa
- 5.3.5. Asia Pacific
- 5.1. Market Analysis, Insights and Forecast - by Application
- 6. North America Mobile Analytics Software and Tools Analysis, Insights and Forecast, 2020-2032
- 6.1. Market Analysis, Insights and Forecast - by Application
- 6.1.1. SMEs
- 6.1.2. Large Enterprises
- 6.2. Market Analysis, Insights and Forecast - by Types
- 6.2.1. Mobile App Analytics Software
- 6.2.2. Mobile Crash Reporting Software
- 6.1. Market Analysis, Insights and Forecast - by Application
- 7. South America Mobile Analytics Software and Tools Analysis, Insights and Forecast, 2020-2032
- 7.1. Market Analysis, Insights and Forecast - by Application
- 7.1.1. SMEs
- 7.1.2. Large Enterprises
- 7.2. Market Analysis, Insights and Forecast - by Types
- 7.2.1. Mobile App Analytics Software
- 7.2.2. Mobile Crash Reporting Software
- 7.1. Market Analysis, Insights and Forecast - by Application
- 8. Europe Mobile Analytics Software and Tools Analysis, Insights and Forecast, 2020-2032
- 8.1. Market Analysis, Insights and Forecast - by Application
- 8.1.1. SMEs
- 8.1.2. Large Enterprises
- 8.2. Market Analysis, Insights and Forecast - by Types
- 8.2.1. Mobile App Analytics Software
- 8.2.2. Mobile Crash Reporting Software
- 8.1. Market Analysis, Insights and Forecast - by Application
- 9. Middle East & Africa Mobile Analytics Software and Tools Analysis, Insights and Forecast, 2020-2032
- 9.1. Market Analysis, Insights and Forecast - by Application
- 9.1.1. SMEs
- 9.1.2. Large Enterprises
- 9.2. Market Analysis, Insights and Forecast - by Types
- 9.2.1. Mobile App Analytics Software
- 9.2.2. Mobile Crash Reporting Software
- 9.1. Market Analysis, Insights and Forecast - by Application
- 10. Asia Pacific Mobile Analytics Software and Tools Analysis, Insights and Forecast, 2020-2032
- 10.1. Market Analysis, Insights and Forecast - by Application
- 10.1.1. SMEs
- 10.1.2. Large Enterprises
- 10.2. Market Analysis, Insights and Forecast - by Types
- 10.2.1. Mobile App Analytics Software
- 10.2.2. Mobile Crash Reporting Software
- 10.1. Market Analysis, Insights and Forecast - by Application
- 11. Competitive Analysis
- 11.1. Global Market Share Analysis 2025
- 11.2. Company Profiles
- 11.2.1 Adobe Analytics
- 11.2.1.1. Overview
- 11.2.1.2. Products
- 11.2.1.3. SWOT Analysis
- 11.2.1.4. Recent Developments
- 11.2.1.5. Financials (Based on Availability)
- 11.2.2 Pendo
- 11.2.2.1. Overview
- 11.2.2.2. Products
- 11.2.2.3. SWOT Analysis
- 11.2.2.4. Recent Developments
- 11.2.2.5. Financials (Based on Availability)
- 11.2.3 Amplitude Analytics
- 11.2.3.1. Overview
- 11.2.3.2. Products
- 11.2.3.3. SWOT Analysis
- 11.2.3.4. Recent Developments
- 11.2.3.5. Financials (Based on Availability)
- 11.2.4 CleverTap
- 11.2.4.1. Overview
- 11.2.4.2. Products
- 11.2.4.3. SWOT Analysis
- 11.2.4.4. Recent Developments
- 11.2.4.5. Financials (Based on Availability)
- 11.2.5 AppsFlyer
- 11.2.5.1. Overview
- 11.2.5.2. Products
- 11.2.5.3. SWOT Analysis
- 11.2.5.4. Recent Developments
- 11.2.5.5. Financials (Based on Availability)
- 11.2.6 Branch
- 11.2.6.1. Overview
- 11.2.6.2. Products
- 11.2.6.3. SWOT Analysis
- 11.2.6.4. Recent Developments
- 11.2.6.5. Financials (Based on Availability)
- 11.2.7 Heap
- 11.2.7.1. Overview
- 11.2.7.2. Products
- 11.2.7.3. SWOT Analysis
- 11.2.7.4. Recent Developments
- 11.2.7.5. Financials (Based on Availability)
- 11.2.8 Mixpanel
- 11.2.8.1. Overview
- 11.2.8.2. Products
- 11.2.8.3. SWOT Analysis
- 11.2.8.4. Recent Developments
- 11.2.8.5. Financials (Based on Availability)
- 11.2.9 Smartlook
- 11.2.9.1. Overview
- 11.2.9.2. Products
- 11.2.9.3. SWOT Analysis
- 11.2.9.4. Recent Developments
- 11.2.9.5. Financials (Based on Availability)
- 11.2.10 Crashlytics
- 11.2.10.1. Overview
- 11.2.10.2. Products
- 11.2.10.3. SWOT Analysis
- 11.2.10.4. Recent Developments
- 11.2.10.5. Financials (Based on Availability)
- 11.2.11 Instabug
- 11.2.11.1. Overview
- 11.2.11.2. Products
- 11.2.11.3. SWOT Analysis
- 11.2.11.4. Recent Developments
- 11.2.11.5. Financials (Based on Availability)
- 11.2.12 Sentry
- 11.2.12.1. Overview
- 11.2.12.2. Products
- 11.2.12.3. SWOT Analysis
- 11.2.12.4. Recent Developments
- 11.2.12.5. Financials (Based on Availability)
- 11.2.13 Raygun
- 11.2.13.1. Overview
- 11.2.13.2. Products
- 11.2.13.3. SWOT Analysis
- 11.2.13.4. Recent Developments
- 11.2.13.5. Financials (Based on Availability)
- 11.2.14 Bugsee
- 11.2.14.1. Overview
- 11.2.14.2. Products
- 11.2.14.3. SWOT Analysis
- 11.2.14.4. Recent Developments
- 11.2.14.5. Financials (Based on Availability)
- 11.2.15 QuincyKit
- 11.2.15.1. Overview
- 11.2.15.2. Products
- 11.2.15.3. SWOT Analysis
- 11.2.15.4. Recent Developments
- 11.2.15.5. Financials (Based on Availability)
- 11.2.1 Adobe Analytics
List of Figures
- Figure 1: Global Mobile Analytics Software and Tools Revenue Breakdown (billion, %) by Region 2025 & 2033
- Figure 2: North America Mobile Analytics Software and Tools Revenue (billion), by Application 2025 & 2033
- Figure 3: North America Mobile Analytics Software and Tools Revenue Share (%), by Application 2025 & 2033
- Figure 4: North America Mobile Analytics Software and Tools Revenue (billion), by Types 2025 & 2033
- Figure 5: North America Mobile Analytics Software and Tools Revenue Share (%), by Types 2025 & 2033
- Figure 6: North America Mobile Analytics Software and Tools Revenue (billion), by Country 2025 & 2033
- Figure 7: North America Mobile Analytics Software and Tools Revenue Share (%), by Country 2025 & 2033
- Figure 8: South America Mobile Analytics Software and Tools Revenue (billion), by Application 2025 & 2033
- Figure 9: South America Mobile Analytics Software and Tools Revenue Share (%), by Application 2025 & 2033
- Figure 10: South America Mobile Analytics Software and Tools Revenue (billion), by Types 2025 & 2033
- Figure 11: South America Mobile Analytics Software and Tools Revenue Share (%), by Types 2025 & 2033
- Figure 12: South America Mobile Analytics Software and Tools Revenue (billion), by Country 2025 & 2033
- Figure 13: South America Mobile Analytics Software and Tools Revenue Share (%), by Country 2025 & 2033
- Figure 14: Europe Mobile Analytics Software and Tools Revenue (billion), by Application 2025 & 2033
- Figure 15: Europe Mobile Analytics Software and Tools Revenue Share (%), by Application 2025 & 2033
- Figure 16: Europe Mobile Analytics Software and Tools Revenue (billion), by Types 2025 & 2033
- Figure 17: Europe Mobile Analytics Software and Tools Revenue Share (%), by Types 2025 & 2033
- Figure 18: Europe Mobile Analytics Software and Tools Revenue (billion), by Country 2025 & 2033
- Figure 19: Europe Mobile Analytics Software and Tools Revenue Share (%), by Country 2025 & 2033
- Figure 20: Middle East & Africa Mobile Analytics Software and Tools Revenue (billion), by Application 2025 & 2033
- Figure 21: Middle East & Africa Mobile Analytics Software and Tools Revenue Share (%), by Application 2025 & 2033
- Figure 22: Middle East & Africa Mobile Analytics Software and Tools Revenue (billion), by Types 2025 & 2033
- Figure 23: Middle East & Africa Mobile Analytics Software and Tools Revenue Share (%), by Types 2025 & 2033
- Figure 24: Middle East & Africa Mobile Analytics Software and Tools Revenue (billion), by Country 2025 & 2033
- Figure 25: Middle East & Africa Mobile Analytics Software and Tools Revenue Share (%), by Country 2025 & 2033
- Figure 26: Asia Pacific Mobile Analytics Software and Tools Revenue (billion), by Application 2025 & 2033
- Figure 27: Asia Pacific Mobile Analytics Software and Tools Revenue Share (%), by Application 2025 & 2033
- Figure 28: Asia Pacific Mobile Analytics Software and Tools Revenue (billion), by Types 2025 & 2033
- Figure 29: Asia Pacific Mobile Analytics Software and Tools Revenue Share (%), by Types 2025 & 2033
- Figure 30: Asia Pacific Mobile Analytics Software and Tools Revenue (billion), by Country 2025 & 2033
- Figure 31: Asia Pacific Mobile Analytics Software and Tools Revenue Share (%), by Country 2025 & 2033
List of Tables
- Table 1: Global Mobile Analytics Software and Tools Revenue billion Forecast, by Application 2020 & 2033
- Table 2: Global Mobile Analytics Software and Tools Revenue billion Forecast, by Types 2020 & 2033
- Table 3: Global Mobile Analytics Software and Tools Revenue billion Forecast, by Region 2020 & 2033
- Table 4: Global Mobile Analytics Software and Tools Revenue billion Forecast, by Application 2020 & 2033
- Table 5: Global Mobile Analytics Software and Tools Revenue billion Forecast, by Types 2020 & 2033
- Table 6: Global Mobile Analytics Software and Tools Revenue billion Forecast, by Country 2020 & 2033
- Table 7: United States Mobile Analytics Software and Tools Revenue (billion) Forecast, by Application 2020 & 2033
- Table 8: Canada Mobile Analytics Software and Tools Revenue (billion) Forecast, by Application 2020 & 2033
- Table 9: Mexico Mobile Analytics Software and Tools Revenue (billion) Forecast, by Application 2020 & 2033
- Table 10: Global Mobile Analytics Software and Tools Revenue billion Forecast, by Application 2020 & 2033
- Table 11: Global Mobile Analytics Software and Tools Revenue billion Forecast, by Types 2020 & 2033
- Table 12: Global Mobile Analytics Software and Tools Revenue billion Forecast, by Country 2020 & 2033
- Table 13: Brazil Mobile Analytics Software and Tools Revenue (billion) Forecast, by Application 2020 & 2033
- Table 14: Argentina Mobile Analytics Software and Tools Revenue (billion) Forecast, by Application 2020 & 2033
- Table 15: Rest of South America Mobile Analytics Software and Tools Revenue (billion) Forecast, by Application 2020 & 2033
- Table 16: Global Mobile Analytics Software and Tools Revenue billion Forecast, by Application 2020 & 2033
- Table 17: Global Mobile Analytics Software and Tools Revenue billion Forecast, by Types 2020 & 2033
- Table 18: Global Mobile Analytics Software and Tools Revenue billion Forecast, by Country 2020 & 2033
- Table 19: United Kingdom Mobile Analytics Software and Tools Revenue (billion) Forecast, by Application 2020 & 2033
- Table 20: Germany Mobile Analytics Software and Tools Revenue (billion) Forecast, by Application 2020 & 2033
- Table 21: France Mobile Analytics Software and Tools Revenue (billion) Forecast, by Application 2020 & 2033
- Table 22: Italy Mobile Analytics Software and Tools Revenue (billion) Forecast, by Application 2020 & 2033
- Table 23: Spain Mobile Analytics Software and Tools Revenue (billion) Forecast, by Application 2020 & 2033
- Table 24: Russia Mobile Analytics Software and Tools Revenue (billion) Forecast, by Application 2020 & 2033
- Table 25: Benelux Mobile Analytics Software and Tools Revenue (billion) Forecast, by Application 2020 & 2033
- Table 26: Nordics Mobile Analytics Software and Tools Revenue (billion) Forecast, by Application 2020 & 2033
- Table 27: Rest of Europe Mobile Analytics Software and Tools Revenue (billion) Forecast, by Application 2020 & 2033
- Table 28: Global Mobile Analytics Software and Tools Revenue billion Forecast, by Application 2020 & 2033
- Table 29: Global Mobile Analytics Software and Tools Revenue billion Forecast, by Types 2020 & 2033
- Table 30: Global Mobile Analytics Software and Tools Revenue billion Forecast, by Country 2020 & 2033
- Table 31: Turkey Mobile Analytics Software and Tools Revenue (billion) Forecast, by Application 2020 & 2033
- Table 32: Israel Mobile Analytics Software and Tools Revenue (billion) Forecast, by Application 2020 & 2033
- Table 33: GCC Mobile Analytics Software and Tools Revenue (billion) Forecast, by Application 2020 & 2033
- Table 34: North Africa Mobile Analytics Software and Tools Revenue (billion) Forecast, by Application 2020 & 2033
- Table 35: South Africa Mobile Analytics Software and Tools Revenue (billion) Forecast, by Application 2020 & 2033
- Table 36: Rest of Middle East & Africa Mobile Analytics Software and Tools Revenue (billion) Forecast, by Application 2020 & 2033
- Table 37: Global Mobile Analytics Software and Tools Revenue billion Forecast, by Application 2020 & 2033
- Table 38: Global Mobile Analytics Software and Tools Revenue billion Forecast, by Types 2020 & 2033
- Table 39: Global Mobile Analytics Software and Tools Revenue billion Forecast, by Country 2020 & 2033
- Table 40: China Mobile Analytics Software and Tools Revenue (billion) Forecast, by Application 2020 & 2033
- Table 41: India Mobile Analytics Software and Tools Revenue (billion) Forecast, by Application 2020 & 2033
- Table 42: Japan Mobile Analytics Software and Tools Revenue (billion) Forecast, by Application 2020 & 2033
- Table 43: South Korea Mobile Analytics Software and Tools Revenue (billion) Forecast, by Application 2020 & 2033
- Table 44: ASEAN Mobile Analytics Software and Tools Revenue (billion) Forecast, by Application 2020 & 2033
- Table 45: Oceania Mobile Analytics Software and Tools Revenue (billion) Forecast, by Application 2020 & 2033
- Table 46: Rest of Asia Pacific Mobile Analytics Software and Tools Revenue (billion) Forecast, by Application 2020 & 2033
Frequently Asked Questions
1. What is the projected Compound Annual Growth Rate (CAGR) of the Mobile Analytics Software and Tools?
The projected CAGR is approximately 19.3%.
2. Which companies are prominent players in the Mobile Analytics Software and Tools?
Key companies in the market include Adobe Analytics, Pendo, Amplitude Analytics, CleverTap, AppsFlyer, Branch, Heap, Mixpanel, Smartlook, Crashlytics, Instabug, Sentry, Raygun, Bugsee, QuincyKit.
3. What are the main segments of the Mobile Analytics Software and Tools?
The market segments include Application, Types.
4. Can you provide details about the market size?
The market size is estimated to be USD 9.55 billion as of 2022.
5. What are some drivers contributing to market growth?
N/A
6. What are the notable trends driving market growth?
N/A
7. Are there any restraints impacting market growth?
N/A
8. Can you provide examples of recent developments in the market?
N/A
9. What pricing options are available for accessing the report?
Pricing options include single-user, multi-user, and enterprise licenses priced at USD 3350.00, USD 5025.00, and USD 6700.00 respectively.
10. Is the market size provided in terms of value or volume?
The market size is provided in terms of value, measured in billion.
11. Are there any specific market keywords associated with the report?
Yes, the market keyword associated with the report is "Mobile Analytics Software and Tools," which aids in identifying and referencing the specific market segment covered.
12. How do I determine which pricing option suits my needs best?
The pricing options vary based on user requirements and access needs. Individual users may opt for single-user licenses, while businesses requiring broader access may choose multi-user or enterprise licenses for cost-effective access to the report.
13. Are there any additional resources or data provided in the Mobile Analytics Software and Tools report?
While the report offers comprehensive insights, it's advisable to review the specific contents or supplementary materials provided to ascertain if additional resources or data are available.
14. How can I stay updated on further developments or reports in the Mobile Analytics Software and Tools?
To stay informed about further developments, trends, and reports in the Mobile Analytics Software and Tools, consider subscribing to industry newsletters, following relevant companies and organizations, or regularly checking reputable industry news sources and publications.
Methodology
Step 1 - Identification of Relevant Samples Size from Population Database


Step 2 - Approaches for Defining Global Market Size (Value, Volume* & Price*)

Note*: In applicable scenarios
Step 3 - Data Sources
Primary Research
- Web Analytics
- Survey Reports
- Research Institute
- Latest Research Reports
- Opinion Leaders
Secondary Research
- Annual Reports
- White Paper
- Latest Press Release
- Industry Association
- Paid Database
- Investor Presentations

Step 4 - Data Triangulation
Involves using different sources of information in order to increase the validity of a study
These sources are likely to be stakeholders in a program - participants, other researchers, program staff, other community members, and so on.
Then we put all data in single framework & apply various statistical tools to find out the dynamic on the market.
During the analysis stage, feedback from the stakeholder groups would be compared to determine areas of agreement as well as areas of divergence