
Key Insights
The mobile medical imaging market is experiencing robust growth, driven by the increasing prevalence of chronic diseases, a rising geriatric population, and the expanding demand for point-of-care diagnostics. The market's 5.10% CAGR from 2019 to 2024 indicates a strong trajectory, suggesting continued expansion through 2033. Key service types within this market include X-ray, ultrasound, and MRI, each contributing significantly to overall revenue. The preference for mobile imaging services is fueled by improved patient convenience, reduced healthcare costs associated with transportation, and the ability to provide timely diagnoses in remote or underserved areas. Hospitals and private clinics remain the dominant end-users, but the home healthcare and other specialized sectors (rehabilitation centers, geriatric care, etc.) are exhibiting substantial growth potential, signifying a shift towards decentralized and patient-centric care models. Technological advancements in mobile imaging equipment, such as miniaturization and improved image quality, are further accelerating market expansion. However, regulatory hurdles, high initial investment costs, and the need for skilled technicians present some challenges to market growth.
Geographic distribution reveals a strong presence in North America and Europe, driven by established healthcare infrastructure and higher adoption rates of advanced technologies. However, the Asia-Pacific region is projected to witness the fastest growth in the coming years, fueled by rising disposable incomes, improving healthcare infrastructure, and increasing awareness of preventative healthcare. Competitive intensity is moderate, with a mix of established players and emerging companies vying for market share. Strategic collaborations, acquisitions, and technological innovations are key strategies employed by companies to maintain a competitive edge. The overall market outlook remains positive, with significant opportunities for growth in both established and emerging markets. The continuing trend towards personalized and accessible healthcare will further fuel the expansion of the mobile medical imaging market.
Mobile Medical Imaging Industry Market Report: 2019-2033
This comprehensive report provides a detailed analysis of the mobile medical imaging industry, encompassing market size, segmentation, growth drivers, challenges, and key players. The study period covers 2019-2033, with 2025 as the base and estimated year. The forecast period spans 2025-2033, and the historical period is 2019-2024. The report offers actionable insights for industry stakeholders, investors, and businesses seeking to navigate this dynamic market. The global market is projected to reach xx Million by 2033.
Mobile Medical Imaging Industry Market Concentration & Innovation
The mobile medical imaging market exhibits a moderately concentrated structure, with a few large players and numerous smaller regional providers. Market share data for 2024 suggests that the top 5 players account for approximately xx% of the global revenue, while the remaining share is distributed among smaller companies. Innovation is driven by advancements in imaging technology, miniaturization of equipment, improved image quality, and the integration of AI and telemedicine. Regulatory frameworks vary across regions, impacting market entry and operation. Substitutes include traditional fixed-site imaging centers; however, the convenience and cost-effectiveness of mobile imaging are key competitive advantages. End-user trends are shifting towards greater demand for point-of-care diagnostics and home healthcare services.
- Market Share (2024): Top 5 Players - xx%; Others - xx%
- M&A Activity (2019-2024): xx deals with an aggregate value of xx Million. Notable deals included [mention specific examples if available, otherwise use "Several strategic acquisitions and partnerships aimed at expanding service offerings and geographical reach."].
- Key Innovation Drivers: AI-powered image analysis, wireless connectivity, miniaturization of equipment, and integration with EMR systems.
Mobile Medical Imaging Industry Industry Trends & Insights
The mobile medical imaging market is experiencing robust growth, driven by several factors. The rising prevalence of chronic diseases, aging populations, and increasing demand for convenient and accessible healthcare are major contributors. Technological advancements, such as portable ultrasound and X-ray machines, are enhancing the efficiency and effectiveness of mobile imaging services. The rising adoption of telehealth and remote patient monitoring is further fueling market expansion. Consumer preference is shifting towards convenience, cost-effectiveness, and reduced wait times, all of which mobile imaging services effectively address. The competitive landscape is characterized by both organic and inorganic growth strategies, including new product development, strategic partnerships, and acquisitions. The market is projected to exhibit a CAGR of xx% during the forecast period (2025-2033), with significant market penetration gains in underserved regions.

Dominant Markets & Segments in Mobile Medical Imaging Industry
The North American region currently holds a dominant position in the mobile medical imaging market, driven by high healthcare expenditure, technological advancements, and the presence of major market players. Within the service types, X-ray and Ultrasound dominate the market, contributing to the majority of revenue share. The high demand stems from their relative affordability, wide applicability, and established presence within established healthcare systems.
- Leading Region: North America
- Leading Service Types: X-ray and Ultrasound
- Key Drivers for North America: High healthcare spending, technological advancements, and established healthcare infrastructure.
- Key Drivers for X-ray & Ultrasound: Cost-effectiveness, wide applicability, and established infrastructure for these modalities.
- End-User Dominance: Hospitals and Private Clinics currently represent the largest end-user segment, accounting for approximately xx% of the market. However, Home Healthcare Service Providers are experiencing rapid growth, fueled by the rising prevalence of chronic diseases and an aging population. Other segments, including rehabilitation centers and sports organizations, are expected to witness significant growth over the forecast period.
Mobile Medical Imaging Industry Product Developments
Recent product innovations in mobile medical imaging focus on improving image quality, portability, and ease of use. Manufacturers are incorporating advanced technologies like AI-powered image analysis, wireless connectivity, and improved battery life. These advancements enhance diagnostic accuracy, reduce operational costs, and improve patient experience. The market is witnessing the introduction of smaller, lighter, and more versatile mobile imaging systems, catering to the growing demand for point-of-care and home healthcare applications. These products are competitively advantageous due to improved efficiency and convenience.
Report Scope & Segmentation Analysis
This report comprehensively segments the mobile medical imaging market based on service type (X-ray, Ultrasound, Magnetic Resonance Imaging (MRI), PET/CT, Others – Fluoroscopy, Mammography, Angiography, Holter monitoring, and Echocardiograph) and end-user (Hospitals and Private Clinics, Home Healthcare Service Providers, Others – Rehabilitation Centers, Geriatric Care, Sports Organizations, Military Organizations, and others). Each segment's market size, growth projections, and competitive dynamics are analyzed in detail. The "Others" segment encompasses a diverse range of applications, each with its unique growth trajectory and competitive dynamics.
Key Drivers of Mobile Medical Imaging Industry Growth
Several factors are driving the growth of the mobile medical imaging industry. Technological advancements, including miniaturization of equipment and improved image quality, are enhancing the accessibility and efficiency of mobile imaging services. The rising prevalence of chronic diseases and aging populations are increasing the demand for convenient and accessible healthcare. Favorable government regulations and initiatives promoting telehealth and remote patient monitoring are further bolstering market growth.
Challenges in the Mobile Medical Imaging Industry Sector
The mobile medical imaging industry faces challenges, including regulatory hurdles related to equipment approvals and data privacy, supply chain disruptions impacting the availability of components and skilled technicians, and intense competition among existing players. These challenges can lead to increased costs, delays in service delivery, and pressure on profit margins. The impact of these challenges varies depending on geographical location and market segment. For example, supply chain issues could lead to a xx% increase in equipment costs.
Emerging Opportunities in Mobile Medical Imaging Industry
Emerging opportunities in the mobile medical imaging industry include expansion into underserved markets, particularly in developing countries, the integration of AI and machine learning for improved diagnostic accuracy, and the development of specialized mobile imaging solutions for niche applications, such as sports medicine and veterinary care. These opportunities represent significant growth potential for innovative companies.
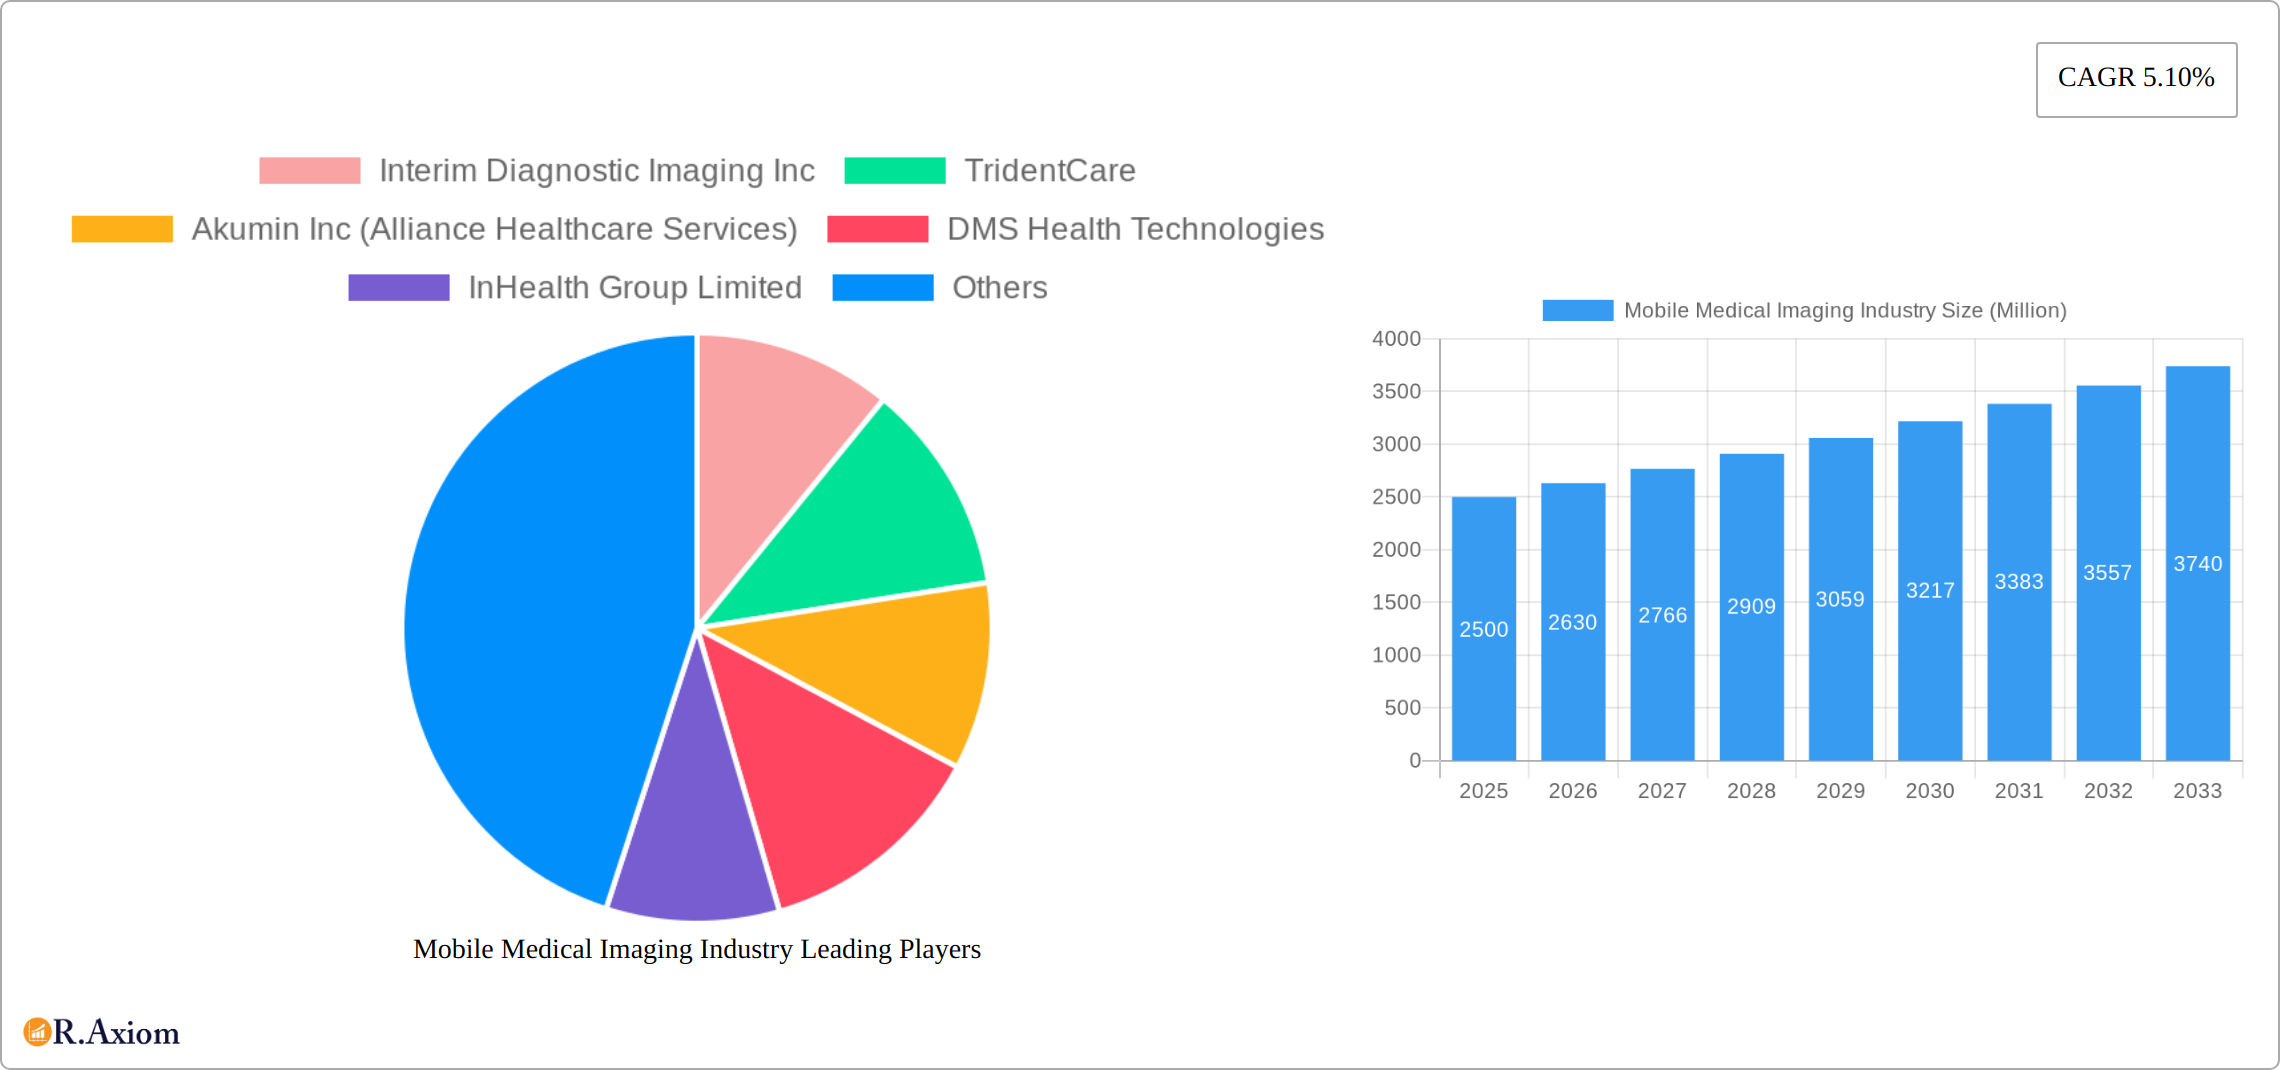
Leading Players in the Mobile Medical Imaging Industry Market
- Interim Diagnostic Imaging Inc
- TridentCare
- Akumin Inc (Alliance Healthcare Services)
- DMS Health Technologies
- InHealth Group Limited
- Star Equity Holdings (Digirad Corporation)
- Cobalt Imaging Center
- Accurate Imaging Inc
- RAYUS Radiology
- Atlantic Mobile Imaging
- MD Laboratory
- Front Range Mobile Imaging
Key Developments in Mobile Medical Imaging Industry
- April 2022: TridentCare partnered with American TelePhysicians to expand mobile X-ray and ultrasound services across the United States. This strategic partnership significantly broadened TridentCare's market reach and service offerings.
- January 2022: InHealth was recognized as a finalist in the HSJ Partnership Awards 2022 for its collaboration with the National Health Service. This highlights InHealth's commitment to delivering high-quality mobile imaging services and its strong partnerships within the healthcare sector.
Strategic Outlook for Mobile Medical Imaging Industry Market
The mobile medical imaging market is poised for continued growth, driven by technological innovation, expanding healthcare access, and rising demand for convenient diagnostic solutions. Future market potential lies in expanding into new geographical markets, developing advanced imaging technologies, and fostering strategic partnerships to enhance service delivery and market penetration. Focus on improving patient experience, incorporating AI-powered diagnostics, and addressing regulatory challenges will be crucial for success in this evolving market.
Mobile Medical Imaging Industry Segmentation
-
1. Service Type
- 1.1. X-ray
- 1.2. Ultrasound
- 1.3. Magnetic Resonance Imaging
- 1.4. PET/CT
- 1.5. Others (
-
2. End User
- 2.1. Hospitals and Private Clinics
- 2.2. Home Healthcare Service Providers
- 2.3. Others (
Mobile Medical Imaging Industry Segmentation By Geography
-
1. North America
- 1.1. United States
- 1.2. Canada
- 1.3. Mexico
-
2. Europe
- 2.1. Germany
- 2.2. United Kingdom
- 2.3. France
- 2.4. Italy
- 2.5. Spain
- 2.6. Rest of Europe
-
3. Asia Pacific
- 3.1. China
- 3.2. Japan
- 3.3. India
- 3.4. Australia
- 3.5. South Korea
- 3.6. Rest of Asia Pacific
-
4. Middle East and Africa
- 4.1. GCC
- 4.2. South Africa
- 4.3. Rest of Middle East and Africa
-
5. South America
- 5.1. Brazil
- 5.2. Argentina
- 5.3. Rest of South America

Mobile Medical Imaging Industry REPORT HIGHLIGHTS
| Aspects | Details |
|---|---|
| Study Period | 2019-2033 |
| Base Year | 2024 |
| Estimated Year | 2025 |
| Forecast Period | 2025-2033 |
| Historical Period | 2019-2024 |
| Growth Rate | CAGR of 5.10% from 2019-2033 |
| Segmentation |
|
Table of Contents
- 1. Introduction
- 1.1. Research Scope
- 1.2. Market Segmentation
- 1.3. Research Methodology
- 1.4. Definitions and Assumptions
- 2. Executive Summary
- 2.1. Introduction
- 3. Market Dynamics
- 3.1. Introduction
- 3.2. Market Drivers
- 3.2.1. Rise in Demand for Portability Medical Imaging Technology and Services; Growing Burden of Chronic Diseases
- 3.3. Market Restrains
- 3.3.1. High Cost of Mobile Set up and Imaging Equipment; Risk Associated with Radiation Exposure
- 3.4. Market Trends
- 3.4.1. X-ray Service Segment is Expected to Hold a Major Share During the Forecast Period.
- 4. Market Factor Analysis
- 4.1. Porters Five Forces
- 4.2. Supply/Value Chain
- 4.3. PESTEL analysis
- 4.4. Market Entropy
- 4.5. Patent/Trademark Analysis
- 5. Global Mobile Medical Imaging Industry Analysis, Insights and Forecast, 2019-2031
- 5.1. Market Analysis, Insights and Forecast - by Service Type
- 5.1.1. X-ray
- 5.1.2. Ultrasound
- 5.1.3. Magnetic Resonance Imaging
- 5.1.4. PET/CT
- 5.1.5. Others (
- 5.2. Market Analysis, Insights and Forecast - by End User
- 5.2.1. Hospitals and Private Clinics
- 5.2.2. Home Healthcare Service Providers
- 5.2.3. Others (
- 5.3. Market Analysis, Insights and Forecast - by Region
- 5.3.1. North America
- 5.3.2. Europe
- 5.3.3. Asia Pacific
- 5.3.4. Middle East and Africa
- 5.3.5. South America
- 5.1. Market Analysis, Insights and Forecast - by Service Type
- 6. North America Mobile Medical Imaging Industry Analysis, Insights and Forecast, 2019-2031
- 6.1. Market Analysis, Insights and Forecast - by Service Type
- 6.1.1. X-ray
- 6.1.2. Ultrasound
- 6.1.3. Magnetic Resonance Imaging
- 6.1.4. PET/CT
- 6.1.5. Others (
- 6.2. Market Analysis, Insights and Forecast - by End User
- 6.2.1. Hospitals and Private Clinics
- 6.2.2. Home Healthcare Service Providers
- 6.2.3. Others (
- 6.1. Market Analysis, Insights and Forecast - by Service Type
- 7. Europe Mobile Medical Imaging Industry Analysis, Insights and Forecast, 2019-2031
- 7.1. Market Analysis, Insights and Forecast - by Service Type
- 7.1.1. X-ray
- 7.1.2. Ultrasound
- 7.1.3. Magnetic Resonance Imaging
- 7.1.4. PET/CT
- 7.1.5. Others (
- 7.2. Market Analysis, Insights and Forecast - by End User
- 7.2.1. Hospitals and Private Clinics
- 7.2.2. Home Healthcare Service Providers
- 7.2.3. Others (
- 7.1. Market Analysis, Insights and Forecast - by Service Type
- 8. Asia Pacific Mobile Medical Imaging Industry Analysis, Insights and Forecast, 2019-2031
- 8.1. Market Analysis, Insights and Forecast - by Service Type
- 8.1.1. X-ray
- 8.1.2. Ultrasound
- 8.1.3. Magnetic Resonance Imaging
- 8.1.4. PET/CT
- 8.1.5. Others (
- 8.2. Market Analysis, Insights and Forecast - by End User
- 8.2.1. Hospitals and Private Clinics
- 8.2.2. Home Healthcare Service Providers
- 8.2.3. Others (
- 8.1. Market Analysis, Insights and Forecast - by Service Type
- 9. Middle East and Africa Mobile Medical Imaging Industry Analysis, Insights and Forecast, 2019-2031
- 9.1. Market Analysis, Insights and Forecast - by Service Type
- 9.1.1. X-ray
- 9.1.2. Ultrasound
- 9.1.3. Magnetic Resonance Imaging
- 9.1.4. PET/CT
- 9.1.5. Others (
- 9.2. Market Analysis, Insights and Forecast - by End User
- 9.2.1. Hospitals and Private Clinics
- 9.2.2. Home Healthcare Service Providers
- 9.2.3. Others (
- 9.1. Market Analysis, Insights and Forecast - by Service Type
- 10. South America Mobile Medical Imaging Industry Analysis, Insights and Forecast, 2019-2031
- 10.1. Market Analysis, Insights and Forecast - by Service Type
- 10.1.1. X-ray
- 10.1.2. Ultrasound
- 10.1.3. Magnetic Resonance Imaging
- 10.1.4. PET/CT
- 10.1.5. Others (
- 10.2. Market Analysis, Insights and Forecast - by End User
- 10.2.1. Hospitals and Private Clinics
- 10.2.2. Home Healthcare Service Providers
- 10.2.3. Others (
- 10.1. Market Analysis, Insights and Forecast - by Service Type
- 11. North America Mobile Medical Imaging Industry Analysis, Insights and Forecast, 2019-2031
- 11.1. Market Analysis, Insights and Forecast - By Country/Sub-region
- 11.1.1 United States
- 11.1.2 Canada
- 11.1.3 Mexico
- 12. Europe Mobile Medical Imaging Industry Analysis, Insights and Forecast, 2019-2031
- 12.1. Market Analysis, Insights and Forecast - By Country/Sub-region
- 12.1.1 Germany
- 12.1.2 United Kingdom
- 12.1.3 France
- 12.1.4 Italy
- 12.1.5 Spain
- 12.1.6 Rest of Europe
- 13. Asia Pacific Mobile Medical Imaging Industry Analysis, Insights and Forecast, 2019-2031
- 13.1. Market Analysis, Insights and Forecast - By Country/Sub-region
- 13.1.1 China
- 13.1.2 Japan
- 13.1.3 India
- 13.1.4 Australia
- 13.1.5 South Korea
- 13.1.6 Rest of Asia Pacific
- 14. Middle East and Africa Mobile Medical Imaging Industry Analysis, Insights and Forecast, 2019-2031
- 14.1. Market Analysis, Insights and Forecast - By Country/Sub-region
- 14.1.1 GCC
- 14.1.2 South Africa
- 14.1.3 Rest of Middle East and Africa
- 15. South America Mobile Medical Imaging Industry Analysis, Insights and Forecast, 2019-2031
- 15.1. Market Analysis, Insights and Forecast - By Country/Sub-region
- 15.1.1 Brazil
- 15.1.2 Argentina
- 15.1.3 Rest of South America
- 16. Competitive Analysis
- 16.1. Global Market Share Analysis 2024
- 16.2. Company Profiles
- 16.2.1 Interim Diagnostic Imaging Inc
- 16.2.1.1. Overview
- 16.2.1.2. Products
- 16.2.1.3. SWOT Analysis
- 16.2.1.4. Recent Developments
- 16.2.1.5. Financials (Based on Availability)
- 16.2.2 TridentCare
- 16.2.2.1. Overview
- 16.2.2.2. Products
- 16.2.2.3. SWOT Analysis
- 16.2.2.4. Recent Developments
- 16.2.2.5. Financials (Based on Availability)
- 16.2.3 Akumin Inc (Alliance Healthcare Services)
- 16.2.3.1. Overview
- 16.2.3.2. Products
- 16.2.3.3. SWOT Analysis
- 16.2.3.4. Recent Developments
- 16.2.3.5. Financials (Based on Availability)
- 16.2.4 DMS Health Technologies
- 16.2.4.1. Overview
- 16.2.4.2. Products
- 16.2.4.3. SWOT Analysis
- 16.2.4.4. Recent Developments
- 16.2.4.5. Financials (Based on Availability)
- 16.2.5 InHealth Group Limited
- 16.2.5.1. Overview
- 16.2.5.2. Products
- 16.2.5.3. SWOT Analysis
- 16.2.5.4. Recent Developments
- 16.2.5.5. Financials (Based on Availability)
- 16.2.6 Star Equity Holdings (Digirad Corporation)
- 16.2.6.1. Overview
- 16.2.6.2. Products
- 16.2.6.3. SWOT Analysis
- 16.2.6.4. Recent Developments
- 16.2.6.5. Financials (Based on Availability)
- 16.2.7 Cobalt Imaging Center
- 16.2.7.1. Overview
- 16.2.7.2. Products
- 16.2.7.3. SWOT Analysis
- 16.2.7.4. Recent Developments
- 16.2.7.5. Financials (Based on Availability)
- 16.2.8 Accurate Imaging Inc
- 16.2.8.1. Overview
- 16.2.8.2. Products
- 16.2.8.3. SWOT Analysis
- 16.2.8.4. Recent Developments
- 16.2.8.5. Financials (Based on Availability)
- 16.2.9 RAYUS Radiology
- 16.2.9.1. Overview
- 16.2.9.2. Products
- 16.2.9.3. SWOT Analysis
- 16.2.9.4. Recent Developments
- 16.2.9.5. Financials (Based on Availability)
- 16.2.10 Atlantic Mobile Imaging
- 16.2.10.1. Overview
- 16.2.10.2. Products
- 16.2.10.3. SWOT Analysis
- 16.2.10.4. Recent Developments
- 16.2.10.5. Financials (Based on Availability)
- 16.2.11 MD Laboratory*List Not Exhaustive
- 16.2.11.1. Overview
- 16.2.11.2. Products
- 16.2.11.3. SWOT Analysis
- 16.2.11.4. Recent Developments
- 16.2.11.5. Financials (Based on Availability)
- 16.2.12 Front Range Mobile Imaging
- 16.2.12.1. Overview
- 16.2.12.2. Products
- 16.2.12.3. SWOT Analysis
- 16.2.12.4. Recent Developments
- 16.2.12.5. Financials (Based on Availability)
- 16.2.1 Interim Diagnostic Imaging Inc
List of Figures
- Figure 1: Global Mobile Medical Imaging Industry Revenue Breakdown (Million, %) by Region 2024 & 2032
- Figure 2: North America Mobile Medical Imaging Industry Revenue (Million), by Country 2024 & 2032
- Figure 3: North America Mobile Medical Imaging Industry Revenue Share (%), by Country 2024 & 2032
- Figure 4: Europe Mobile Medical Imaging Industry Revenue (Million), by Country 2024 & 2032
- Figure 5: Europe Mobile Medical Imaging Industry Revenue Share (%), by Country 2024 & 2032
- Figure 6: Asia Pacific Mobile Medical Imaging Industry Revenue (Million), by Country 2024 & 2032
- Figure 7: Asia Pacific Mobile Medical Imaging Industry Revenue Share (%), by Country 2024 & 2032
- Figure 8: Middle East and Africa Mobile Medical Imaging Industry Revenue (Million), by Country 2024 & 2032
- Figure 9: Middle East and Africa Mobile Medical Imaging Industry Revenue Share (%), by Country 2024 & 2032
- Figure 10: South America Mobile Medical Imaging Industry Revenue (Million), by Country 2024 & 2032
- Figure 11: South America Mobile Medical Imaging Industry Revenue Share (%), by Country 2024 & 2032
- Figure 12: North America Mobile Medical Imaging Industry Revenue (Million), by Service Type 2024 & 2032
- Figure 13: North America Mobile Medical Imaging Industry Revenue Share (%), by Service Type 2024 & 2032
- Figure 14: North America Mobile Medical Imaging Industry Revenue (Million), by End User 2024 & 2032
- Figure 15: North America Mobile Medical Imaging Industry Revenue Share (%), by End User 2024 & 2032
- Figure 16: North America Mobile Medical Imaging Industry Revenue (Million), by Country 2024 & 2032
- Figure 17: North America Mobile Medical Imaging Industry Revenue Share (%), by Country 2024 & 2032
- Figure 18: Europe Mobile Medical Imaging Industry Revenue (Million), by Service Type 2024 & 2032
- Figure 19: Europe Mobile Medical Imaging Industry Revenue Share (%), by Service Type 2024 & 2032
- Figure 20: Europe Mobile Medical Imaging Industry Revenue (Million), by End User 2024 & 2032
- Figure 21: Europe Mobile Medical Imaging Industry Revenue Share (%), by End User 2024 & 2032
- Figure 22: Europe Mobile Medical Imaging Industry Revenue (Million), by Country 2024 & 2032
- Figure 23: Europe Mobile Medical Imaging Industry Revenue Share (%), by Country 2024 & 2032
- Figure 24: Asia Pacific Mobile Medical Imaging Industry Revenue (Million), by Service Type 2024 & 2032
- Figure 25: Asia Pacific Mobile Medical Imaging Industry Revenue Share (%), by Service Type 2024 & 2032
- Figure 26: Asia Pacific Mobile Medical Imaging Industry Revenue (Million), by End User 2024 & 2032
- Figure 27: Asia Pacific Mobile Medical Imaging Industry Revenue Share (%), by End User 2024 & 2032
- Figure 28: Asia Pacific Mobile Medical Imaging Industry Revenue (Million), by Country 2024 & 2032
- Figure 29: Asia Pacific Mobile Medical Imaging Industry Revenue Share (%), by Country 2024 & 2032
- Figure 30: Middle East and Africa Mobile Medical Imaging Industry Revenue (Million), by Service Type 2024 & 2032
- Figure 31: Middle East and Africa Mobile Medical Imaging Industry Revenue Share (%), by Service Type 2024 & 2032
- Figure 32: Middle East and Africa Mobile Medical Imaging Industry Revenue (Million), by End User 2024 & 2032
- Figure 33: Middle East and Africa Mobile Medical Imaging Industry Revenue Share (%), by End User 2024 & 2032
- Figure 34: Middle East and Africa Mobile Medical Imaging Industry Revenue (Million), by Country 2024 & 2032
- Figure 35: Middle East and Africa Mobile Medical Imaging Industry Revenue Share (%), by Country 2024 & 2032
- Figure 36: South America Mobile Medical Imaging Industry Revenue (Million), by Service Type 2024 & 2032
- Figure 37: South America Mobile Medical Imaging Industry Revenue Share (%), by Service Type 2024 & 2032
- Figure 38: South America Mobile Medical Imaging Industry Revenue (Million), by End User 2024 & 2032
- Figure 39: South America Mobile Medical Imaging Industry Revenue Share (%), by End User 2024 & 2032
- Figure 40: South America Mobile Medical Imaging Industry Revenue (Million), by Country 2024 & 2032
- Figure 41: South America Mobile Medical Imaging Industry Revenue Share (%), by Country 2024 & 2032
List of Tables
- Table 1: Global Mobile Medical Imaging Industry Revenue Million Forecast, by Region 2019 & 2032
- Table 2: Global Mobile Medical Imaging Industry Revenue Million Forecast, by Service Type 2019 & 2032
- Table 3: Global Mobile Medical Imaging Industry Revenue Million Forecast, by End User 2019 & 2032
- Table 4: Global Mobile Medical Imaging Industry Revenue Million Forecast, by Region 2019 & 2032
- Table 5: Global Mobile Medical Imaging Industry Revenue Million Forecast, by Country 2019 & 2032
- Table 6: United States Mobile Medical Imaging Industry Revenue (Million) Forecast, by Application 2019 & 2032
- Table 7: Canada Mobile Medical Imaging Industry Revenue (Million) Forecast, by Application 2019 & 2032
- Table 8: Mexico Mobile Medical Imaging Industry Revenue (Million) Forecast, by Application 2019 & 2032
- Table 9: Global Mobile Medical Imaging Industry Revenue Million Forecast, by Country 2019 & 2032
- Table 10: Germany Mobile Medical Imaging Industry Revenue (Million) Forecast, by Application 2019 & 2032
- Table 11: United Kingdom Mobile Medical Imaging Industry Revenue (Million) Forecast, by Application 2019 & 2032
- Table 12: France Mobile Medical Imaging Industry Revenue (Million) Forecast, by Application 2019 & 2032
- Table 13: Italy Mobile Medical Imaging Industry Revenue (Million) Forecast, by Application 2019 & 2032
- Table 14: Spain Mobile Medical Imaging Industry Revenue (Million) Forecast, by Application 2019 & 2032
- Table 15: Rest of Europe Mobile Medical Imaging Industry Revenue (Million) Forecast, by Application 2019 & 2032
- Table 16: Global Mobile Medical Imaging Industry Revenue Million Forecast, by Country 2019 & 2032
- Table 17: China Mobile Medical Imaging Industry Revenue (Million) Forecast, by Application 2019 & 2032
- Table 18: Japan Mobile Medical Imaging Industry Revenue (Million) Forecast, by Application 2019 & 2032
- Table 19: India Mobile Medical Imaging Industry Revenue (Million) Forecast, by Application 2019 & 2032
- Table 20: Australia Mobile Medical Imaging Industry Revenue (Million) Forecast, by Application 2019 & 2032
- Table 21: South Korea Mobile Medical Imaging Industry Revenue (Million) Forecast, by Application 2019 & 2032
- Table 22: Rest of Asia Pacific Mobile Medical Imaging Industry Revenue (Million) Forecast, by Application 2019 & 2032
- Table 23: Global Mobile Medical Imaging Industry Revenue Million Forecast, by Country 2019 & 2032
- Table 24: GCC Mobile Medical Imaging Industry Revenue (Million) Forecast, by Application 2019 & 2032
- Table 25: South Africa Mobile Medical Imaging Industry Revenue (Million) Forecast, by Application 2019 & 2032
- Table 26: Rest of Middle East and Africa Mobile Medical Imaging Industry Revenue (Million) Forecast, by Application 2019 & 2032
- Table 27: Global Mobile Medical Imaging Industry Revenue Million Forecast, by Country 2019 & 2032
- Table 28: Brazil Mobile Medical Imaging Industry Revenue (Million) Forecast, by Application 2019 & 2032
- Table 29: Argentina Mobile Medical Imaging Industry Revenue (Million) Forecast, by Application 2019 & 2032
- Table 30: Rest of South America Mobile Medical Imaging Industry Revenue (Million) Forecast, by Application 2019 & 2032
- Table 31: Global Mobile Medical Imaging Industry Revenue Million Forecast, by Service Type 2019 & 2032
- Table 32: Global Mobile Medical Imaging Industry Revenue Million Forecast, by End User 2019 & 2032
- Table 33: Global Mobile Medical Imaging Industry Revenue Million Forecast, by Country 2019 & 2032
- Table 34: United States Mobile Medical Imaging Industry Revenue (Million) Forecast, by Application 2019 & 2032
- Table 35: Canada Mobile Medical Imaging Industry Revenue (Million) Forecast, by Application 2019 & 2032
- Table 36: Mexico Mobile Medical Imaging Industry Revenue (Million) Forecast, by Application 2019 & 2032
- Table 37: Global Mobile Medical Imaging Industry Revenue Million Forecast, by Service Type 2019 & 2032
- Table 38: Global Mobile Medical Imaging Industry Revenue Million Forecast, by End User 2019 & 2032
- Table 39: Global Mobile Medical Imaging Industry Revenue Million Forecast, by Country 2019 & 2032
- Table 40: Germany Mobile Medical Imaging Industry Revenue (Million) Forecast, by Application 2019 & 2032
- Table 41: United Kingdom Mobile Medical Imaging Industry Revenue (Million) Forecast, by Application 2019 & 2032
- Table 42: France Mobile Medical Imaging Industry Revenue (Million) Forecast, by Application 2019 & 2032
- Table 43: Italy Mobile Medical Imaging Industry Revenue (Million) Forecast, by Application 2019 & 2032
- Table 44: Spain Mobile Medical Imaging Industry Revenue (Million) Forecast, by Application 2019 & 2032
- Table 45: Rest of Europe Mobile Medical Imaging Industry Revenue (Million) Forecast, by Application 2019 & 2032
- Table 46: Global Mobile Medical Imaging Industry Revenue Million Forecast, by Service Type 2019 & 2032
- Table 47: Global Mobile Medical Imaging Industry Revenue Million Forecast, by End User 2019 & 2032
- Table 48: Global Mobile Medical Imaging Industry Revenue Million Forecast, by Country 2019 & 2032
- Table 49: China Mobile Medical Imaging Industry Revenue (Million) Forecast, by Application 2019 & 2032
- Table 50: Japan Mobile Medical Imaging Industry Revenue (Million) Forecast, by Application 2019 & 2032
- Table 51: India Mobile Medical Imaging Industry Revenue (Million) Forecast, by Application 2019 & 2032
- Table 52: Australia Mobile Medical Imaging Industry Revenue (Million) Forecast, by Application 2019 & 2032
- Table 53: South Korea Mobile Medical Imaging Industry Revenue (Million) Forecast, by Application 2019 & 2032
- Table 54: Rest of Asia Pacific Mobile Medical Imaging Industry Revenue (Million) Forecast, by Application 2019 & 2032
- Table 55: Global Mobile Medical Imaging Industry Revenue Million Forecast, by Service Type 2019 & 2032
- Table 56: Global Mobile Medical Imaging Industry Revenue Million Forecast, by End User 2019 & 2032
- Table 57: Global Mobile Medical Imaging Industry Revenue Million Forecast, by Country 2019 & 2032
- Table 58: GCC Mobile Medical Imaging Industry Revenue (Million) Forecast, by Application 2019 & 2032
- Table 59: South Africa Mobile Medical Imaging Industry Revenue (Million) Forecast, by Application 2019 & 2032
- Table 60: Rest of Middle East and Africa Mobile Medical Imaging Industry Revenue (Million) Forecast, by Application 2019 & 2032
- Table 61: Global Mobile Medical Imaging Industry Revenue Million Forecast, by Service Type 2019 & 2032
- Table 62: Global Mobile Medical Imaging Industry Revenue Million Forecast, by End User 2019 & 2032
- Table 63: Global Mobile Medical Imaging Industry Revenue Million Forecast, by Country 2019 & 2032
- Table 64: Brazil Mobile Medical Imaging Industry Revenue (Million) Forecast, by Application 2019 & 2032
- Table 65: Argentina Mobile Medical Imaging Industry Revenue (Million) Forecast, by Application 2019 & 2032
- Table 66: Rest of South America Mobile Medical Imaging Industry Revenue (Million) Forecast, by Application 2019 & 2032
Frequently Asked Questions
1. What is the projected Compound Annual Growth Rate (CAGR) of the Mobile Medical Imaging Industry?
The projected CAGR is approximately 5.10%.
2. Which companies are prominent players in the Mobile Medical Imaging Industry?
Key companies in the market include Interim Diagnostic Imaging Inc, TridentCare, Akumin Inc (Alliance Healthcare Services), DMS Health Technologies, InHealth Group Limited, Star Equity Holdings (Digirad Corporation), Cobalt Imaging Center, Accurate Imaging Inc, RAYUS Radiology, Atlantic Mobile Imaging, MD Laboratory*List Not Exhaustive, Front Range Mobile Imaging.
3. What are the main segments of the Mobile Medical Imaging Industry?
The market segments include Service Type, End User.
4. Can you provide details about the market size?
The market size is estimated to be USD XX Million as of 2022.
5. What are some drivers contributing to market growth?
Rise in Demand for Portability Medical Imaging Technology and Services; Growing Burden of Chronic Diseases.
6. What are the notable trends driving market growth?
X-ray Service Segment is Expected to Hold a Major Share During the Forecast Period..
7. Are there any restraints impacting market growth?
High Cost of Mobile Set up and Imaging Equipment; Risk Associated with Radiation Exposure.
8. Can you provide examples of recent developments in the market?
In April 2022, TridentCare, a key portable diagnostic services provider has entered a new partnership with American TelePhysicians to provide mobile X-ray and ultrasound services throughout the United States.
9. What pricing options are available for accessing the report?
Pricing options include single-user, multi-user, and enterprise licenses priced at USD 4750, USD 5250, and USD 8750 respectively.
10. Is the market size provided in terms of value or volume?
The market size is provided in terms of value, measured in Million.
11. Are there any specific market keywords associated with the report?
Yes, the market keyword associated with the report is "Mobile Medical Imaging Industry," which aids in identifying and referencing the specific market segment covered.
12. How do I determine which pricing option suits my needs best?
The pricing options vary based on user requirements and access needs. Individual users may opt for single-user licenses, while businesses requiring broader access may choose multi-user or enterprise licenses for cost-effective access to the report.
13. Are there any additional resources or data provided in the Mobile Medical Imaging Industry report?
While the report offers comprehensive insights, it's advisable to review the specific contents or supplementary materials provided to ascertain if additional resources or data are available.
14. How can I stay updated on further developments or reports in the Mobile Medical Imaging Industry?
To stay informed about further developments, trends, and reports in the Mobile Medical Imaging Industry, consider subscribing to industry newsletters, following relevant companies and organizations, or regularly checking reputable industry news sources and publications.
Methodology
Step 1 - Identification of Relevant Samples Size from Population Database


Step 2 - Approaches for Defining Global Market Size (Value, Volume* & Price*)

Note*: In applicable scenarios
Step 3 - Data Sources
Primary Research
- Web Analytics
- Survey Reports
- Research Institute
- Latest Research Reports
- Opinion Leaders
Secondary Research
- Annual Reports
- White Paper
- Latest Press Release
- Industry Association
- Paid Database
- Investor Presentations

Step 4 - Data Triangulation
Involves using different sources of information in order to increase the validity of a study
These sources are likely to be stakeholders in a program - participants, other researchers, program staff, other community members, and so on.
Then we put all data in single framework & apply various statistical tools to find out the dynamic on the market.
During the analysis stage, feedback from the stakeholder groups would be compared to determine areas of agreement as well as areas of divergence


