
Key Insights
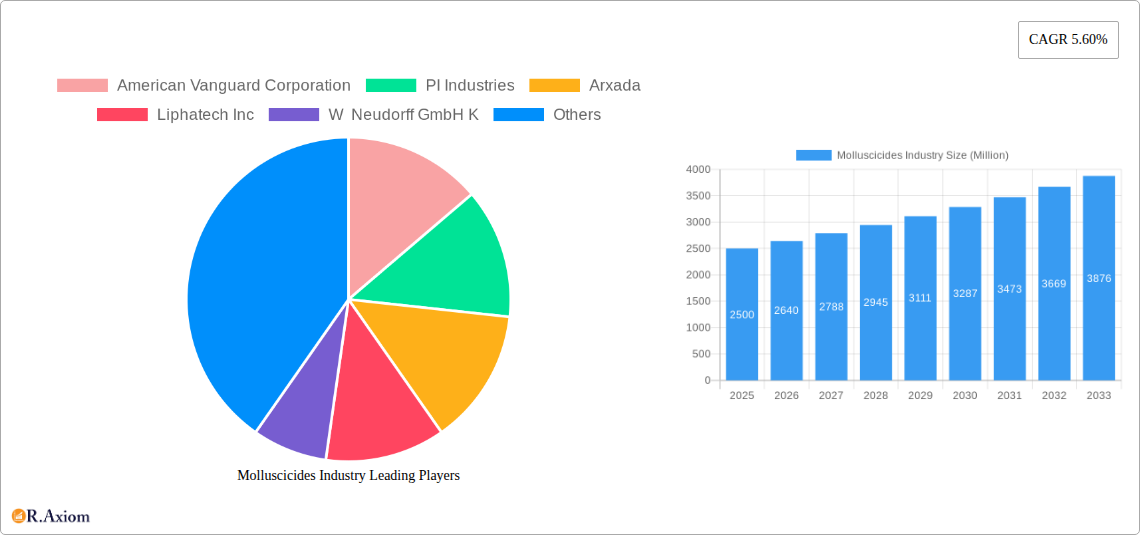
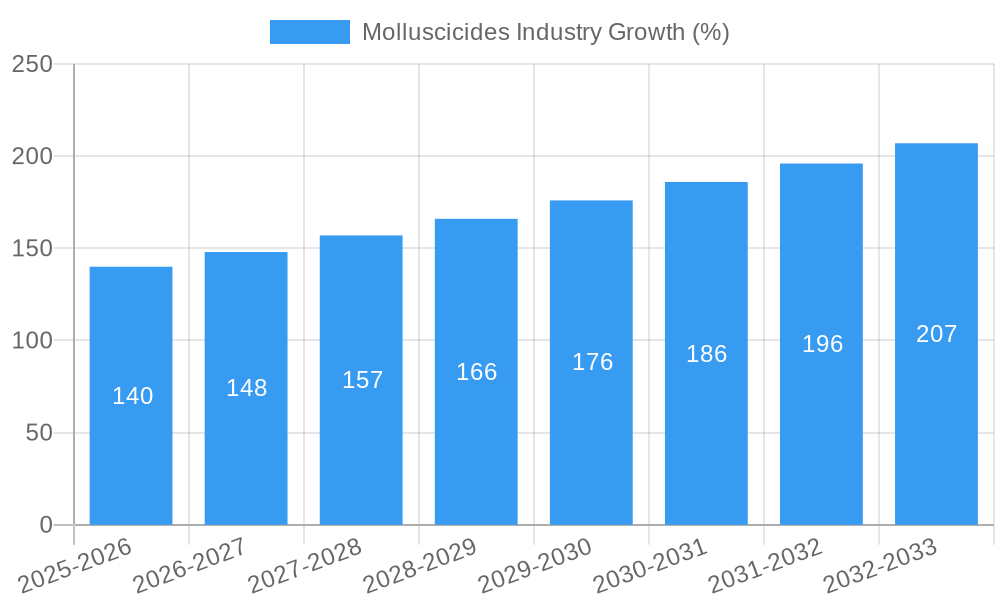
The global molluscicides market, valued at approximately $XX million in 2025, is projected to experience robust growth, driven by a Compound Annual Growth Rate (CAGR) of 5.60% from 2025 to 2033. This expansion is fueled by several key factors. Increased agricultural intensification and the rising demand for high-yield crops are creating a greater need for effective pest control solutions. The prevalence of mollusks as significant agricultural pests, causing considerable damage to crops like fruits, vegetables, grains, and pulses, is a significant driver. Furthermore, the growing awareness of the negative impacts of mollusk infestations on commercial crops and ornamental turf is encouraging wider adoption of molluscicides. The market is segmented by application mode (chemigation, foliar, fumigation, soil treatment) and crop type (commercial crops, fruits & vegetables, grains & cereals, pulses & oilseeds, turf & ornamental), offering diverse opportunities for manufacturers. The leading players, including American Vanguard Corporation, PI Industries, Arxada, Liphatech Inc, W Neudorff GmbH K, Mitsui & Co Ltd (Certis Belchim), UPL Limited, and Nufarm Ltd, are actively involved in research and development, focusing on the development of more effective and environmentally friendly molluscicides to meet the growing demand.
However, market growth is not without challenges. Stringent regulations concerning pesticide use and the increasing focus on sustainable agriculture practices are imposing constraints. The development and implementation of integrated pest management (IPM) strategies, which prioritize preventive measures and biological control methods, are influencing the demand for chemical molluscicides. Furthermore, price fluctuations in raw materials and the potential for resistance development in mollusk populations pose significant hurdles for manufacturers. Despite these challenges, the market's continued growth trajectory is anticipated due to the persistent need for effective mollusk control in agriculture and horticulture, coupled with ongoing innovations in product development and formulation. The market's future will be shaped by advancements in environmentally friendly formulations, targeted delivery systems, and sustainable agricultural practices.
Molluscicides Industry: A Comprehensive Market Report (2019-2033)
This detailed report provides a comprehensive analysis of the Molluscicides industry, offering invaluable insights for stakeholders, investors, and industry professionals. The study period spans 2019-2033, with 2025 serving as the base and estimated year. The forecast period covers 2025-2033, while the historical period encompasses 2019-2024. The report utilizes a rigorous methodology to provide accurate market sizing and forecasts, valuing the market in Millions.
Molluscicides Industry Market Concentration & Innovation
This section analyzes the competitive landscape of the molluscicides market, encompassing market concentration, innovation drivers, regulatory frameworks, product substitutes, end-user trends, and merger & acquisition (M&A) activities. Key players like American Vanguard Corporation, PI Industries, Arxada, Liphatech Inc, W Neudorff GmbH K, Mitsui & Co Ltd (Certis Belchim), UPL Limited, and Nufarm Ltd. shape the market dynamics. Market share analysis reveals a moderately concentrated market, with the top five players holding approximately xx% of the global market share in 2024. Innovation is driven by the need for more effective, environmentally friendly, and cost-effective molluscicides, leading to ongoing research and development in novel formulations and application methods. Stringent regulatory frameworks, varying across different geographies, significantly influence product development and market access. The rise of bio-based molluscicides presents a viable substitute, slowly gaining traction, particularly in ecologically conscious markets. End-user trends reflect a growing awareness of sustainable agriculture, pushing demand for environmentally benign products. Recent M&A activity, with notable deals like the Certis Belchim acquisitions detailed later, signifies industry consolidation and strategic expansion. The total value of M&A deals within the industry during the historical period reached approximately $xx Million.
Molluscicides Industry Industry Trends & Insights
The global molluscicides market is projected to exhibit a Compound Annual Growth Rate (CAGR) of xx% during the forecast period (2025-2033). This growth is fueled by several key factors. Increasing incidences of crop damage due to mollusk infestations, particularly in high-value commercial crops and horticulture, are driving demand for effective control measures. Growing adoption of integrated pest management (IPM) strategies, which incorporate molluscicides as a crucial component, further contributes to market expansion. Technological advancements, such as the development of more targeted and efficient molluscicidal formulations, enhance the efficacy and reduce the environmental footprint of these products. Changing consumer preferences for safer and environmentally friendly agricultural practices are pushing manufacturers to develop bio-based and less toxic alternatives. Competitive dynamics are characterized by intense rivalry among established players, coupled with the emergence of new entrants focusing on sustainable and innovative solutions. Market penetration is expected to increase significantly, especially in developing economies with burgeoning agricultural sectors. The increasing adoption of advanced technologies, like precision application, further contributes to the growth trajectory.
Dominant Markets & Segments in Molluscicides Industry
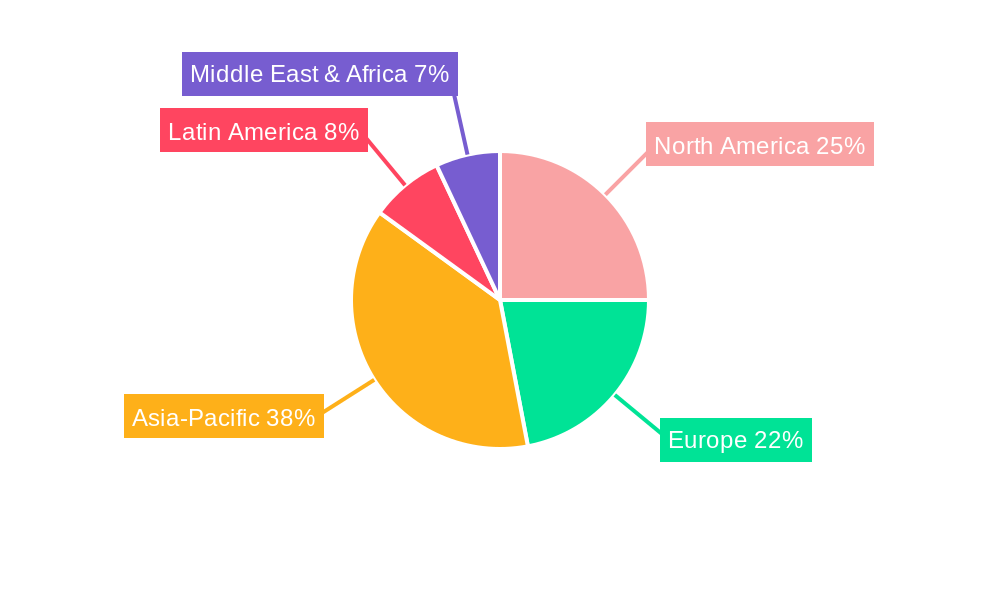
The Molluscicides market exhibits regional variations in dominance, with xx being the leading region, accounting for approximately xx% of the global market share in 2024. This dominance stems from factors such as extensive agricultural land, high crop production, favorable government policies promoting agricultural development, and robust infrastructure supporting pesticide distribution. Within application modes, soil treatment holds the largest market share in 2024, attributed to its effectiveness and compatibility with various crop types. Among crop types, fruits and vegetables command the highest segmental share due to the high economic value and susceptibility to mollusk damage. Key drivers for these segments include:
- Fruits & Vegetables: High crop value, vulnerability to mollusk infestations, and stringent quality standards drive demand for effective molluscicides.
- Soil Treatment: Efficacy in controlling soil-dwelling mollusks and compatibility with various crops contribute to its popularity.
- xx Region: Favorable climatic conditions, large agricultural land area, and government support foster significant market growth.
Molluscicides Industry Product Developments
Recent years have witnessed significant advancements in molluscicides, with a focus on developing products with improved efficacy, reduced environmental impact, and enhanced safety profiles. Innovations include novel formulations utilizing biodegradable carriers, targeted delivery systems minimizing non-target effects, and the incorporation of biopesticides. These innovations cater to growing consumer preferences for sustainable and eco-friendly pest management solutions. Products with superior efficacy, lower application rates, and extended residual activity provide distinct competitive advantages.
Report Scope & Segmentation Analysis
This report segments the molluscicides market based on application mode (Chemigation, Foliar, Fumigation, Soil Treatment) and crop type (Commercial Crops, Fruits & Vegetables, Grains & Cereals, Pulses & Oilseeds, Turf & Ornamental). Each segment is analyzed for its market size, growth projections, and competitive dynamics.
Application Mode: Each mode possesses unique advantages and market characteristics, with soil treatment currently dominant, followed by foliar application. Growth projections vary depending on technological advancements and agricultural practices.
Crop Type: Fruits and vegetables segment represents the largest share, driven by high value crops and susceptibility to damage. Grains and cereals also represent a significant portion of the market, although the overall growth rate might be slower than other segments.
Key Drivers of Molluscicides Industry Growth
Several factors contribute to the growth of the molluscicides market. The increasing prevalence of mollusk infestations in agricultural fields, driven by changing climatic conditions and agricultural practices, is a primary driver. The rising demand for high-quality food products and the need to minimize crop losses further fuels market expansion. Government initiatives and regulations promoting sustainable agriculture also play a role. Technological advancements in formulation and application technologies contribute to improved efficacy and reduced environmental impact, thereby enhancing market appeal.
Challenges in the Molluscicides Industry Sector
The molluscicides industry faces various challenges, including stringent regulatory approvals and evolving environmental concerns leading to extended product development timelines and increased costs. Fluctuations in raw material prices and supply chain disruptions can impact production costs and profitability. Intense competition among established players and the emergence of new entrants create pressure on pricing and market share. The development and adoption of resistance by target pests also pose a significant challenge, necessitating the continuous development of new and effective molluscicides.
Emerging Opportunities in Molluscicides Industry
The industry presents several promising opportunities. The increasing adoption of precision agriculture and the development of targeted delivery systems create opportunities for specialized molluscicides. The growing demand for bio-based and environmentally benign alternatives opens avenues for innovative product development and market penetration. Expanding into new geographic markets, particularly in developing countries with rapidly growing agricultural sectors, presents significant potential for growth. Further research and development into effective and sustainable mollusk control strategies will be key.
Leading Players in the Molluscicides Industry Market
- American Vanguard Corporation
- PI Industries
- Arxada
- Liphatech Inc
- W Neudorff GmbH K
- Mitsui & Co Ltd (Certis Belchim)
- UPL Limited
- Nufarm Ltd
Key Developments in Molluscicides Industry Industry
- June 2021: Belchim Crop Protection was fully acquired by Mitsui & Co. Ltd. This acquisition strengthened Mitsui's position in the European crop protection market.
- March 2022: Certis Belchim BV was formed through the merger of Belchim Crop Protection and Certis Europe, further consolidating Mitsui's market presence.
- November 2022: Certis Belchim BV acquired the assets of Henry Manufacturing Limited, expanding its portfolio of crop protection products.
Strategic Outlook for Molluscicides Industry Market
The molluscicides market exhibits strong growth potential driven by persistent mollusk infestations, evolving agricultural practices, and the increasing demand for high-quality, safe food products. Innovation in formulation, application technology, and the development of sustainable and effective alternatives will shape future market dynamics. Companies that successfully adapt to changing regulatory landscapes and consumer preferences are expected to gain a competitive edge. Strategic partnerships, acquisitions, and investments in research and development will be crucial for sustained growth and profitability.
Molluscicides Industry Segmentation
- 1. Production Analysis
- 2. Consumption Analysis
- 3. Import Market Analysis (Value & Volume)
- 4. Export Market Analysis (Value & Volume)
- 5. Price Trend Analysis
Molluscicides Industry Segmentation By Geography
-
1. North America
- 1.1. United States
- 1.2. Canada
- 1.3. Mexico
-
2. South America
- 2.1. Brazil
- 2.2. Argentina
- 2.3. Rest of South America
-
3. Europe
- 3.1. United Kingdom
- 3.2. Germany
- 3.3. France
- 3.4. Italy
- 3.5. Spain
- 3.6. Russia
- 3.7. Benelux
- 3.8. Nordics
- 3.9. Rest of Europe
-
4. Middle East & Africa
- 4.1. Turkey
- 4.2. Israel
- 4.3. GCC
- 4.4. North Africa
- 4.5. South Africa
- 4.6. Rest of Middle East & Africa
-
5. Asia Pacific
- 5.1. China
- 5.2. India
- 5.3. Japan
- 5.4. South Korea
- 5.5. ASEAN
- 5.6. Oceania
- 5.7. Rest of Asia Pacific
Molluscicides Industry REPORT HIGHLIGHTS
| Aspects | Details |
|---|---|
| Study Period | 2019-2033 |
| Base Year | 2024 |
| Estimated Year | 2025 |
| Forecast Period | 2025-2033 |
| Historical Period | 2019-2024 |
| Growth Rate | CAGR of 5.60% from 2019-2033 |
| Segmentation |
|
Table of Contents
- 1. Introduction
- 1.1. Research Scope
- 1.2. Market Segmentation
- 1.3. Research Methodology
- 1.4. Definitions and Assumptions
- 2. Executive Summary
- 2.1. Introduction
- 3. Market Dynamics
- 3.1. Introduction
- 3.2. Market Drivers
- 3.2.1. Seed Treatment As A Solution To Enhance Yield; Growing Awareness For Seed Treatment Among The Farmers; Rising Trend Of Organic Farming
- 3.3. Market Restrains
- 3.3.1. Limitations Across Farm-Level Seed Treatment; Rising Environmental Concerns
- 3.4. Market Trends
- 3.4.1. South America dominated the global molluscicide market
- 4. Market Factor Analysis
- 4.1. Porters Five Forces
- 4.2. Supply/Value Chain
- 4.3. PESTEL analysis
- 4.4. Market Entropy
- 4.5. Patent/Trademark Analysis
- 5. Global Molluscicides Industry Analysis, Insights and Forecast, 2019-2031
- 5.1. Market Analysis, Insights and Forecast - by Production Analysis
- 5.2. Market Analysis, Insights and Forecast - by Consumption Analysis
- 5.3. Market Analysis, Insights and Forecast - by Import Market Analysis (Value & Volume)
- 5.4. Market Analysis, Insights and Forecast - by Export Market Analysis (Value & Volume)
- 5.5. Market Analysis, Insights and Forecast - by Price Trend Analysis
- 5.6. Market Analysis, Insights and Forecast - by Region
- 5.6.1. North America
- 5.6.2. South America
- 5.6.3. Europe
- 5.6.4. Middle East & Africa
- 5.6.5. Asia Pacific
- 5.1. Market Analysis, Insights and Forecast - by Production Analysis
- 6. North America Molluscicides Industry Analysis, Insights and Forecast, 2019-2031
- 6.1. Market Analysis, Insights and Forecast - by Production Analysis
- 6.2. Market Analysis, Insights and Forecast - by Consumption Analysis
- 6.3. Market Analysis, Insights and Forecast - by Import Market Analysis (Value & Volume)
- 6.4. Market Analysis, Insights and Forecast - by Export Market Analysis (Value & Volume)
- 6.5. Market Analysis, Insights and Forecast - by Price Trend Analysis
- 6.1. Market Analysis, Insights and Forecast - by Production Analysis
- 7. South America Molluscicides Industry Analysis, Insights and Forecast, 2019-2031
- 7.1. Market Analysis, Insights and Forecast - by Production Analysis
- 7.2. Market Analysis, Insights and Forecast - by Consumption Analysis
- 7.3. Market Analysis, Insights and Forecast - by Import Market Analysis (Value & Volume)
- 7.4. Market Analysis, Insights and Forecast - by Export Market Analysis (Value & Volume)
- 7.5. Market Analysis, Insights and Forecast - by Price Trend Analysis
- 7.1. Market Analysis, Insights and Forecast - by Production Analysis
- 8. Europe Molluscicides Industry Analysis, Insights and Forecast, 2019-2031
- 8.1. Market Analysis, Insights and Forecast - by Production Analysis
- 8.2. Market Analysis, Insights and Forecast - by Consumption Analysis
- 8.3. Market Analysis, Insights and Forecast - by Import Market Analysis (Value & Volume)
- 8.4. Market Analysis, Insights and Forecast - by Export Market Analysis (Value & Volume)
- 8.5. Market Analysis, Insights and Forecast - by Price Trend Analysis
- 8.1. Market Analysis, Insights and Forecast - by Production Analysis
- 9. Middle East & Africa Molluscicides Industry Analysis, Insights and Forecast, 2019-2031
- 9.1. Market Analysis, Insights and Forecast - by Production Analysis
- 9.2. Market Analysis, Insights and Forecast - by Consumption Analysis
- 9.3. Market Analysis, Insights and Forecast - by Import Market Analysis (Value & Volume)
- 9.4. Market Analysis, Insights and Forecast - by Export Market Analysis (Value & Volume)
- 9.5. Market Analysis, Insights and Forecast - by Price Trend Analysis
- 9.1. Market Analysis, Insights and Forecast - by Production Analysis
- 10. Asia Pacific Molluscicides Industry Analysis, Insights and Forecast, 2019-2031
- 10.1. Market Analysis, Insights and Forecast - by Production Analysis
- 10.2. Market Analysis, Insights and Forecast - by Consumption Analysis
- 10.3. Market Analysis, Insights and Forecast - by Import Market Analysis (Value & Volume)
- 10.4. Market Analysis, Insights and Forecast - by Export Market Analysis (Value & Volume)
- 10.5. Market Analysis, Insights and Forecast - by Price Trend Analysis
- 10.1. Market Analysis, Insights and Forecast - by Production Analysis
- 11. Competitive Analysis
- 11.1. Global Market Share Analysis 2024
- 11.2. Company Profiles
- 11.2.1 American Vanguard Corporation
- 11.2.1.1. Overview
- 11.2.1.2. Products
- 11.2.1.3. SWOT Analysis
- 11.2.1.4. Recent Developments
- 11.2.1.5. Financials (Based on Availability)
- 11.2.2 PI Industries
- 11.2.2.1. Overview
- 11.2.2.2. Products
- 11.2.2.3. SWOT Analysis
- 11.2.2.4. Recent Developments
- 11.2.2.5. Financials (Based on Availability)
- 11.2.3 Arxada
- 11.2.3.1. Overview
- 11.2.3.2. Products
- 11.2.3.3. SWOT Analysis
- 11.2.3.4. Recent Developments
- 11.2.3.5. Financials (Based on Availability)
- 11.2.4 Liphatech Inc
- 11.2.4.1. Overview
- 11.2.4.2. Products
- 11.2.4.3. SWOT Analysis
- 11.2.4.4. Recent Developments
- 11.2.4.5. Financials (Based on Availability)
- 11.2.5 W Neudorff GmbH K
- 11.2.5.1. Overview
- 11.2.5.2. Products
- 11.2.5.3. SWOT Analysis
- 11.2.5.4. Recent Developments
- 11.2.5.5. Financials (Based on Availability)
- 11.2.6 Mitsui & Co Ltd (Certis Belchim)
- 11.2.6.1. Overview
- 11.2.6.2. Products
- 11.2.6.3. SWOT Analysis
- 11.2.6.4. Recent Developments
- 11.2.6.5. Financials (Based on Availability)
- 11.2.7 UPL Limited
- 11.2.7.1. Overview
- 11.2.7.2. Products
- 11.2.7.3. SWOT Analysis
- 11.2.7.4. Recent Developments
- 11.2.7.5. Financials (Based on Availability)
- 11.2.8 Nufarm Ltd
- 11.2.8.1. Overview
- 11.2.8.2. Products
- 11.2.8.3. SWOT Analysis
- 11.2.8.4. Recent Developments
- 11.2.8.5. Financials (Based on Availability)
- 11.2.1 American Vanguard Corporation
List of Figures
- Figure 1: Global Molluscicides Industry Revenue Breakdown (Million, %) by Region 2024 & 2032
- Figure 2: North America Molluscicides Industry Revenue (Million), by Production Analysis 2024 & 2032
- Figure 3: North America Molluscicides Industry Revenue Share (%), by Production Analysis 2024 & 2032
- Figure 4: North America Molluscicides Industry Revenue (Million), by Consumption Analysis 2024 & 2032
- Figure 5: North America Molluscicides Industry Revenue Share (%), by Consumption Analysis 2024 & 2032
- Figure 6: North America Molluscicides Industry Revenue (Million), by Import Market Analysis (Value & Volume) 2024 & 2032
- Figure 7: North America Molluscicides Industry Revenue Share (%), by Import Market Analysis (Value & Volume) 2024 & 2032
- Figure 8: North America Molluscicides Industry Revenue (Million), by Export Market Analysis (Value & Volume) 2024 & 2032
- Figure 9: North America Molluscicides Industry Revenue Share (%), by Export Market Analysis (Value & Volume) 2024 & 2032
- Figure 10: North America Molluscicides Industry Revenue (Million), by Price Trend Analysis 2024 & 2032
- Figure 11: North America Molluscicides Industry Revenue Share (%), by Price Trend Analysis 2024 & 2032
- Figure 12: North America Molluscicides Industry Revenue (Million), by Country 2024 & 2032
- Figure 13: North America Molluscicides Industry Revenue Share (%), by Country 2024 & 2032
- Figure 14: South America Molluscicides Industry Revenue (Million), by Production Analysis 2024 & 2032
- Figure 15: South America Molluscicides Industry Revenue Share (%), by Production Analysis 2024 & 2032
- Figure 16: South America Molluscicides Industry Revenue (Million), by Consumption Analysis 2024 & 2032
- Figure 17: South America Molluscicides Industry Revenue Share (%), by Consumption Analysis 2024 & 2032
- Figure 18: South America Molluscicides Industry Revenue (Million), by Import Market Analysis (Value & Volume) 2024 & 2032
- Figure 19: South America Molluscicides Industry Revenue Share (%), by Import Market Analysis (Value & Volume) 2024 & 2032
- Figure 20: South America Molluscicides Industry Revenue (Million), by Export Market Analysis (Value & Volume) 2024 & 2032
- Figure 21: South America Molluscicides Industry Revenue Share (%), by Export Market Analysis (Value & Volume) 2024 & 2032
- Figure 22: South America Molluscicides Industry Revenue (Million), by Price Trend Analysis 2024 & 2032
- Figure 23: South America Molluscicides Industry Revenue Share (%), by Price Trend Analysis 2024 & 2032
- Figure 24: South America Molluscicides Industry Revenue (Million), by Country 2024 & 2032
- Figure 25: South America Molluscicides Industry Revenue Share (%), by Country 2024 & 2032
- Figure 26: Europe Molluscicides Industry Revenue (Million), by Production Analysis 2024 & 2032
- Figure 27: Europe Molluscicides Industry Revenue Share (%), by Production Analysis 2024 & 2032
- Figure 28: Europe Molluscicides Industry Revenue (Million), by Consumption Analysis 2024 & 2032
- Figure 29: Europe Molluscicides Industry Revenue Share (%), by Consumption Analysis 2024 & 2032
- Figure 30: Europe Molluscicides Industry Revenue (Million), by Import Market Analysis (Value & Volume) 2024 & 2032
- Figure 31: Europe Molluscicides Industry Revenue Share (%), by Import Market Analysis (Value & Volume) 2024 & 2032
- Figure 32: Europe Molluscicides Industry Revenue (Million), by Export Market Analysis (Value & Volume) 2024 & 2032
- Figure 33: Europe Molluscicides Industry Revenue Share (%), by Export Market Analysis (Value & Volume) 2024 & 2032
- Figure 34: Europe Molluscicides Industry Revenue (Million), by Price Trend Analysis 2024 & 2032
- Figure 35: Europe Molluscicides Industry Revenue Share (%), by Price Trend Analysis 2024 & 2032
- Figure 36: Europe Molluscicides Industry Revenue (Million), by Country 2024 & 2032
- Figure 37: Europe Molluscicides Industry Revenue Share (%), by Country 2024 & 2032
- Figure 38: Middle East & Africa Molluscicides Industry Revenue (Million), by Production Analysis 2024 & 2032
- Figure 39: Middle East & Africa Molluscicides Industry Revenue Share (%), by Production Analysis 2024 & 2032
- Figure 40: Middle East & Africa Molluscicides Industry Revenue (Million), by Consumption Analysis 2024 & 2032
- Figure 41: Middle East & Africa Molluscicides Industry Revenue Share (%), by Consumption Analysis 2024 & 2032
- Figure 42: Middle East & Africa Molluscicides Industry Revenue (Million), by Import Market Analysis (Value & Volume) 2024 & 2032
- Figure 43: Middle East & Africa Molluscicides Industry Revenue Share (%), by Import Market Analysis (Value & Volume) 2024 & 2032
- Figure 44: Middle East & Africa Molluscicides Industry Revenue (Million), by Export Market Analysis (Value & Volume) 2024 & 2032
- Figure 45: Middle East & Africa Molluscicides Industry Revenue Share (%), by Export Market Analysis (Value & Volume) 2024 & 2032
- Figure 46: Middle East & Africa Molluscicides Industry Revenue (Million), by Price Trend Analysis 2024 & 2032
- Figure 47: Middle East & Africa Molluscicides Industry Revenue Share (%), by Price Trend Analysis 2024 & 2032
- Figure 48: Middle East & Africa Molluscicides Industry Revenue (Million), by Country 2024 & 2032
- Figure 49: Middle East & Africa Molluscicides Industry Revenue Share (%), by Country 2024 & 2032
- Figure 50: Asia Pacific Molluscicides Industry Revenue (Million), by Production Analysis 2024 & 2032
- Figure 51: Asia Pacific Molluscicides Industry Revenue Share (%), by Production Analysis 2024 & 2032
- Figure 52: Asia Pacific Molluscicides Industry Revenue (Million), by Consumption Analysis 2024 & 2032
- Figure 53: Asia Pacific Molluscicides Industry Revenue Share (%), by Consumption Analysis 2024 & 2032
- Figure 54: Asia Pacific Molluscicides Industry Revenue (Million), by Import Market Analysis (Value & Volume) 2024 & 2032
- Figure 55: Asia Pacific Molluscicides Industry Revenue Share (%), by Import Market Analysis (Value & Volume) 2024 & 2032
- Figure 56: Asia Pacific Molluscicides Industry Revenue (Million), by Export Market Analysis (Value & Volume) 2024 & 2032
- Figure 57: Asia Pacific Molluscicides Industry Revenue Share (%), by Export Market Analysis (Value & Volume) 2024 & 2032
- Figure 58: Asia Pacific Molluscicides Industry Revenue (Million), by Price Trend Analysis 2024 & 2032
- Figure 59: Asia Pacific Molluscicides Industry Revenue Share (%), by Price Trend Analysis 2024 & 2032
- Figure 60: Asia Pacific Molluscicides Industry Revenue (Million), by Country 2024 & 2032
- Figure 61: Asia Pacific Molluscicides Industry Revenue Share (%), by Country 2024 & 2032
List of Tables
- Table 1: Global Molluscicides Industry Revenue Million Forecast, by Region 2019 & 2032
- Table 2: Global Molluscicides Industry Revenue Million Forecast, by Production Analysis 2019 & 2032
- Table 3: Global Molluscicides Industry Revenue Million Forecast, by Consumption Analysis 2019 & 2032
- Table 4: Global Molluscicides Industry Revenue Million Forecast, by Import Market Analysis (Value & Volume) 2019 & 2032
- Table 5: Global Molluscicides Industry Revenue Million Forecast, by Export Market Analysis (Value & Volume) 2019 & 2032
- Table 6: Global Molluscicides Industry Revenue Million Forecast, by Price Trend Analysis 2019 & 2032
- Table 7: Global Molluscicides Industry Revenue Million Forecast, by Region 2019 & 2032
- Table 8: Global Molluscicides Industry Revenue Million Forecast, by Production Analysis 2019 & 2032
- Table 9: Global Molluscicides Industry Revenue Million Forecast, by Consumption Analysis 2019 & 2032
- Table 10: Global Molluscicides Industry Revenue Million Forecast, by Import Market Analysis (Value & Volume) 2019 & 2032
- Table 11: Global Molluscicides Industry Revenue Million Forecast, by Export Market Analysis (Value & Volume) 2019 & 2032
- Table 12: Global Molluscicides Industry Revenue Million Forecast, by Price Trend Analysis 2019 & 2032
- Table 13: Global Molluscicides Industry Revenue Million Forecast, by Country 2019 & 2032
- Table 14: United States Molluscicides Industry Revenue (Million) Forecast, by Application 2019 & 2032
- Table 15: Canada Molluscicides Industry Revenue (Million) Forecast, by Application 2019 & 2032
- Table 16: Mexico Molluscicides Industry Revenue (Million) Forecast, by Application 2019 & 2032
- Table 17: Global Molluscicides Industry Revenue Million Forecast, by Production Analysis 2019 & 2032
- Table 18: Global Molluscicides Industry Revenue Million Forecast, by Consumption Analysis 2019 & 2032
- Table 19: Global Molluscicides Industry Revenue Million Forecast, by Import Market Analysis (Value & Volume) 2019 & 2032
- Table 20: Global Molluscicides Industry Revenue Million Forecast, by Export Market Analysis (Value & Volume) 2019 & 2032
- Table 21: Global Molluscicides Industry Revenue Million Forecast, by Price Trend Analysis 2019 & 2032
- Table 22: Global Molluscicides Industry Revenue Million Forecast, by Country 2019 & 2032
- Table 23: Brazil Molluscicides Industry Revenue (Million) Forecast, by Application 2019 & 2032
- Table 24: Argentina Molluscicides Industry Revenue (Million) Forecast, by Application 2019 & 2032
- Table 25: Rest of South America Molluscicides Industry Revenue (Million) Forecast, by Application 2019 & 2032
- Table 26: Global Molluscicides Industry Revenue Million Forecast, by Production Analysis 2019 & 2032
- Table 27: Global Molluscicides Industry Revenue Million Forecast, by Consumption Analysis 2019 & 2032
- Table 28: Global Molluscicides Industry Revenue Million Forecast, by Import Market Analysis (Value & Volume) 2019 & 2032
- Table 29: Global Molluscicides Industry Revenue Million Forecast, by Export Market Analysis (Value & Volume) 2019 & 2032
- Table 30: Global Molluscicides Industry Revenue Million Forecast, by Price Trend Analysis 2019 & 2032
- Table 31: Global Molluscicides Industry Revenue Million Forecast, by Country 2019 & 2032
- Table 32: United Kingdom Molluscicides Industry Revenue (Million) Forecast, by Application 2019 & 2032
- Table 33: Germany Molluscicides Industry Revenue (Million) Forecast, by Application 2019 & 2032
- Table 34: France Molluscicides Industry Revenue (Million) Forecast, by Application 2019 & 2032
- Table 35: Italy Molluscicides Industry Revenue (Million) Forecast, by Application 2019 & 2032
- Table 36: Spain Molluscicides Industry Revenue (Million) Forecast, by Application 2019 & 2032
- Table 37: Russia Molluscicides Industry Revenue (Million) Forecast, by Application 2019 & 2032
- Table 38: Benelux Molluscicides Industry Revenue (Million) Forecast, by Application 2019 & 2032
- Table 39: Nordics Molluscicides Industry Revenue (Million) Forecast, by Application 2019 & 2032
- Table 40: Rest of Europe Molluscicides Industry Revenue (Million) Forecast, by Application 2019 & 2032
- Table 41: Global Molluscicides Industry Revenue Million Forecast, by Production Analysis 2019 & 2032
- Table 42: Global Molluscicides Industry Revenue Million Forecast, by Consumption Analysis 2019 & 2032
- Table 43: Global Molluscicides Industry Revenue Million Forecast, by Import Market Analysis (Value & Volume) 2019 & 2032
- Table 44: Global Molluscicides Industry Revenue Million Forecast, by Export Market Analysis (Value & Volume) 2019 & 2032
- Table 45: Global Molluscicides Industry Revenue Million Forecast, by Price Trend Analysis 2019 & 2032
- Table 46: Global Molluscicides Industry Revenue Million Forecast, by Country 2019 & 2032
- Table 47: Turkey Molluscicides Industry Revenue (Million) Forecast, by Application 2019 & 2032
- Table 48: Israel Molluscicides Industry Revenue (Million) Forecast, by Application 2019 & 2032
- Table 49: GCC Molluscicides Industry Revenue (Million) Forecast, by Application 2019 & 2032
- Table 50: North Africa Molluscicides Industry Revenue (Million) Forecast, by Application 2019 & 2032
- Table 51: South Africa Molluscicides Industry Revenue (Million) Forecast, by Application 2019 & 2032
- Table 52: Rest of Middle East & Africa Molluscicides Industry Revenue (Million) Forecast, by Application 2019 & 2032
- Table 53: Global Molluscicides Industry Revenue Million Forecast, by Production Analysis 2019 & 2032
- Table 54: Global Molluscicides Industry Revenue Million Forecast, by Consumption Analysis 2019 & 2032
- Table 55: Global Molluscicides Industry Revenue Million Forecast, by Import Market Analysis (Value & Volume) 2019 & 2032
- Table 56: Global Molluscicides Industry Revenue Million Forecast, by Export Market Analysis (Value & Volume) 2019 & 2032
- Table 57: Global Molluscicides Industry Revenue Million Forecast, by Price Trend Analysis 2019 & 2032
- Table 58: Global Molluscicides Industry Revenue Million Forecast, by Country 2019 & 2032
- Table 59: China Molluscicides Industry Revenue (Million) Forecast, by Application 2019 & 2032
- Table 60: India Molluscicides Industry Revenue (Million) Forecast, by Application 2019 & 2032
- Table 61: Japan Molluscicides Industry Revenue (Million) Forecast, by Application 2019 & 2032
- Table 62: South Korea Molluscicides Industry Revenue (Million) Forecast, by Application 2019 & 2032
- Table 63: ASEAN Molluscicides Industry Revenue (Million) Forecast, by Application 2019 & 2032
- Table 64: Oceania Molluscicides Industry Revenue (Million) Forecast, by Application 2019 & 2032
- Table 65: Rest of Asia Pacific Molluscicides Industry Revenue (Million) Forecast, by Application 2019 & 2032
Frequently Asked Questions
1. What is the projected Compound Annual Growth Rate (CAGR) of the Molluscicides Industry?
The projected CAGR is approximately 5.60%.
2. Which companies are prominent players in the Molluscicides Industry?
Key companies in the market include American Vanguard Corporation, PI Industries, Arxada, Liphatech Inc, W Neudorff GmbH K, Mitsui & Co Ltd (Certis Belchim), UPL Limited, Nufarm Ltd.
3. What are the main segments of the Molluscicides Industry?
The market segments include Production Analysis, Consumption Analysis, Import Market Analysis (Value & Volume), Export Market Analysis (Value & Volume), Price Trend Analysis.
4. Can you provide details about the market size?
The market size is estimated to be USD XX Million as of 2022.
5. What are some drivers contributing to market growth?
Seed Treatment As A Solution To Enhance Yield; Growing Awareness For Seed Treatment Among The Farmers; Rising Trend Of Organic Farming.
6. What are the notable trends driving market growth?
South America dominated the global molluscicide market.
7. Are there any restraints impacting market growth?
Limitations Across Farm-Level Seed Treatment; Rising Environmental Concerns.
8. Can you provide examples of recent developments in the market?
November 2022: Certis Belchim BV acquired the assets of Henry Manufacturing Limited in New Zealand. This includes its portfolio and pipeline of potassium fatty-acid salts, which have various applications in crop protection.March 2022: A new company called Certis Belchim BV was formed by Mitsui & Co. Ltd by merging its recently acquired Belchim Crop Protection and its European subsidiary Certis Europe. This was done in accordance with the terms of a definitive agreement.June 2021: Belchim Crop Protection was fully acquired by Mitsui & Co. Ltd after purchasing the remaining 32% of shares owned by Belchim Management NV/SA. Mitsui now holds a 62% stake in Belchim Crop Protection alongside ISK and Mitsui Chemicals Agro. This acquisition allows Mitsui to focus on establishing a sustainable crop protection company in Europe.
9. What pricing options are available for accessing the report?
Pricing options include single-user, multi-user, and enterprise licenses priced at USD 3800, USD 4500, and USD 5800 respectively.
10. Is the market size provided in terms of value or volume?
The market size is provided in terms of value, measured in Million.
11. Are there any specific market keywords associated with the report?
Yes, the market keyword associated with the report is "Molluscicides Industry," which aids in identifying and referencing the specific market segment covered.
12. How do I determine which pricing option suits my needs best?
The pricing options vary based on user requirements and access needs. Individual users may opt for single-user licenses, while businesses requiring broader access may choose multi-user or enterprise licenses for cost-effective access to the report.
13. Are there any additional resources or data provided in the Molluscicides Industry report?
While the report offers comprehensive insights, it's advisable to review the specific contents or supplementary materials provided to ascertain if additional resources or data are available.
14. How can I stay updated on further developments or reports in the Molluscicides Industry?
To stay informed about further developments, trends, and reports in the Molluscicides Industry, consider subscribing to industry newsletters, following relevant companies and organizations, or regularly checking reputable industry news sources and publications.
Methodology
Step 1 - Identification of Relevant Samples Size from Population Database


Step 2 - Approaches for Defining Global Market Size (Value, Volume* & Price*)

Note*: In applicable scenarios
Step 3 - Data Sources
Primary Research
- Web Analytics
- Survey Reports
- Research Institute
- Latest Research Reports
- Opinion Leaders
Secondary Research
- Annual Reports
- White Paper
- Latest Press Release
- Industry Association
- Paid Database
- Investor Presentations

Step 4 - Data Triangulation
Involves using different sources of information in order to increase the validity of a study
These sources are likely to be stakeholders in a program - participants, other researchers, program staff, other community members, and so on.
Then we put all data in single framework & apply various statistical tools to find out the dynamic on the market.
During the analysis stage, feedback from the stakeholder groups would be compared to determine areas of agreement as well as areas of divergence


