

Key Insights
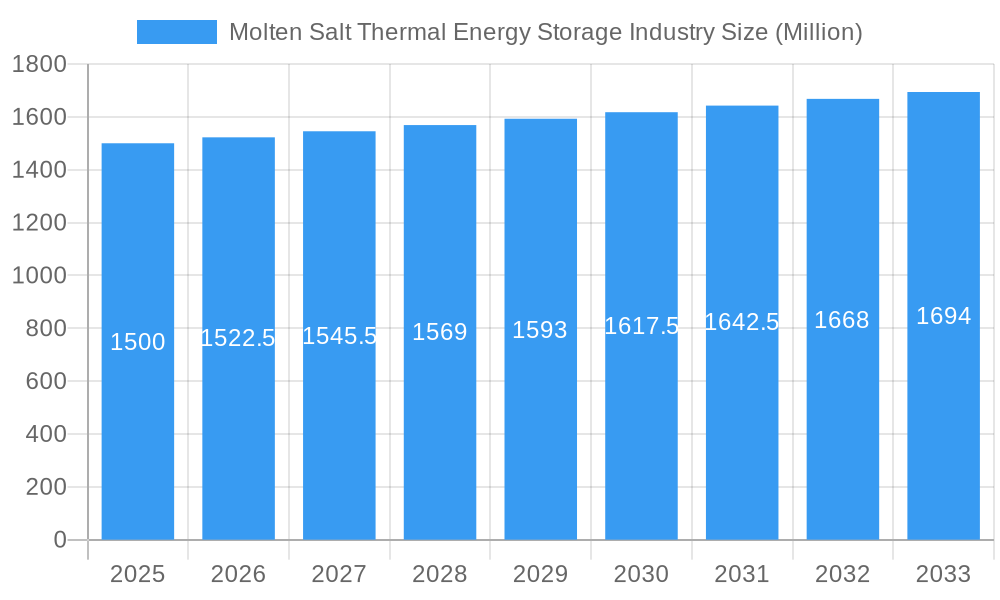
The Molten Salt Thermal Energy Storage (MSTES) market is poised for substantial growth, driven by the critical need for reliable energy storage to integrate intermittent renewable sources like solar and wind power. With a projected Compound Annual Growth Rate (CAGR) of 9.8%, the market is anticipated to reach a size of $2.22 billion by 2025. Key growth factors include supportive government incentives for renewable energy, increasing climate change awareness, and the declining cost of MSTES technologies. Advancements in parabolic troughs, Fresnel reflectors, and power tower systems are improving efficiency and reducing deployment expenses. Despite initial investment costs and material compatibility challenges, ongoing research and development are mitigating these restraints. North America, Europe, and Asia Pacific are leading regions due to robust government policies and significant renewable energy projects. Leading companies are driving innovation and project development. While parabolic troughs currently dominate, Fresnel reflectors and power tower systems are gaining prominence due to design and efficiency improvements. Future growth will depend on overcoming technological hurdles, sustained government support, and reduced renewable energy integration costs.
Molten Salt Thermal Energy Storage Industry Market Size (In Billion)
The forecast period, from 2025 to 2033, is expected to witness significant expansion driven by the demand for grid stability and increased renewable energy penetration. The MSTES market is projected for wider adoption across utilities, industrial processes, and concentrated solar power (CSP) plants. Regional growth will vary based on government policies, energy infrastructure, and renewable resource availability. Continuous innovation in materials science and thermal management will be crucial for cost reduction, enhancing MSTES competitiveness. Strategic partnerships are expected to accelerate market growth. The outlook for the MSTES market is strong, fueled by the global demand for dependable and sustainable energy storage solutions.
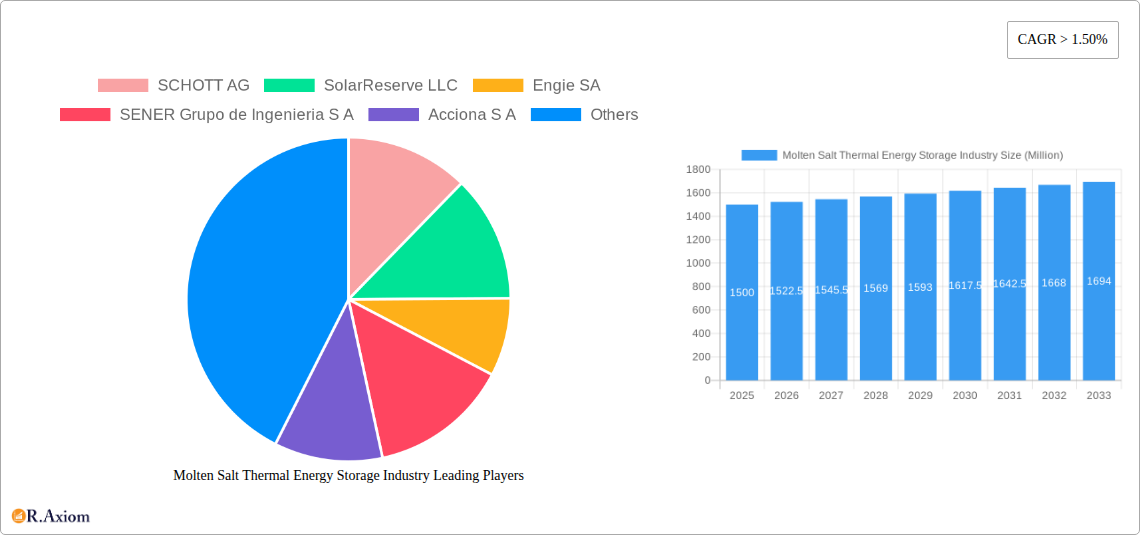
Molten Salt Thermal Energy Storage Industry Company Market Share
Molten Salt Thermal Energy Storage Industry: A Comprehensive Market Report (2019-2033)
This in-depth report provides a comprehensive analysis of the Molten Salt Thermal Energy Storage (MSTES) industry, offering invaluable insights for stakeholders seeking to navigate this rapidly evolving market. The study period spans from 2019 to 2033, with 2025 serving as the base and estimated year. The report utilizes a robust forecasting methodology to project market trends from 2025 to 2033, building upon historical data from 2019 to 2024. Key market segments, including Parabolic Troughs, Fresnel Reflector, and Power Tower technologies, are meticulously examined, alongside a detailed analysis of leading players such as SCHOTT AG, SolarReserve LLC, Engie SA, SENER Grupo de Ingenieria S A, Acciona S A, Abengoa SA, Yara International ASA, and BrightSource Energy Inc. The report forecasts a total market value reaching xx Million by 2033.
Molten Salt Thermal Energy Storage Industry Market Concentration & Innovation
The Molten Salt Thermal Energy Storage (MSTES) industry exhibits a moderately concentrated market structure, with a few major players holding significant market share. SCHOTT AG, SolarReserve LLC, and Engie SA are among the leading companies, collectively accounting for an estimated xx% of the global market share in 2025. However, the emergence of innovative technologies and new entrants is gradually increasing competition.
Innovation Drivers:
- Technological advancements in materials science, improving efficiency and reducing costs.
- Government incentives and supportive policies promoting renewable energy integration.
- Growing demand for reliable and cost-effective energy storage solutions.
Regulatory Frameworks: Stringent environmental regulations and carbon emission reduction targets are driving the adoption of MSTES technologies. However, inconsistencies in regulatory frameworks across different regions present challenges for market expansion.
Product Substitutes: Other energy storage technologies like pumped hydro, compressed air energy storage, and batteries pose competitive challenges. However, MSTES maintains a competitive edge due to its high energy density and long duration storage capabilities.
End-User Trends: The increasing adoption of renewable energy sources, such as solar and geothermal power, is driving demand for efficient energy storage solutions, fueling the growth of the MSTES market.
M&A Activities: The MSTES sector has witnessed a moderate level of mergers and acquisitions (M&A) activity in recent years. While the total value of M&A deals in the historical period (2019-2024) is estimated at xx Million, a significant increase is projected during the forecast period (2025-2033) driven by strategic consolidation and technological advancements.
Molten Salt Thermal Energy Storage Industry Industry Trends & Insights
The MSTES industry is experiencing robust growth, driven by a confluence of factors. The global market is projected to achieve a Compound Annual Growth Rate (CAGR) of xx% during the forecast period (2025-2033). Market penetration of MSTES systems is also increasing steadily, particularly in regions with high solar irradiance and substantial renewable energy capacity.
Several factors are driving this growth:
- Increasing demand for grid-scale energy storage to ensure grid stability and reliability in the face of the fluctuating nature of renewable energy sources.
- Government support through subsidies, tax incentives, and supportive policies aiming to mitigate climate change and reduce carbon emissions.
- Technological advancements leading to improved system efficiency, reduced costs, and enhanced reliability.
- Growing awareness of the environmental benefits of MSTES, which offers a cleaner and more sustainable alternative to fossil fuel-based energy sources.
The competitive dynamics are shaping up with established players focusing on optimizing existing technologies and expanding their market reach, while new entrants are exploring innovative solutions and niche applications. Technological disruptions, such as the development of advanced molten salt formulations and improved heat transfer systems, are constantly pushing the boundaries of efficiency and cost-effectiveness. Consumer preferences are increasingly driven by sustainability concerns and the need for reliable, long-duration energy storage solutions.
Dominant Markets & Segments in Molten Salt Thermal Energy Storage Industry
The dominant region for MSTES is currently North America, driven by strong government support for renewable energy and robust investments in large-scale energy storage projects. Within this region, the United States holds a leading position, owing to its extensive solar resources and the presence of major industry players.
Technology Segments:
Parabolic Troughs: This technology currently holds the largest market share due to its maturity and cost-effectiveness. Key drivers include economies of scale and well-established supply chains.
Fresnel Reflector: This segment is experiencing moderate growth, driven by improvements in efficiency and reduced costs. However, its market share remains relatively smaller compared to parabolic troughs.
Power Tower: This technology offers high energy density but currently has a smaller market share due to higher capital costs and complexities in its implementation.
Key Drivers of Regional Dominance:
- North America: Strong government policies, abundant solar resources, significant investments in renewable energy infrastructure.
- Europe: Growing demand for energy independence and decarbonization efforts.
- Asia-Pacific: Rapid economic growth, increasing energy demand, and government support for renewable energy adoption.
Molten Salt Thermal Energy Storage Industry Product Developments
Recent advancements in molten salt thermal energy storage have focused on enhancing the efficiency of energy transfer, improving the thermal stability of the salts, and reducing the overall cost of the systems. New materials and improved designs are enabling higher storage capacities and longer operational lifespans, making MSTES increasingly competitive with other energy storage technologies. Applications are expanding beyond solar thermal power plants to include industrial process heat, district heating systems, and grid-scale energy storage for improved power grid stability. These advancements have fostered a more robust and reliable technology with significant market applicability.
Report Scope & Segmentation Analysis
This report segments the molten salt thermal energy storage market based on technology type: Parabolic Troughs, Fresnel Reflector, and Power Tower. Each segment's market size, growth projections, and competitive dynamics are analyzed in detail. Parabolic troughs, being the most mature technology, currently hold the largest market share, projected to continue its growth at a CAGR of xx% during the forecast period. Fresnel reflectors are also expected to witness substantial growth, driven by technological advancements, while the Power Tower segment is projected to experience a relatively slower but steady growth rate, attributed to its higher capital costs.
Key Drivers of Molten Salt Thermal Energy Storage Industry Growth
The MSTES market growth is driven by factors such as:
- Technological Advancements: Improved materials, higher energy density storage, and reduced costs are key enablers.
- Economic Factors: Decreasing Levelized Cost of Energy (LCOE) for renewable energy makes MSTES increasingly cost-competitive.
- Regulatory Support: Government policies promoting renewable energy adoption and carbon emission reduction initiatives. For example, many countries are offering tax breaks or subsidies to incentivize the use of MSTES.
Challenges in the Molten Salt Thermal Energy Storage Industry Sector
Challenges faced by the MSTES industry include:
- High Initial Capital Costs: The high upfront investment required for implementing MSTES systems poses a barrier for some potential adopters.
- Supply Chain Constraints: The availability of specialized materials and components for MSTES systems can be a constraint, impacting project timelines.
- Technological Complexity: The design, construction, and operation of MSTES systems require specialized expertise.
Emerging Opportunities in Molten Salt Thermal Energy Storage Industry
Emerging opportunities include:
- Integration with other renewable energy sources: MSTES can be coupled with wind, solar, and geothermal to create hybrid energy systems.
- New Applications: Expansion into industrial process heat and district heating sectors is creating new revenue streams.
- Technological Innovation: The development of advanced materials and designs continues to improve efficiency and reduce costs.
Leading Players in the Molten Salt Thermal Energy Storage Industry Market
- SCHOTT AG
- SolarReserve LLC
- Engie SA
- SENER Grupo de Ingenieria S A
- Acciona S A
- Abengoa SA
- Yara International ASA
- BrightSource Energy Inc
Key Developments in Molten Salt Thermal Energy Storage Industry Industry
- November 2022: Hyme Energy ApS partnered with Bornholms Energi & Forsyning (BEOF) to build a 1 MW/20 MWh molten salt thermal energy storage demonstrator on Bornholm, Denmark. This project highlights the growing interest in smaller-scale MSTES applications and the potential for providing multiple services (heat, power, and ancillary services). Completion is scheduled for 2024, and its success could significantly influence wider adoption of the technology.
Strategic Outlook for Molten Salt Thermal Energy Storage Industry Market
The future of the MSTES market looks promising, with significant growth potential driven by increasing demand for reliable and cost-effective energy storage, supportive government policies, and continuous technological innovations. New applications in various sectors and the integration with other renewable energy sources will further broaden the market reach. The challenges related to high initial costs and supply chain constraints need to be addressed to fully unlock the market's potential. The market is expected to experience sustained growth, driven by increasing investments in renewable energy and the urgent need for decarbonization.
Molten Salt Thermal Energy Storage Industry Segmentation
-
1. Technology
- 1.1. Parabolic Troughs
- 1.2. Fresnel Reflector
- 1.3. Power Tower
Molten Salt Thermal Energy Storage Industry Segmentation By Geography
- 1. North America
- 2. Asia Pacific
- 3. Europe
- 4. South America
- 5. Middle East and Africa
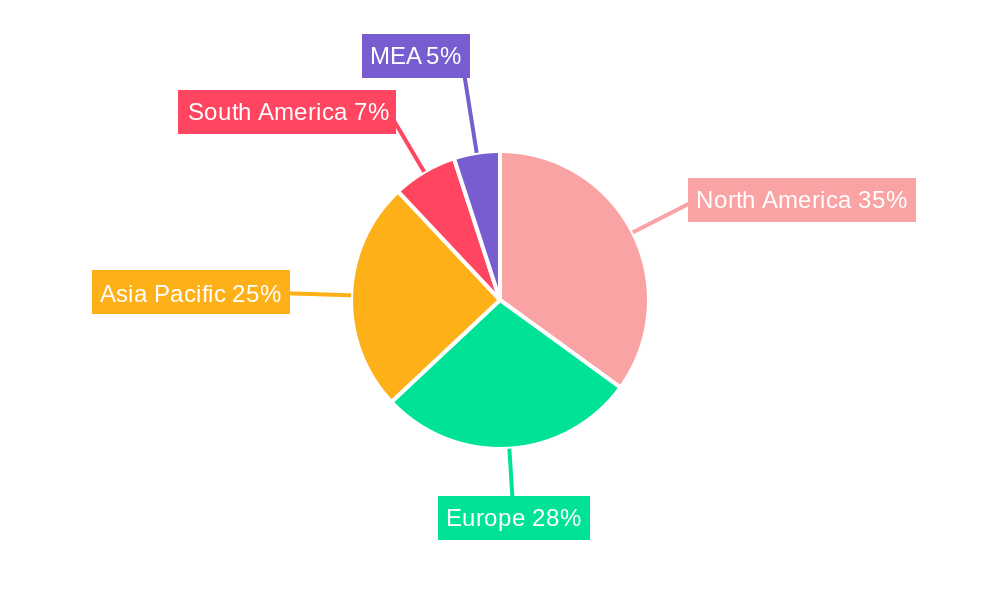
Molten Salt Thermal Energy Storage Industry Regional Market Share
Geographic Coverage of Molten Salt Thermal Energy Storage Industry
Molten Salt Thermal Energy Storage Industry REPORT HIGHLIGHTS
| Aspects | Details |
|---|---|
| Study Period | 2020-2034 |
| Base Year | 2025 |
| Estimated Year | 2026 |
| Forecast Period | 2026-2034 |
| Historical Period | 2020-2025 |
| Growth Rate | CAGR of 9.8% from 2020-2034 |
| Segmentation |
|
Table of Contents
- 1. Introduction
- 1.1. Research Scope
- 1.2. Market Segmentation
- 1.3. Research Objective
- 1.4. Definitions and Assumptions
- 2. Executive Summary
- 2.1. Market Snapshot
- 3. Market Dynamics
- 3.1. Market Drivers
- 3.2. Market Restrains
- 3.3. Market Trends
- 3.4. Market Opportunities
- 4. Market Factor Analysis
- 4.1. Porters Five Forces
- 4.1.1. Bargaining Power of Suppliers
- 4.1.2. Bargaining Power of Buyers
- 4.1.3. Threat of New Entrants
- 4.1.4. Threat of Substitutes
- 4.1.5. Competitive Rivalry
- 4.2. PESTEL analysis
- 4.3. BCG Analysis
- 4.3.1. Stars (High Growth, High Market Share)
- 4.3.2. Cash Cows (Low Growth, High Market Share)
- 4.3.3. Question Mark (High Growth, Low Market Share)
- 4.3.4. Dogs (Low Growth, Low Market Share)
- 4.4. Ansoff Matrix Analysis
- 4.5. Supply Chain Analysis
- 4.6. Regulatory Landscape
- 4.7. Current Market Potential and Opportunity Assessment (TAM–SAM–SOM Framework)
- 4.8. RAX Analyst Note
- 4.1. Porters Five Forces
- 5. Market Analysis, Insights and Forecast 2021-2033
- 5.1. Market Analysis, Insights and Forecast - by Technology
- 5.1.1. Parabolic Troughs
- 5.1.2. Fresnel Reflector
- 5.1.3. Power Tower
- 5.2. Market Analysis, Insights and Forecast - by Region
- 5.2.1. North America
- 5.2.2. Asia Pacific
- 5.2.3. Europe
- 5.2.4. South America
- 5.2.5. Middle East and Africa
- 5.1. Market Analysis, Insights and Forecast - by Technology
- 6. Global Molten Salt Thermal Energy Storage Industry Analysis, Insights and Forecast, 2021-2033
- 6.1. Market Analysis, Insights and Forecast - by Technology
- 6.1.1. Parabolic Troughs
- 6.1.2. Fresnel Reflector
- 6.1.3. Power Tower
- 6.1. Market Analysis, Insights and Forecast - by Technology
- 7. North America Molten Salt Thermal Energy Storage Industry Analysis, Insights and Forecast, 2020-2032
- 7.1. Market Analysis, Insights and Forecast - by Technology
- 7.1.1. Parabolic Troughs
- 7.1.2. Fresnel Reflector
- 7.1.3. Power Tower
- 7.1. Market Analysis, Insights and Forecast - by Technology
- 8. Asia Pacific Molten Salt Thermal Energy Storage Industry Analysis, Insights and Forecast, 2020-2032
- 8.1. Market Analysis, Insights and Forecast - by Technology
- 8.1.1. Parabolic Troughs
- 8.1.2. Fresnel Reflector
- 8.1.3. Power Tower
- 8.1. Market Analysis, Insights and Forecast - by Technology
- 9. Europe Molten Salt Thermal Energy Storage Industry Analysis, Insights and Forecast, 2020-2032
- 9.1. Market Analysis, Insights and Forecast - by Technology
- 9.1.1. Parabolic Troughs
- 9.1.2. Fresnel Reflector
- 9.1.3. Power Tower
- 9.1. Market Analysis, Insights and Forecast - by Technology
- 10. South America Molten Salt Thermal Energy Storage Industry Analysis, Insights and Forecast, 2020-2032
- 10.1. Market Analysis, Insights and Forecast - by Technology
- 10.1.1. Parabolic Troughs
- 10.1.2. Fresnel Reflector
- 10.1.3. Power Tower
- 10.1. Market Analysis, Insights and Forecast - by Technology
- 11. Middle East and Africa Molten Salt Thermal Energy Storage Industry Analysis, Insights and Forecast, 2020-2032
- 11.1. Market Analysis, Insights and Forecast - by Technology
- 11.1.1. Parabolic Troughs
- 11.1.2. Fresnel Reflector
- 11.1.3. Power Tower
- 11.1. Market Analysis, Insights and Forecast - by Technology
- 12. Competitive Analysis
- 12.1. Company Profiles
- 12.1.1 SCHOTT AG
- 12.1.1.1. Company Overview
- 12.1.1.2. Products
- 12.1.1.3. Company Financials
- 12.1.1.4. SWOT Analysis
- 12.1.2 SolarReserve LLC
- 12.1.2.1. Company Overview
- 12.1.2.2. Products
- 12.1.2.3. Company Financials
- 12.1.2.4. SWOT Analysis
- 12.1.3 Engie SA
- 12.1.3.1. Company Overview
- 12.1.3.2. Products
- 12.1.3.3. Company Financials
- 12.1.3.4. SWOT Analysis
- 12.1.4 SENER Grupo de Ingenieria S A
- 12.1.4.1. Company Overview
- 12.1.4.2. Products
- 12.1.4.3. Company Financials
- 12.1.4.4. SWOT Analysis
- 12.1.5 Acciona S A
- 12.1.5.1. Company Overview
- 12.1.5.2. Products
- 12.1.5.3. Company Financials
- 12.1.5.4. SWOT Analysis
- 12.1.6 Abengoa SA
- 12.1.6.1. Company Overview
- 12.1.6.2. Products
- 12.1.6.3. Company Financials
- 12.1.6.4. SWOT Analysis
- 12.1.7 Yara International ASA
- 12.1.7.1. Company Overview
- 12.1.7.2. Products
- 12.1.7.3. Company Financials
- 12.1.7.4. SWOT Analysis
- 12.1.8 BrightSource Energy Inc
- 12.1.8.1. Company Overview
- 12.1.8.2. Products
- 12.1.8.3. Company Financials
- 12.1.8.4. SWOT Analysis
- 12.1.1 SCHOTT AG
- 12.2. Market Entropy
- 12.2.1 Company's Key Areas Served
- 12.2.2 Recent Developments
- 12.3. Company Market Share Analysis 2025
- 12.3.1 Top 5 Companies Market Share Analysis
- 12.3.2 Top 3 Companies Market Share Analysis
- 12.4. List of Potential Customers
- 13. Research Methodology
List of Figures
- Figure 1: Global Molten Salt Thermal Energy Storage Industry Revenue Breakdown (billion, %) by Region 2025 & 2033
- Figure 2: North America Molten Salt Thermal Energy Storage Industry Revenue (billion), by Technology 2025 & 2033
- Figure 3: North America Molten Salt Thermal Energy Storage Industry Revenue Share (%), by Technology 2025 & 2033
- Figure 4: North America Molten Salt Thermal Energy Storage Industry Revenue (billion), by Country 2025 & 2033
- Figure 5: North America Molten Salt Thermal Energy Storage Industry Revenue Share (%), by Country 2025 & 2033
- Figure 6: Asia Pacific Molten Salt Thermal Energy Storage Industry Revenue (billion), by Technology 2025 & 2033
- Figure 7: Asia Pacific Molten Salt Thermal Energy Storage Industry Revenue Share (%), by Technology 2025 & 2033
- Figure 8: Asia Pacific Molten Salt Thermal Energy Storage Industry Revenue (billion), by Country 2025 & 2033
- Figure 9: Asia Pacific Molten Salt Thermal Energy Storage Industry Revenue Share (%), by Country 2025 & 2033
- Figure 10: Europe Molten Salt Thermal Energy Storage Industry Revenue (billion), by Technology 2025 & 2033
- Figure 11: Europe Molten Salt Thermal Energy Storage Industry Revenue Share (%), by Technology 2025 & 2033
- Figure 12: Europe Molten Salt Thermal Energy Storage Industry Revenue (billion), by Country 2025 & 2033
- Figure 13: Europe Molten Salt Thermal Energy Storage Industry Revenue Share (%), by Country 2025 & 2033
- Figure 14: South America Molten Salt Thermal Energy Storage Industry Revenue (billion), by Technology 2025 & 2033
- Figure 15: South America Molten Salt Thermal Energy Storage Industry Revenue Share (%), by Technology 2025 & 2033
- Figure 16: South America Molten Salt Thermal Energy Storage Industry Revenue (billion), by Country 2025 & 2033
- Figure 17: South America Molten Salt Thermal Energy Storage Industry Revenue Share (%), by Country 2025 & 2033
- Figure 18: Middle East and Africa Molten Salt Thermal Energy Storage Industry Revenue (billion), by Technology 2025 & 2033
- Figure 19: Middle East and Africa Molten Salt Thermal Energy Storage Industry Revenue Share (%), by Technology 2025 & 2033
- Figure 20: Middle East and Africa Molten Salt Thermal Energy Storage Industry Revenue (billion), by Country 2025 & 2033
- Figure 21: Middle East and Africa Molten Salt Thermal Energy Storage Industry Revenue Share (%), by Country 2025 & 2033
List of Tables
- Table 1: Global Molten Salt Thermal Energy Storage Industry Revenue billion Forecast, by Technology 2020 & 2033
- Table 2: Global Molten Salt Thermal Energy Storage Industry Revenue billion Forecast, by Region 2020 & 2033
- Table 3: Global Molten Salt Thermal Energy Storage Industry Revenue billion Forecast, by Technology 2020 & 2033
- Table 4: Global Molten Salt Thermal Energy Storage Industry Revenue billion Forecast, by Country 2020 & 2033
- Table 5: Global Molten Salt Thermal Energy Storage Industry Revenue billion Forecast, by Technology 2020 & 2033
- Table 6: Global Molten Salt Thermal Energy Storage Industry Revenue billion Forecast, by Country 2020 & 2033
- Table 7: Global Molten Salt Thermal Energy Storage Industry Revenue billion Forecast, by Technology 2020 & 2033
- Table 8: Global Molten Salt Thermal Energy Storage Industry Revenue billion Forecast, by Country 2020 & 2033
- Table 9: Global Molten Salt Thermal Energy Storage Industry Revenue billion Forecast, by Technology 2020 & 2033
- Table 10: Global Molten Salt Thermal Energy Storage Industry Revenue billion Forecast, by Country 2020 & 2033
- Table 11: Global Molten Salt Thermal Energy Storage Industry Revenue billion Forecast, by Technology 2020 & 2033
- Table 12: Global Molten Salt Thermal Energy Storage Industry Revenue billion Forecast, by Country 2020 & 2033
Frequently Asked Questions
1. What is the projected Compound Annual Growth Rate (CAGR) of the Molten Salt Thermal Energy Storage Industry?
The projected CAGR is approximately 9.8%.
2. Which companies are prominent players in the Molten Salt Thermal Energy Storage Industry?
Key companies in the market include SCHOTT AG, SolarReserve LLC, Engie SA, SENER Grupo de Ingenieria S A, Acciona S A, Abengoa SA, Yara International ASA, BrightSource Energy Inc.
3. What are the main segments of the Molten Salt Thermal Energy Storage Industry?
The market segments include Technology.
4. Can you provide details about the market size?
The market size is estimated to be USD 2.22 billion as of 2022.
5. What are some drivers contributing to market growth?
4.; Increasing Investments in Offshore Wind Power Projects4.; Supportive Government Policies.
6. What are the notable trends driving market growth?
Parabolic Trough Segment to Dominate the Market.
7. Are there any restraints impacting market growth?
4.; Increasing Adopting of Alternative Clean Energy Sources (Ex: Solar. Hydro).
8. Can you provide examples of recent developments in the market?
November 2022: Hyme Energy ApS announced that the company is partnering with Bornholms Energi & Forsyning (BEOF) to build its first molten salt thermal energy storage demonstrator on the Danish island of Bornholm. The storage facility is scheduled for completion in 2024 and will have a capacity of 1 MW/20 MWh. It will provide heat, power, and ancillary services to the local network.
9. What pricing options are available for accessing the report?
Pricing options include single-user, multi-user, and enterprise licenses priced at USD 4750, USD 5250, and USD 8750 respectively.
10. Is the market size provided in terms of value or volume?
The market size is provided in terms of value, measured in billion.
11. Are there any specific market keywords associated with the report?
Yes, the market keyword associated with the report is "Molten Salt Thermal Energy Storage Industry," which aids in identifying and referencing the specific market segment covered.
12. How do I determine which pricing option suits my needs best?
The pricing options vary based on user requirements and access needs. Individual users may opt for single-user licenses, while businesses requiring broader access may choose multi-user or enterprise licenses for cost-effective access to the report.
13. Are there any additional resources or data provided in the Molten Salt Thermal Energy Storage Industry report?
While the report offers comprehensive insights, it's advisable to review the specific contents or supplementary materials provided to ascertain if additional resources or data are available.
14. How can I stay updated on further developments or reports in the Molten Salt Thermal Energy Storage Industry?
To stay informed about further developments, trends, and reports in the Molten Salt Thermal Energy Storage Industry, consider subscribing to industry newsletters, following relevant companies and organizations, or regularly checking reputable industry news sources and publications.
Methodology
Step 1 - Identification of Relevant Samples Size from Population Database


Step 2 - Approaches for Defining Global Market Size (Value, Volume* & Price*)

Note*: In applicable scenarios
Step 3 - Data Sources
Primary Research
- Web Analytics
- Survey Reports
- Research Institute
- Latest Research Reports
- Opinion Leaders
Secondary Research
- Annual Reports
- White Paper
- Latest Press Release
- Industry Association
- Paid Database
- Investor Presentations

Step 4 - Data Triangulation
Involves using different sources of information in order to increase the validity of a study
These sources are likely to be stakeholders in a program - participants, other researchers, program staff, other community members, and so on.
Then we put all data in single framework & apply various statistical tools to find out the dynamic on the market.
During the analysis stage, feedback from the stakeholder groups would be compared to determine areas of agreement as well as areas of divergence