
Key Insights
The Myeloproliferative Disorder (MPD) therapeutics market is experiencing robust growth, driven by increasing prevalence of MPDs like polycythemia vera, essential thrombocythemia, and myelofibrosis, coupled with advancements in treatment modalities. The market's compound annual growth rate (CAGR) of 4.90% from 2019 to 2024 suggests a significant expansion, projected to continue over the forecast period (2025-2033). This growth is fueled by the rising geriatric population, a key demographic susceptible to MPDs, and the ongoing development of targeted therapies, including novel immunotherapies and improved stem cell transplantation techniques. The market is segmented by MPD type, treatment, and end-user, with hospitals and specialty clinics representing major end-users. Leading pharmaceutical companies like Pfizer, Novartis, and Bristol-Myers Squibb are actively involved in research and development, contributing to the market's dynamism. While challenges exist, such as the high cost of advanced therapies and variations in healthcare infrastructure across regions, the overall market outlook remains positive, projecting substantial growth in the coming years. The North American market currently holds a significant share, driven by high healthcare expenditure and advanced medical infrastructure, but the Asia-Pacific region is expected to exhibit notable growth due to rising awareness and increasing healthcare investment.
The competitive landscape is characterized by the presence of major pharmaceutical players actively engaged in clinical trials and drug approvals for novel MPD treatments. Strategic collaborations, mergers, and acquisitions are likely to reshape the market dynamics further. The increasing focus on personalized medicine and the development of biomarkers for earlier diagnosis are expected to significantly impact treatment strategies and improve patient outcomes. Continued research and development efforts targeting unmet medical needs and the exploration of combination therapies promise to unlock new avenues for growth and potentially accelerate the market's expansion. The long-term outlook for the MPD therapeutics market remains optimistic, predicated on sustained innovation and a growing need for effective and accessible treatment options for patients worldwide.
Myeloproliferative Disorder Therapeutics Industry Market Report: 2019-2033
This comprehensive report provides an in-depth analysis of the Myeloproliferative Disorder (MPD) therapeutics market, offering valuable insights for industry stakeholders, investors, and researchers. Covering the period from 2019 to 2033, with a focus on 2025, this report meticulously examines market trends, competitive landscapes, and future growth potential. The analysis incorporates data on market size (in Millions), CAGR, market share, and M&A activities, providing a holistic view of this dynamic sector.
Myeloproliferative Disorder Therapeutics Industry Market Concentration & Innovation
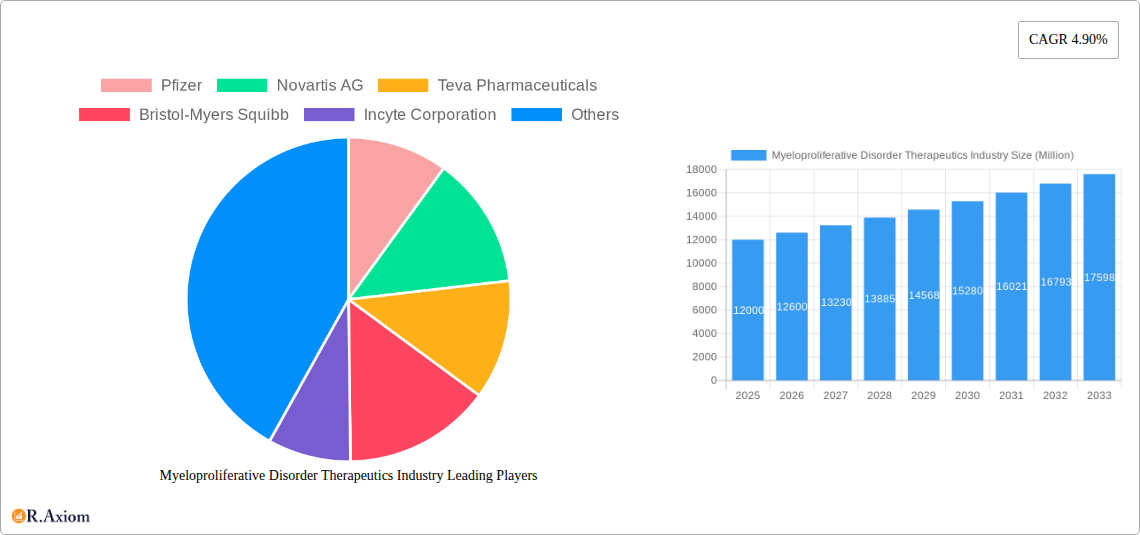
The MPD therapeutics market exhibits a moderately concentrated landscape, with key players like Pfizer, Novartis AG, Teva Pharmaceuticals, Bristol-Myers Squibb, Incyte Corporation, AbbVie, Takeda Pharmaceutical Company Limited, and Viatris (Mylan N V) holding significant market share. Precise market share figures for 2025 are currently under review and will be available in the full report. However, preliminary estimates suggest a combined market share of approximately xx% for the top 8 players. Innovation within the industry is driven by the continuous need for more effective and targeted therapies, particularly for patients with severe forms of MPD. Regulatory frameworks, such as those set by the FDA, play a crucial role in shaping market dynamics. Product substitutes, such as alternative treatment modalities, influence the competitive landscape and treatment choices. M&A activities, while not excessively frequent, impact the market, often resulting in portfolio expansion and increased competition. Recent M&A deals in the broader oncology sector have generated xx Million in value over the past five years (data available in the full report). End-user trends, with an increasing focus on personalized medicine and improved patient outcomes, are also shaping industry innovation.
Myeloproliferative Disorder Therapeutics Industry Industry Trends & Insights
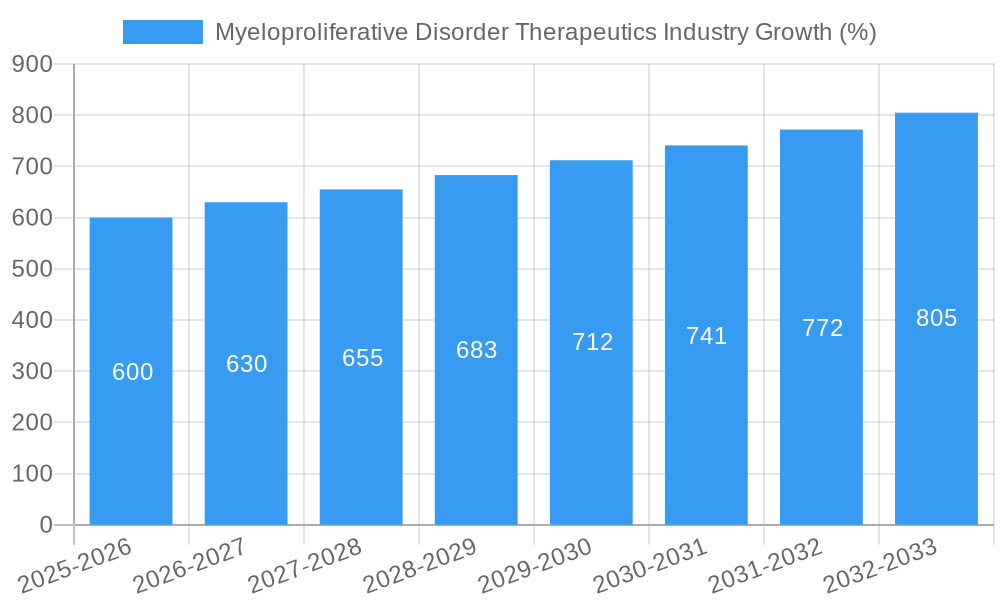
The MPD therapeutics market is experiencing robust growth, driven by factors such as the increasing prevalence of MPDs, rising healthcare expenditure, and the ongoing development of innovative therapies. The Compound Annual Growth Rate (CAGR) for the forecast period (2025-2033) is estimated at xx%, indicating a significant expansion in market size. Market penetration of newer therapies, such as JAK inhibitors, is increasing steadily. Technological disruptions, including advancements in gene therapy and personalized medicine, are expected to further fuel market expansion. Consumer preferences are shifting towards less toxic and more targeted treatment options, driving demand for innovative therapies with improved efficacy and safety profiles. The competitive dynamics are intense, with established pharmaceutical companies and emerging biotech firms vying for market share through research and development, strategic partnerships, and product launches. The market's trajectory is also shaped by changes in reimbursement policies and healthcare access. The full report will provide a more detailed analysis of each of these aspects.
Dominant Markets & Segments in Myeloproliferative Disorder Therapeutics Industry
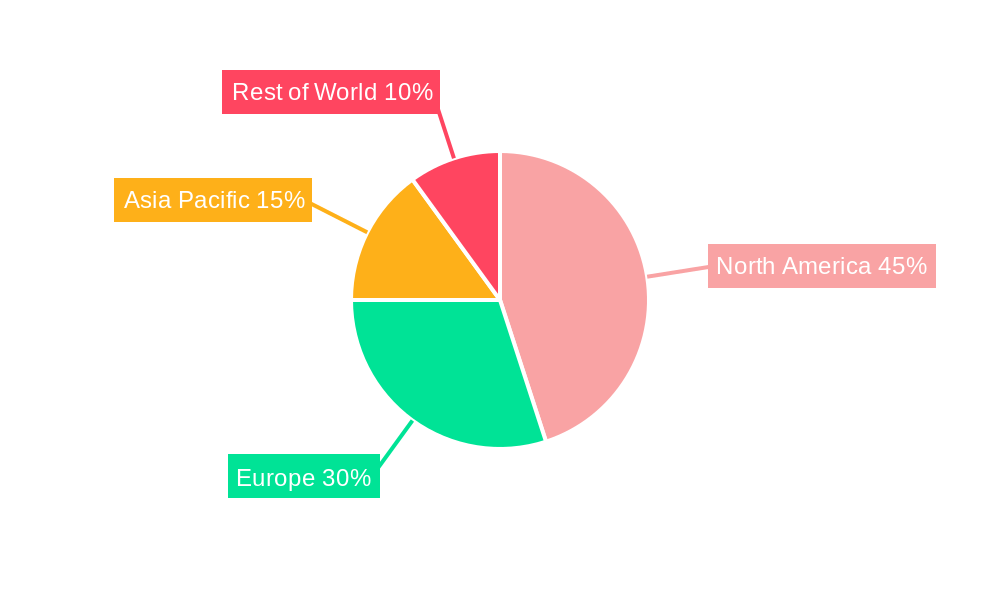
- Leading Region/Country: North America currently dominates the MPD therapeutics market, driven by high healthcare expenditure, advanced healthcare infrastructure, and a large patient population. However, the Asia-Pacific region is anticipated to witness substantial growth during the forecast period.
- Type of MPD: Myelofibrosis represents a significant segment due to the severity of the disease and the unmet medical needs. Polycythemia vera and essential thrombocythemia also constitute substantial market segments.
- Key Drivers for Myelofibrosis: High prevalence, unmet medical needs, and approvals of newer therapies.
- Key Drivers for Polycythemia Vera: Increasing awareness, growing patient population, and availability of targeted treatments.
- Key Drivers for Essential Thrombocythemia: Similar to Polycythemia Vera, with a focus on improved management strategies.
- Treatment: Immunotherapy and targeted therapies, such as JAK inhibitors, are leading the treatment segment due to their efficacy and improved safety profiles. Stem cell transplantation remains a crucial treatment option for specific patient populations.
- Key Drivers for Immunotherapy: Growing understanding of the disease's immunologic mechanisms.
- Key Drivers for Targeted Therapies: Improved efficacy and reduced side effects compared to conventional chemotherapy.
- End User: Hospitals and specialty clinics are major end users, driving the demand for advanced diagnostic and therapeutic services.
The dominance analysis provided in the full report will give detailed insight into the relative market shares of the segments above.
Myeloproliferative Disorder Therapeutics Industry Product Developments
Recent product innovations focus on targeted therapies, such as JAK inhibitors and other kinase inhibitors, aiming to improve patient outcomes and minimize adverse effects. These newer agents offer improved efficacy and selectivity, enhancing the treatment landscape. The market is also witnessing a growing interest in combination therapies and personalized medicine approaches. The focus is on developing drugs that can specifically target the underlying molecular mechanisms of MPDs, leading to more effective and safer treatments.
Report Scope & Segmentation Analysis
This report comprehensively segments the MPD therapeutics market by type of MPD (Polycythemia Vera, Essential Thrombocythemia, Myelofibrosis, Other Types of MPD), treatment modality (Chemotherapy, Immunotherapy, Stem Cell Transplantation, Other Treatments), and end-user (Hospitals, Specialty Clinics, Other End Users). Each segment’s analysis provides market size estimations, growth projections for the forecast period (2025-2033), and a competitive landscape analysis. The full report provides detailed data on market size and growth for each segment.
Key Drivers of Myeloproliferative Disorder Therapeutics Industry Growth
The growth of the MPD therapeutics market is primarily driven by the increasing prevalence of MPDs globally, an aging population, and the rising demand for effective and targeted treatment options. Advancements in research and development, leading to innovative therapies with improved efficacy and safety profiles, also contribute significantly. Favorable regulatory environments and increasing healthcare spending further bolster market growth.
Challenges in the Myeloproliferative Disorder Therapeutics Industry Sector
The MPD therapeutics market faces several challenges, including the high cost of innovative therapies, the need for longer-term clinical trial data to fully assess their efficacy and safety, and the complexities of managing adverse effects associated with some treatments. Competition among existing and emerging players, as well as potential reimbursement and access challenges in certain markets, also present barriers to growth. These are estimated to reduce market growth by xx% in the coming years.
Emerging Opportunities in Myeloproliferative Disorder Therapeutics Industry
The MPD therapeutics market presents various opportunities, such as the potential for personalized medicine approaches based on genetic profiling, the development of novel combination therapies, and the exploration of promising treatment modalities like gene therapy and immune checkpoint inhibitors. Expanding into emerging markets with unmet medical needs also represents a significant opportunity for growth.
Leading Players in the Myeloproliferative Disorder Therapeutics Industry Market
- Pfizer
- Novartis AG
- Teva Pharmaceuticals
- Bristol-Myers Squibb
- Incyte Corporation
- AbbVie
- Takeda Pharmaceutical Company Limited
- Viatris (Mylan N V)
Key Developments in Myeloproliferative Disorder Therapeutics Industry Industry
- December 2021: The FDA approved ropeginterferon α-2b [Besremi] for the treatment of polycythemia vera. This approval broadened treatment options for this MPD.
- February 2022: The FDA approved pacritinib (Vonjo) for intermediate or high-risk primary or secondary myelofibrosis, particularly beneficial for patients with thrombocytopenia. This marked a significant advancement in treating myelofibrosis.
Strategic Outlook for Myeloproliferative Disorder Therapeutics Market
The future of the MPD therapeutics market appears promising, driven by ongoing research and development efforts focused on improving treatment efficacy and safety. The continued emergence of novel therapies and the growing adoption of personalized medicine strategies will further propel market growth. Strategic collaborations between pharmaceutical companies and research institutions will play a crucial role in accelerating innovation and expanding treatment options for patients with MPDs. The focus on developing less toxic and more targeted therapies will remain a key driver of future market expansion.
Myeloproliferative Disorder Therapeutics Industry Segmentation
-
1. Type of MPD
- 1.1. Polycythaemia Vera
- 1.2. Essential Thrombocythemia
- 1.3. Myelofibrosis
- 1.4. Other Types of MPD
-
2. Treatment
- 2.1. Chemotherapy
- 2.2. Immunotherapy
- 2.3. Stem Cell Transplantation
- 2.4. Other Treatments
-
3. End User
- 3.1. Hospitals
- 3.2. Specialty Clinics
- 3.3. Other End Users
Myeloproliferative Disorder Therapeutics Industry Segmentation By Geography
-
1. North America
- 1.1. United States
- 1.2. Canada
- 1.3. Mexico
-
2. Europe
- 2.1. Germany
- 2.2. United Kingdom
- 2.3. France
- 2.4. Italy
- 2.5. Spain
- 2.6. Rest of Europe
-
3. Asia Pacific
- 3.1. China
- 3.2. Japan
- 3.3. India
- 3.4. Australia
- 3.5. South Korea
- 3.6. Rest of Asia Pacific
- 4. Middle East
-
5. GCC
- 5.1. South Africa
- 5.2. Rest of Middle East
-
6. South America
- 6.1. Brazil
- 6.2. Argentina
- 6.3. Rest of South America
Myeloproliferative Disorder Therapeutics Industry REPORT HIGHLIGHTS
| Aspects | Details |
|---|---|
| Study Period | 2019-2033 |
| Base Year | 2024 |
| Estimated Year | 2025 |
| Forecast Period | 2025-2033 |
| Historical Period | 2019-2024 |
| Growth Rate | CAGR of 4.90% from 2019-2033 |
| Segmentation |
|
Table of Contents
- 1. Introduction
- 1.1. Research Scope
- 1.2. Market Segmentation
- 1.3. Research Methodology
- 1.4. Definitions and Assumptions
- 2. Executive Summary
- 2.1. Introduction
- 3. Market Dynamics
- 3.1. Introduction
- 3.2. Market Drivers
- 3.2.1. Increasing Research and Development Investments for Developing Novel Treatments; Strong Presence of Pipeline Drugs
- 3.3. Market Restrains
- 3.3.1. Side Effects Associated with Medications
- 3.4. Market Trends
- 3.4.1. Myelofibrosis Segment is Expected to Witness Growth Over the Forecast Period
- 4. Market Factor Analysis
- 4.1. Porters Five Forces
- 4.2. Supply/Value Chain
- 4.3. PESTEL analysis
- 4.4. Market Entropy
- 4.5. Patent/Trademark Analysis
- 5. Global Myeloproliferative Disorder Therapeutics Industry Analysis, Insights and Forecast, 2019-2031
- 5.1. Market Analysis, Insights and Forecast - by Type of MPD
- 5.1.1. Polycythaemia Vera
- 5.1.2. Essential Thrombocythemia
- 5.1.3. Myelofibrosis
- 5.1.4. Other Types of MPD
- 5.2. Market Analysis, Insights and Forecast - by Treatment
- 5.2.1. Chemotherapy
- 5.2.2. Immunotherapy
- 5.2.3. Stem Cell Transplantation
- 5.2.4. Other Treatments
- 5.3. Market Analysis, Insights and Forecast - by End User
- 5.3.1. Hospitals
- 5.3.2. Specialty Clinics
- 5.3.3. Other End Users
- 5.4. Market Analysis, Insights and Forecast - by Region
- 5.4.1. North America
- 5.4.2. Europe
- 5.4.3. Asia Pacific
- 5.4.4. Middle East
- 5.4.5. GCC
- 5.4.6. South America
- 5.1. Market Analysis, Insights and Forecast - by Type of MPD
- 6. North America Myeloproliferative Disorder Therapeutics Industry Analysis, Insights and Forecast, 2019-2031
- 6.1. Market Analysis, Insights and Forecast - by Type of MPD
- 6.1.1. Polycythaemia Vera
- 6.1.2. Essential Thrombocythemia
- 6.1.3. Myelofibrosis
- 6.1.4. Other Types of MPD
- 6.2. Market Analysis, Insights and Forecast - by Treatment
- 6.2.1. Chemotherapy
- 6.2.2. Immunotherapy
- 6.2.3. Stem Cell Transplantation
- 6.2.4. Other Treatments
- 6.3. Market Analysis, Insights and Forecast - by End User
- 6.3.1. Hospitals
- 6.3.2. Specialty Clinics
- 6.3.3. Other End Users
- 6.1. Market Analysis, Insights and Forecast - by Type of MPD
- 7. Europe Myeloproliferative Disorder Therapeutics Industry Analysis, Insights and Forecast, 2019-2031
- 7.1. Market Analysis, Insights and Forecast - by Type of MPD
- 7.1.1. Polycythaemia Vera
- 7.1.2. Essential Thrombocythemia
- 7.1.3. Myelofibrosis
- 7.1.4. Other Types of MPD
- 7.2. Market Analysis, Insights and Forecast - by Treatment
- 7.2.1. Chemotherapy
- 7.2.2. Immunotherapy
- 7.2.3. Stem Cell Transplantation
- 7.2.4. Other Treatments
- 7.3. Market Analysis, Insights and Forecast - by End User
- 7.3.1. Hospitals
- 7.3.2. Specialty Clinics
- 7.3.3. Other End Users
- 7.1. Market Analysis, Insights and Forecast - by Type of MPD
- 8. Asia Pacific Myeloproliferative Disorder Therapeutics Industry Analysis, Insights and Forecast, 2019-2031
- 8.1. Market Analysis, Insights and Forecast - by Type of MPD
- 8.1.1. Polycythaemia Vera
- 8.1.2. Essential Thrombocythemia
- 8.1.3. Myelofibrosis
- 8.1.4. Other Types of MPD
- 8.2. Market Analysis, Insights and Forecast - by Treatment
- 8.2.1. Chemotherapy
- 8.2.2. Immunotherapy
- 8.2.3. Stem Cell Transplantation
- 8.2.4. Other Treatments
- 8.3. Market Analysis, Insights and Forecast - by End User
- 8.3.1. Hospitals
- 8.3.2. Specialty Clinics
- 8.3.3. Other End Users
- 8.1. Market Analysis, Insights and Forecast - by Type of MPD
- 9. Middle East Myeloproliferative Disorder Therapeutics Industry Analysis, Insights and Forecast, 2019-2031
- 9.1. Market Analysis, Insights and Forecast - by Type of MPD
- 9.1.1. Polycythaemia Vera
- 9.1.2. Essential Thrombocythemia
- 9.1.3. Myelofibrosis
- 9.1.4. Other Types of MPD
- 9.2. Market Analysis, Insights and Forecast - by Treatment
- 9.2.1. Chemotherapy
- 9.2.2. Immunotherapy
- 9.2.3. Stem Cell Transplantation
- 9.2.4. Other Treatments
- 9.3. Market Analysis, Insights and Forecast - by End User
- 9.3.1. Hospitals
- 9.3.2. Specialty Clinics
- 9.3.3. Other End Users
- 9.1. Market Analysis, Insights and Forecast - by Type of MPD
- 10. GCC Myeloproliferative Disorder Therapeutics Industry Analysis, Insights and Forecast, 2019-2031
- 10.1. Market Analysis, Insights and Forecast - by Type of MPD
- 10.1.1. Polycythaemia Vera
- 10.1.2. Essential Thrombocythemia
- 10.1.3. Myelofibrosis
- 10.1.4. Other Types of MPD
- 10.2. Market Analysis, Insights and Forecast - by Treatment
- 10.2.1. Chemotherapy
- 10.2.2. Immunotherapy
- 10.2.3. Stem Cell Transplantation
- 10.2.4. Other Treatments
- 10.3. Market Analysis, Insights and Forecast - by End User
- 10.3.1. Hospitals
- 10.3.2. Specialty Clinics
- 10.3.3. Other End Users
- 10.1. Market Analysis, Insights and Forecast - by Type of MPD
- 11. South America Myeloproliferative Disorder Therapeutics Industry Analysis, Insights and Forecast, 2019-2031
- 11.1. Market Analysis, Insights and Forecast - by Type of MPD
- 11.1.1. Polycythaemia Vera
- 11.1.2. Essential Thrombocythemia
- 11.1.3. Myelofibrosis
- 11.1.4. Other Types of MPD
- 11.2. Market Analysis, Insights and Forecast - by Treatment
- 11.2.1. Chemotherapy
- 11.2.2. Immunotherapy
- 11.2.3. Stem Cell Transplantation
- 11.2.4. Other Treatments
- 11.3. Market Analysis, Insights and Forecast - by End User
- 11.3.1. Hospitals
- 11.3.2. Specialty Clinics
- 11.3.3. Other End Users
- 11.1. Market Analysis, Insights and Forecast - by Type of MPD
- 12. North America Myeloproliferative Disorder Therapeutics Industry Analysis, Insights and Forecast, 2019-2031
- 12.1. Market Analysis, Insights and Forecast - By Country/Sub-region
- 12.1.1 United States
- 12.1.2 Canada
- 12.1.3 Mexico
- 13. Europe Myeloproliferative Disorder Therapeutics Industry Analysis, Insights and Forecast, 2019-2031
- 13.1. Market Analysis, Insights and Forecast - By Country/Sub-region
- 13.1.1 Germany
- 13.1.2 United Kingdom
- 13.1.3 France
- 13.1.4 Italy
- 13.1.5 Spain
- 13.1.6 Rest of Europe
- 14. Asia Pacific Myeloproliferative Disorder Therapeutics Industry Analysis, Insights and Forecast, 2019-2031
- 14.1. Market Analysis, Insights and Forecast - By Country/Sub-region
- 14.1.1 China
- 14.1.2 Japan
- 14.1.3 India
- 14.1.4 Australia
- 14.1.5 South Korea
- 14.1.6 Rest of Asia Pacific
- 15. Middle East Myeloproliferative Disorder Therapeutics Industry Analysis, Insights and Forecast, 2019-2031
- 15.1. Market Analysis, Insights and Forecast - By Country/Sub-region
- 15.1.1.
- 16. GCC Myeloproliferative Disorder Therapeutics Industry Analysis, Insights and Forecast, 2019-2031
- 16.1. Market Analysis, Insights and Forecast - By Country/Sub-region
- 16.1.1 South Africa
- 16.1.2 Rest of Middle East
- 17. South America Myeloproliferative Disorder Therapeutics Industry Analysis, Insights and Forecast, 2019-2031
- 17.1. Market Analysis, Insights and Forecast - By Country/Sub-region
- 17.1.1 Brazil
- 17.1.2 Argentina
- 17.1.3 Rest of South America
- 18. Competitive Analysis
- 18.1. Global Market Share Analysis 2024
- 18.2. Company Profiles
- 18.2.1 Pfizer
- 18.2.1.1. Overview
- 18.2.1.2. Products
- 18.2.1.3. SWOT Analysis
- 18.2.1.4. Recent Developments
- 18.2.1.5. Financials (Based on Availability)
- 18.2.2 Novartis AG
- 18.2.2.1. Overview
- 18.2.2.2. Products
- 18.2.2.3. SWOT Analysis
- 18.2.2.4. Recent Developments
- 18.2.2.5. Financials (Based on Availability)
- 18.2.3 Teva Pharmaceuticals
- 18.2.3.1. Overview
- 18.2.3.2. Products
- 18.2.3.3. SWOT Analysis
- 18.2.3.4. Recent Developments
- 18.2.3.5. Financials (Based on Availability)
- 18.2.4 Bristol-Myers Squibb
- 18.2.4.1. Overview
- 18.2.4.2. Products
- 18.2.4.3. SWOT Analysis
- 18.2.4.4. Recent Developments
- 18.2.4.5. Financials (Based on Availability)
- 18.2.5 Incyte Corporation
- 18.2.5.1. Overview
- 18.2.5.2. Products
- 18.2.5.3. SWOT Analysis
- 18.2.5.4. Recent Developments
- 18.2.5.5. Financials (Based on Availability)
- 18.2.6 AbbVie
- 18.2.6.1. Overview
- 18.2.6.2. Products
- 18.2.6.3. SWOT Analysis
- 18.2.6.4. Recent Developments
- 18.2.6.5. Financials (Based on Availability)
- 18.2.7 Takeda Pharmaceutical Company Limited
- 18.2.7.1. Overview
- 18.2.7.2. Products
- 18.2.7.3. SWOT Analysis
- 18.2.7.4. Recent Developments
- 18.2.7.5. Financials (Based on Availability)
- 18.2.8 Viatris (Mylan N V )
- 18.2.8.1. Overview
- 18.2.8.2. Products
- 18.2.8.3. SWOT Analysis
- 18.2.8.4. Recent Developments
- 18.2.8.5. Financials (Based on Availability)
- 18.2.1 Pfizer
List of Figures
- Figure 1: Global Myeloproliferative Disorder Therapeutics Industry Revenue Breakdown (Million, %) by Region 2024 & 2032
- Figure 2: Global Myeloproliferative Disorder Therapeutics Industry Volume Breakdown (K Unit, %) by Region 2024 & 2032
- Figure 3: North America Myeloproliferative Disorder Therapeutics Industry Revenue (Million), by Country 2024 & 2032
- Figure 4: North America Myeloproliferative Disorder Therapeutics Industry Volume (K Unit), by Country 2024 & 2032
- Figure 5: North America Myeloproliferative Disorder Therapeutics Industry Revenue Share (%), by Country 2024 & 2032
- Figure 6: North America Myeloproliferative Disorder Therapeutics Industry Volume Share (%), by Country 2024 & 2032
- Figure 7: Europe Myeloproliferative Disorder Therapeutics Industry Revenue (Million), by Country 2024 & 2032
- Figure 8: Europe Myeloproliferative Disorder Therapeutics Industry Volume (K Unit), by Country 2024 & 2032
- Figure 9: Europe Myeloproliferative Disorder Therapeutics Industry Revenue Share (%), by Country 2024 & 2032
- Figure 10: Europe Myeloproliferative Disorder Therapeutics Industry Volume Share (%), by Country 2024 & 2032
- Figure 11: Asia Pacific Myeloproliferative Disorder Therapeutics Industry Revenue (Million), by Country 2024 & 2032
- Figure 12: Asia Pacific Myeloproliferative Disorder Therapeutics Industry Volume (K Unit), by Country 2024 & 2032
- Figure 13: Asia Pacific Myeloproliferative Disorder Therapeutics Industry Revenue Share (%), by Country 2024 & 2032
- Figure 14: Asia Pacific Myeloproliferative Disorder Therapeutics Industry Volume Share (%), by Country 2024 & 2032
- Figure 15: Middle East Myeloproliferative Disorder Therapeutics Industry Revenue (Million), by Country 2024 & 2032
- Figure 16: Middle East Myeloproliferative Disorder Therapeutics Industry Volume (K Unit), by Country 2024 & 2032
- Figure 17: Middle East Myeloproliferative Disorder Therapeutics Industry Revenue Share (%), by Country 2024 & 2032
- Figure 18: Middle East Myeloproliferative Disorder Therapeutics Industry Volume Share (%), by Country 2024 & 2032
- Figure 19: GCC Myeloproliferative Disorder Therapeutics Industry Revenue (Million), by Country 2024 & 2032
- Figure 20: GCC Myeloproliferative Disorder Therapeutics Industry Volume (K Unit), by Country 2024 & 2032
- Figure 21: GCC Myeloproliferative Disorder Therapeutics Industry Revenue Share (%), by Country 2024 & 2032
- Figure 22: GCC Myeloproliferative Disorder Therapeutics Industry Volume Share (%), by Country 2024 & 2032
- Figure 23: South America Myeloproliferative Disorder Therapeutics Industry Revenue (Million), by Country 2024 & 2032
- Figure 24: South America Myeloproliferative Disorder Therapeutics Industry Volume (K Unit), by Country 2024 & 2032
- Figure 25: South America Myeloproliferative Disorder Therapeutics Industry Revenue Share (%), by Country 2024 & 2032
- Figure 26: South America Myeloproliferative Disorder Therapeutics Industry Volume Share (%), by Country 2024 & 2032
- Figure 27: North America Myeloproliferative Disorder Therapeutics Industry Revenue (Million), by Type of MPD 2024 & 2032
- Figure 28: North America Myeloproliferative Disorder Therapeutics Industry Volume (K Unit), by Type of MPD 2024 & 2032
- Figure 29: North America Myeloproliferative Disorder Therapeutics Industry Revenue Share (%), by Type of MPD 2024 & 2032
- Figure 30: North America Myeloproliferative Disorder Therapeutics Industry Volume Share (%), by Type of MPD 2024 & 2032
- Figure 31: North America Myeloproliferative Disorder Therapeutics Industry Revenue (Million), by Treatment 2024 & 2032
- Figure 32: North America Myeloproliferative Disorder Therapeutics Industry Volume (K Unit), by Treatment 2024 & 2032
- Figure 33: North America Myeloproliferative Disorder Therapeutics Industry Revenue Share (%), by Treatment 2024 & 2032
- Figure 34: North America Myeloproliferative Disorder Therapeutics Industry Volume Share (%), by Treatment 2024 & 2032
- Figure 35: North America Myeloproliferative Disorder Therapeutics Industry Revenue (Million), by End User 2024 & 2032
- Figure 36: North America Myeloproliferative Disorder Therapeutics Industry Volume (K Unit), by End User 2024 & 2032
- Figure 37: North America Myeloproliferative Disorder Therapeutics Industry Revenue Share (%), by End User 2024 & 2032
- Figure 38: North America Myeloproliferative Disorder Therapeutics Industry Volume Share (%), by End User 2024 & 2032
- Figure 39: North America Myeloproliferative Disorder Therapeutics Industry Revenue (Million), by Country 2024 & 2032
- Figure 40: North America Myeloproliferative Disorder Therapeutics Industry Volume (K Unit), by Country 2024 & 2032
- Figure 41: North America Myeloproliferative Disorder Therapeutics Industry Revenue Share (%), by Country 2024 & 2032
- Figure 42: North America Myeloproliferative Disorder Therapeutics Industry Volume Share (%), by Country 2024 & 2032
- Figure 43: Europe Myeloproliferative Disorder Therapeutics Industry Revenue (Million), by Type of MPD 2024 & 2032
- Figure 44: Europe Myeloproliferative Disorder Therapeutics Industry Volume (K Unit), by Type of MPD 2024 & 2032
- Figure 45: Europe Myeloproliferative Disorder Therapeutics Industry Revenue Share (%), by Type of MPD 2024 & 2032
- Figure 46: Europe Myeloproliferative Disorder Therapeutics Industry Volume Share (%), by Type of MPD 2024 & 2032
- Figure 47: Europe Myeloproliferative Disorder Therapeutics Industry Revenue (Million), by Treatment 2024 & 2032
- Figure 48: Europe Myeloproliferative Disorder Therapeutics Industry Volume (K Unit), by Treatment 2024 & 2032
- Figure 49: Europe Myeloproliferative Disorder Therapeutics Industry Revenue Share (%), by Treatment 2024 & 2032
- Figure 50: Europe Myeloproliferative Disorder Therapeutics Industry Volume Share (%), by Treatment 2024 & 2032
- Figure 51: Europe Myeloproliferative Disorder Therapeutics Industry Revenue (Million), by End User 2024 & 2032
- Figure 52: Europe Myeloproliferative Disorder Therapeutics Industry Volume (K Unit), by End User 2024 & 2032
- Figure 53: Europe Myeloproliferative Disorder Therapeutics Industry Revenue Share (%), by End User 2024 & 2032
- Figure 54: Europe Myeloproliferative Disorder Therapeutics Industry Volume Share (%), by End User 2024 & 2032
- Figure 55: Europe Myeloproliferative Disorder Therapeutics Industry Revenue (Million), by Country 2024 & 2032
- Figure 56: Europe Myeloproliferative Disorder Therapeutics Industry Volume (K Unit), by Country 2024 & 2032
- Figure 57: Europe Myeloproliferative Disorder Therapeutics Industry Revenue Share (%), by Country 2024 & 2032
- Figure 58: Europe Myeloproliferative Disorder Therapeutics Industry Volume Share (%), by Country 2024 & 2032
- Figure 59: Asia Pacific Myeloproliferative Disorder Therapeutics Industry Revenue (Million), by Type of MPD 2024 & 2032
- Figure 60: Asia Pacific Myeloproliferative Disorder Therapeutics Industry Volume (K Unit), by Type of MPD 2024 & 2032
- Figure 61: Asia Pacific Myeloproliferative Disorder Therapeutics Industry Revenue Share (%), by Type of MPD 2024 & 2032
- Figure 62: Asia Pacific Myeloproliferative Disorder Therapeutics Industry Volume Share (%), by Type of MPD 2024 & 2032
- Figure 63: Asia Pacific Myeloproliferative Disorder Therapeutics Industry Revenue (Million), by Treatment 2024 & 2032
- Figure 64: Asia Pacific Myeloproliferative Disorder Therapeutics Industry Volume (K Unit), by Treatment 2024 & 2032
- Figure 65: Asia Pacific Myeloproliferative Disorder Therapeutics Industry Revenue Share (%), by Treatment 2024 & 2032
- Figure 66: Asia Pacific Myeloproliferative Disorder Therapeutics Industry Volume Share (%), by Treatment 2024 & 2032
- Figure 67: Asia Pacific Myeloproliferative Disorder Therapeutics Industry Revenue (Million), by End User 2024 & 2032
- Figure 68: Asia Pacific Myeloproliferative Disorder Therapeutics Industry Volume (K Unit), by End User 2024 & 2032
- Figure 69: Asia Pacific Myeloproliferative Disorder Therapeutics Industry Revenue Share (%), by End User 2024 & 2032
- Figure 70: Asia Pacific Myeloproliferative Disorder Therapeutics Industry Volume Share (%), by End User 2024 & 2032
- Figure 71: Asia Pacific Myeloproliferative Disorder Therapeutics Industry Revenue (Million), by Country 2024 & 2032
- Figure 72: Asia Pacific Myeloproliferative Disorder Therapeutics Industry Volume (K Unit), by Country 2024 & 2032
- Figure 73: Asia Pacific Myeloproliferative Disorder Therapeutics Industry Revenue Share (%), by Country 2024 & 2032
- Figure 74: Asia Pacific Myeloproliferative Disorder Therapeutics Industry Volume Share (%), by Country 2024 & 2032
- Figure 75: Middle East Myeloproliferative Disorder Therapeutics Industry Revenue (Million), by Type of MPD 2024 & 2032
- Figure 76: Middle East Myeloproliferative Disorder Therapeutics Industry Volume (K Unit), by Type of MPD 2024 & 2032
- Figure 77: Middle East Myeloproliferative Disorder Therapeutics Industry Revenue Share (%), by Type of MPD 2024 & 2032
- Figure 78: Middle East Myeloproliferative Disorder Therapeutics Industry Volume Share (%), by Type of MPD 2024 & 2032
- Figure 79: Middle East Myeloproliferative Disorder Therapeutics Industry Revenue (Million), by Treatment 2024 & 2032
- Figure 80: Middle East Myeloproliferative Disorder Therapeutics Industry Volume (K Unit), by Treatment 2024 & 2032
- Figure 81: Middle East Myeloproliferative Disorder Therapeutics Industry Revenue Share (%), by Treatment 2024 & 2032
- Figure 82: Middle East Myeloproliferative Disorder Therapeutics Industry Volume Share (%), by Treatment 2024 & 2032
- Figure 83: Middle East Myeloproliferative Disorder Therapeutics Industry Revenue (Million), by End User 2024 & 2032
- Figure 84: Middle East Myeloproliferative Disorder Therapeutics Industry Volume (K Unit), by End User 2024 & 2032
- Figure 85: Middle East Myeloproliferative Disorder Therapeutics Industry Revenue Share (%), by End User 2024 & 2032
- Figure 86: Middle East Myeloproliferative Disorder Therapeutics Industry Volume Share (%), by End User 2024 & 2032
- Figure 87: Middle East Myeloproliferative Disorder Therapeutics Industry Revenue (Million), by Country 2024 & 2032
- Figure 88: Middle East Myeloproliferative Disorder Therapeutics Industry Volume (K Unit), by Country 2024 & 2032
- Figure 89: Middle East Myeloproliferative Disorder Therapeutics Industry Revenue Share (%), by Country 2024 & 2032
- Figure 90: Middle East Myeloproliferative Disorder Therapeutics Industry Volume Share (%), by Country 2024 & 2032
- Figure 91: GCC Myeloproliferative Disorder Therapeutics Industry Revenue (Million), by Type of MPD 2024 & 2032
- Figure 92: GCC Myeloproliferative Disorder Therapeutics Industry Volume (K Unit), by Type of MPD 2024 & 2032
- Figure 93: GCC Myeloproliferative Disorder Therapeutics Industry Revenue Share (%), by Type of MPD 2024 & 2032
- Figure 94: GCC Myeloproliferative Disorder Therapeutics Industry Volume Share (%), by Type of MPD 2024 & 2032
- Figure 95: GCC Myeloproliferative Disorder Therapeutics Industry Revenue (Million), by Treatment 2024 & 2032
- Figure 96: GCC Myeloproliferative Disorder Therapeutics Industry Volume (K Unit), by Treatment 2024 & 2032
- Figure 97: GCC Myeloproliferative Disorder Therapeutics Industry Revenue Share (%), by Treatment 2024 & 2032
- Figure 98: GCC Myeloproliferative Disorder Therapeutics Industry Volume Share (%), by Treatment 2024 & 2032
- Figure 99: GCC Myeloproliferative Disorder Therapeutics Industry Revenue (Million), by End User 2024 & 2032
- Figure 100: GCC Myeloproliferative Disorder Therapeutics Industry Volume (K Unit), by End User 2024 & 2032
- Figure 101: GCC Myeloproliferative Disorder Therapeutics Industry Revenue Share (%), by End User 2024 & 2032
- Figure 102: GCC Myeloproliferative Disorder Therapeutics Industry Volume Share (%), by End User 2024 & 2032
- Figure 103: GCC Myeloproliferative Disorder Therapeutics Industry Revenue (Million), by Country 2024 & 2032
- Figure 104: GCC Myeloproliferative Disorder Therapeutics Industry Volume (K Unit), by Country 2024 & 2032
- Figure 105: GCC Myeloproliferative Disorder Therapeutics Industry Revenue Share (%), by Country 2024 & 2032
- Figure 106: GCC Myeloproliferative Disorder Therapeutics Industry Volume Share (%), by Country 2024 & 2032
- Figure 107: South America Myeloproliferative Disorder Therapeutics Industry Revenue (Million), by Type of MPD 2024 & 2032
- Figure 108: South America Myeloproliferative Disorder Therapeutics Industry Volume (K Unit), by Type of MPD 2024 & 2032
- Figure 109: South America Myeloproliferative Disorder Therapeutics Industry Revenue Share (%), by Type of MPD 2024 & 2032
- Figure 110: South America Myeloproliferative Disorder Therapeutics Industry Volume Share (%), by Type of MPD 2024 & 2032
- Figure 111: South America Myeloproliferative Disorder Therapeutics Industry Revenue (Million), by Treatment 2024 & 2032
- Figure 112: South America Myeloproliferative Disorder Therapeutics Industry Volume (K Unit), by Treatment 2024 & 2032
- Figure 113: South America Myeloproliferative Disorder Therapeutics Industry Revenue Share (%), by Treatment 2024 & 2032
- Figure 114: South America Myeloproliferative Disorder Therapeutics Industry Volume Share (%), by Treatment 2024 & 2032
- Figure 115: South America Myeloproliferative Disorder Therapeutics Industry Revenue (Million), by End User 2024 & 2032
- Figure 116: South America Myeloproliferative Disorder Therapeutics Industry Volume (K Unit), by End User 2024 & 2032
- Figure 117: South America Myeloproliferative Disorder Therapeutics Industry Revenue Share (%), by End User 2024 & 2032
- Figure 118: South America Myeloproliferative Disorder Therapeutics Industry Volume Share (%), by End User 2024 & 2032
- Figure 119: South America Myeloproliferative Disorder Therapeutics Industry Revenue (Million), by Country 2024 & 2032
- Figure 120: South America Myeloproliferative Disorder Therapeutics Industry Volume (K Unit), by Country 2024 & 2032
- Figure 121: South America Myeloproliferative Disorder Therapeutics Industry Revenue Share (%), by Country 2024 & 2032
- Figure 122: South America Myeloproliferative Disorder Therapeutics Industry Volume Share (%), by Country 2024 & 2032
List of Tables
- Table 1: Global Myeloproliferative Disorder Therapeutics Industry Revenue Million Forecast, by Region 2019 & 2032
- Table 2: Global Myeloproliferative Disorder Therapeutics Industry Volume K Unit Forecast, by Region 2019 & 2032
- Table 3: Global Myeloproliferative Disorder Therapeutics Industry Revenue Million Forecast, by Type of MPD 2019 & 2032
- Table 4: Global Myeloproliferative Disorder Therapeutics Industry Volume K Unit Forecast, by Type of MPD 2019 & 2032
- Table 5: Global Myeloproliferative Disorder Therapeutics Industry Revenue Million Forecast, by Treatment 2019 & 2032
- Table 6: Global Myeloproliferative Disorder Therapeutics Industry Volume K Unit Forecast, by Treatment 2019 & 2032
- Table 7: Global Myeloproliferative Disorder Therapeutics Industry Revenue Million Forecast, by End User 2019 & 2032
- Table 8: Global Myeloproliferative Disorder Therapeutics Industry Volume K Unit Forecast, by End User 2019 & 2032
- Table 9: Global Myeloproliferative Disorder Therapeutics Industry Revenue Million Forecast, by Region 2019 & 2032
- Table 10: Global Myeloproliferative Disorder Therapeutics Industry Volume K Unit Forecast, by Region 2019 & 2032
- Table 11: Global Myeloproliferative Disorder Therapeutics Industry Revenue Million Forecast, by Country 2019 & 2032
- Table 12: Global Myeloproliferative Disorder Therapeutics Industry Volume K Unit Forecast, by Country 2019 & 2032
- Table 13: United States Myeloproliferative Disorder Therapeutics Industry Revenue (Million) Forecast, by Application 2019 & 2032
- Table 14: United States Myeloproliferative Disorder Therapeutics Industry Volume (K Unit) Forecast, by Application 2019 & 2032
- Table 15: Canada Myeloproliferative Disorder Therapeutics Industry Revenue (Million) Forecast, by Application 2019 & 2032
- Table 16: Canada Myeloproliferative Disorder Therapeutics Industry Volume (K Unit) Forecast, by Application 2019 & 2032
- Table 17: Mexico Myeloproliferative Disorder Therapeutics Industry Revenue (Million) Forecast, by Application 2019 & 2032
- Table 18: Mexico Myeloproliferative Disorder Therapeutics Industry Volume (K Unit) Forecast, by Application 2019 & 2032
- Table 19: Global Myeloproliferative Disorder Therapeutics Industry Revenue Million Forecast, by Country 2019 & 2032
- Table 20: Global Myeloproliferative Disorder Therapeutics Industry Volume K Unit Forecast, by Country 2019 & 2032
- Table 21: Germany Myeloproliferative Disorder Therapeutics Industry Revenue (Million) Forecast, by Application 2019 & 2032
- Table 22: Germany Myeloproliferative Disorder Therapeutics Industry Volume (K Unit) Forecast, by Application 2019 & 2032
- Table 23: United Kingdom Myeloproliferative Disorder Therapeutics Industry Revenue (Million) Forecast, by Application 2019 & 2032
- Table 24: United Kingdom Myeloproliferative Disorder Therapeutics Industry Volume (K Unit) Forecast, by Application 2019 & 2032
- Table 25: France Myeloproliferative Disorder Therapeutics Industry Revenue (Million) Forecast, by Application 2019 & 2032
- Table 26: France Myeloproliferative Disorder Therapeutics Industry Volume (K Unit) Forecast, by Application 2019 & 2032
- Table 27: Italy Myeloproliferative Disorder Therapeutics Industry Revenue (Million) Forecast, by Application 2019 & 2032
- Table 28: Italy Myeloproliferative Disorder Therapeutics Industry Volume (K Unit) Forecast, by Application 2019 & 2032
- Table 29: Spain Myeloproliferative Disorder Therapeutics Industry Revenue (Million) Forecast, by Application 2019 & 2032
- Table 30: Spain Myeloproliferative Disorder Therapeutics Industry Volume (K Unit) Forecast, by Application 2019 & 2032
- Table 31: Rest of Europe Myeloproliferative Disorder Therapeutics Industry Revenue (Million) Forecast, by Application 2019 & 2032
- Table 32: Rest of Europe Myeloproliferative Disorder Therapeutics Industry Volume (K Unit) Forecast, by Application 2019 & 2032
- Table 33: Global Myeloproliferative Disorder Therapeutics Industry Revenue Million Forecast, by Country 2019 & 2032
- Table 34: Global Myeloproliferative Disorder Therapeutics Industry Volume K Unit Forecast, by Country 2019 & 2032
- Table 35: China Myeloproliferative Disorder Therapeutics Industry Revenue (Million) Forecast, by Application 2019 & 2032
- Table 36: China Myeloproliferative Disorder Therapeutics Industry Volume (K Unit) Forecast, by Application 2019 & 2032
- Table 37: Japan Myeloproliferative Disorder Therapeutics Industry Revenue (Million) Forecast, by Application 2019 & 2032
- Table 38: Japan Myeloproliferative Disorder Therapeutics Industry Volume (K Unit) Forecast, by Application 2019 & 2032
- Table 39: India Myeloproliferative Disorder Therapeutics Industry Revenue (Million) Forecast, by Application 2019 & 2032
- Table 40: India Myeloproliferative Disorder Therapeutics Industry Volume (K Unit) Forecast, by Application 2019 & 2032
- Table 41: Australia Myeloproliferative Disorder Therapeutics Industry Revenue (Million) Forecast, by Application 2019 & 2032
- Table 42: Australia Myeloproliferative Disorder Therapeutics Industry Volume (K Unit) Forecast, by Application 2019 & 2032
- Table 43: South Korea Myeloproliferative Disorder Therapeutics Industry Revenue (Million) Forecast, by Application 2019 & 2032
- Table 44: South Korea Myeloproliferative Disorder Therapeutics Industry Volume (K Unit) Forecast, by Application 2019 & 2032
- Table 45: Rest of Asia Pacific Myeloproliferative Disorder Therapeutics Industry Revenue (Million) Forecast, by Application 2019 & 2032
- Table 46: Rest of Asia Pacific Myeloproliferative Disorder Therapeutics Industry Volume (K Unit) Forecast, by Application 2019 & 2032
- Table 47: Global Myeloproliferative Disorder Therapeutics Industry Revenue Million Forecast, by Country 2019 & 2032
- Table 48: Global Myeloproliferative Disorder Therapeutics Industry Volume K Unit Forecast, by Country 2019 & 2032
- Table 49: Myeloproliferative Disorder Therapeutics Industry Revenue (Million) Forecast, by Application 2019 & 2032
- Table 50: Myeloproliferative Disorder Therapeutics Industry Volume (K Unit) Forecast, by Application 2019 & 2032
- Table 51: Global Myeloproliferative Disorder Therapeutics Industry Revenue Million Forecast, by Country 2019 & 2032
- Table 52: Global Myeloproliferative Disorder Therapeutics Industry Volume K Unit Forecast, by Country 2019 & 2032
- Table 53: South Africa Myeloproliferative Disorder Therapeutics Industry Revenue (Million) Forecast, by Application 2019 & 2032
- Table 54: South Africa Myeloproliferative Disorder Therapeutics Industry Volume (K Unit) Forecast, by Application 2019 & 2032
- Table 55: Rest of Middle East Myeloproliferative Disorder Therapeutics Industry Revenue (Million) Forecast, by Application 2019 & 2032
- Table 56: Rest of Middle East Myeloproliferative Disorder Therapeutics Industry Volume (K Unit) Forecast, by Application 2019 & 2032
- Table 57: Global Myeloproliferative Disorder Therapeutics Industry Revenue Million Forecast, by Country 2019 & 2032
- Table 58: Global Myeloproliferative Disorder Therapeutics Industry Volume K Unit Forecast, by Country 2019 & 2032
- Table 59: Brazil Myeloproliferative Disorder Therapeutics Industry Revenue (Million) Forecast, by Application 2019 & 2032
- Table 60: Brazil Myeloproliferative Disorder Therapeutics Industry Volume (K Unit) Forecast, by Application 2019 & 2032
- Table 61: Argentina Myeloproliferative Disorder Therapeutics Industry Revenue (Million) Forecast, by Application 2019 & 2032
- Table 62: Argentina Myeloproliferative Disorder Therapeutics Industry Volume (K Unit) Forecast, by Application 2019 & 2032
- Table 63: Rest of South America Myeloproliferative Disorder Therapeutics Industry Revenue (Million) Forecast, by Application 2019 & 2032
- Table 64: Rest of South America Myeloproliferative Disorder Therapeutics Industry Volume (K Unit) Forecast, by Application 2019 & 2032
- Table 65: Global Myeloproliferative Disorder Therapeutics Industry Revenue Million Forecast, by Type of MPD 2019 & 2032
- Table 66: Global Myeloproliferative Disorder Therapeutics Industry Volume K Unit Forecast, by Type of MPD 2019 & 2032
- Table 67: Global Myeloproliferative Disorder Therapeutics Industry Revenue Million Forecast, by Treatment 2019 & 2032
- Table 68: Global Myeloproliferative Disorder Therapeutics Industry Volume K Unit Forecast, by Treatment 2019 & 2032
- Table 69: Global Myeloproliferative Disorder Therapeutics Industry Revenue Million Forecast, by End User 2019 & 2032
- Table 70: Global Myeloproliferative Disorder Therapeutics Industry Volume K Unit Forecast, by End User 2019 & 2032
- Table 71: Global Myeloproliferative Disorder Therapeutics Industry Revenue Million Forecast, by Country 2019 & 2032
- Table 72: Global Myeloproliferative Disorder Therapeutics Industry Volume K Unit Forecast, by Country 2019 & 2032
- Table 73: United States Myeloproliferative Disorder Therapeutics Industry Revenue (Million) Forecast, by Application 2019 & 2032
- Table 74: United States Myeloproliferative Disorder Therapeutics Industry Volume (K Unit) Forecast, by Application 2019 & 2032
- Table 75: Canada Myeloproliferative Disorder Therapeutics Industry Revenue (Million) Forecast, by Application 2019 & 2032
- Table 76: Canada Myeloproliferative Disorder Therapeutics Industry Volume (K Unit) Forecast, by Application 2019 & 2032
- Table 77: Mexico Myeloproliferative Disorder Therapeutics Industry Revenue (Million) Forecast, by Application 2019 & 2032
- Table 78: Mexico Myeloproliferative Disorder Therapeutics Industry Volume (K Unit) Forecast, by Application 2019 & 2032
- Table 79: Global Myeloproliferative Disorder Therapeutics Industry Revenue Million Forecast, by Type of MPD 2019 & 2032
- Table 80: Global Myeloproliferative Disorder Therapeutics Industry Volume K Unit Forecast, by Type of MPD 2019 & 2032
- Table 81: Global Myeloproliferative Disorder Therapeutics Industry Revenue Million Forecast, by Treatment 2019 & 2032
- Table 82: Global Myeloproliferative Disorder Therapeutics Industry Volume K Unit Forecast, by Treatment 2019 & 2032
- Table 83: Global Myeloproliferative Disorder Therapeutics Industry Revenue Million Forecast, by End User 2019 & 2032
- Table 84: Global Myeloproliferative Disorder Therapeutics Industry Volume K Unit Forecast, by End User 2019 & 2032
- Table 85: Global Myeloproliferative Disorder Therapeutics Industry Revenue Million Forecast, by Country 2019 & 2032
- Table 86: Global Myeloproliferative Disorder Therapeutics Industry Volume K Unit Forecast, by Country 2019 & 2032
- Table 87: Germany Myeloproliferative Disorder Therapeutics Industry Revenue (Million) Forecast, by Application 2019 & 2032
- Table 88: Germany Myeloproliferative Disorder Therapeutics Industry Volume (K Unit) Forecast, by Application 2019 & 2032
- Table 89: United Kingdom Myeloproliferative Disorder Therapeutics Industry Revenue (Million) Forecast, by Application 2019 & 2032
- Table 90: United Kingdom Myeloproliferative Disorder Therapeutics Industry Volume (K Unit) Forecast, by Application 2019 & 2032
- Table 91: France Myeloproliferative Disorder Therapeutics Industry Revenue (Million) Forecast, by Application 2019 & 2032
- Table 92: France Myeloproliferative Disorder Therapeutics Industry Volume (K Unit) Forecast, by Application 2019 & 2032
- Table 93: Italy Myeloproliferative Disorder Therapeutics Industry Revenue (Million) Forecast, by Application 2019 & 2032
- Table 94: Italy Myeloproliferative Disorder Therapeutics Industry Volume (K Unit) Forecast, by Application 2019 & 2032
- Table 95: Spain Myeloproliferative Disorder Therapeutics Industry Revenue (Million) Forecast, by Application 2019 & 2032
- Table 96: Spain Myeloproliferative Disorder Therapeutics Industry Volume (K Unit) Forecast, by Application 2019 & 2032
- Table 97: Rest of Europe Myeloproliferative Disorder Therapeutics Industry Revenue (Million) Forecast, by Application 2019 & 2032
- Table 98: Rest of Europe Myeloproliferative Disorder Therapeutics Industry Volume (K Unit) Forecast, by Application 2019 & 2032
- Table 99: Global Myeloproliferative Disorder Therapeutics Industry Revenue Million Forecast, by Type of MPD 2019 & 2032
- Table 100: Global Myeloproliferative Disorder Therapeutics Industry Volume K Unit Forecast, by Type of MPD 2019 & 2032
- Table 101: Global Myeloproliferative Disorder Therapeutics Industry Revenue Million Forecast, by Treatment 2019 & 2032
- Table 102: Global Myeloproliferative Disorder Therapeutics Industry Volume K Unit Forecast, by Treatment 2019 & 2032
- Table 103: Global Myeloproliferative Disorder Therapeutics Industry Revenue Million Forecast, by End User 2019 & 2032
- Table 104: Global Myeloproliferative Disorder Therapeutics Industry Volume K Unit Forecast, by End User 2019 & 2032
- Table 105: Global Myeloproliferative Disorder Therapeutics Industry Revenue Million Forecast, by Country 2019 & 2032
- Table 106: Global Myeloproliferative Disorder Therapeutics Industry Volume K Unit Forecast, by Country 2019 & 2032
- Table 107: China Myeloproliferative Disorder Therapeutics Industry Revenue (Million) Forecast, by Application 2019 & 2032
- Table 108: China Myeloproliferative Disorder Therapeutics Industry Volume (K Unit) Forecast, by Application 2019 & 2032
- Table 109: Japan Myeloproliferative Disorder Therapeutics Industry Revenue (Million) Forecast, by Application 2019 & 2032
- Table 110: Japan Myeloproliferative Disorder Therapeutics Industry Volume (K Unit) Forecast, by Application 2019 & 2032
- Table 111: India Myeloproliferative Disorder Therapeutics Industry Revenue (Million) Forecast, by Application 2019 & 2032
- Table 112: India Myeloproliferative Disorder Therapeutics Industry Volume (K Unit) Forecast, by Application 2019 & 2032
- Table 113: Australia Myeloproliferative Disorder Therapeutics Industry Revenue (Million) Forecast, by Application 2019 & 2032
- Table 114: Australia Myeloproliferative Disorder Therapeutics Industry Volume (K Unit) Forecast, by Application 2019 & 2032
- Table 115: South Korea Myeloproliferative Disorder Therapeutics Industry Revenue (Million) Forecast, by Application 2019 & 2032
- Table 116: South Korea Myeloproliferative Disorder Therapeutics Industry Volume (K Unit) Forecast, by Application 2019 & 2032
- Table 117: Rest of Asia Pacific Myeloproliferative Disorder Therapeutics Industry Revenue (Million) Forecast, by Application 2019 & 2032
- Table 118: Rest of Asia Pacific Myeloproliferative Disorder Therapeutics Industry Volume (K Unit) Forecast, by Application 2019 & 2032
- Table 119: Global Myeloproliferative Disorder Therapeutics Industry Revenue Million Forecast, by Type of MPD 2019 & 2032
- Table 120: Global Myeloproliferative Disorder Therapeutics Industry Volume K Unit Forecast, by Type of MPD 2019 & 2032
- Table 121: Global Myeloproliferative Disorder Therapeutics Industry Revenue Million Forecast, by Treatment 2019 & 2032
- Table 122: Global Myeloproliferative Disorder Therapeutics Industry Volume K Unit Forecast, by Treatment 2019 & 2032
- Table 123: Global Myeloproliferative Disorder Therapeutics Industry Revenue Million Forecast, by End User 2019 & 2032
- Table 124: Global Myeloproliferative Disorder Therapeutics Industry Volume K Unit Forecast, by End User 2019 & 2032
- Table 125: Global Myeloproliferative Disorder Therapeutics Industry Revenue Million Forecast, by Country 2019 & 2032
- Table 126: Global Myeloproliferative Disorder Therapeutics Industry Volume K Unit Forecast, by Country 2019 & 2032
- Table 127: Global Myeloproliferative Disorder Therapeutics Industry Revenue Million Forecast, by Type of MPD 2019 & 2032
- Table 128: Global Myeloproliferative Disorder Therapeutics Industry Volume K Unit Forecast, by Type of MPD 2019 & 2032
- Table 129: Global Myeloproliferative Disorder Therapeutics Industry Revenue Million Forecast, by Treatment 2019 & 2032
- Table 130: Global Myeloproliferative Disorder Therapeutics Industry Volume K Unit Forecast, by Treatment 2019 & 2032
- Table 131: Global Myeloproliferative Disorder Therapeutics Industry Revenue Million Forecast, by End User 2019 & 2032
- Table 132: Global Myeloproliferative Disorder Therapeutics Industry Volume K Unit Forecast, by End User 2019 & 2032
- Table 133: Global Myeloproliferative Disorder Therapeutics Industry Revenue Million Forecast, by Country 2019 & 2032
- Table 134: Global Myeloproliferative Disorder Therapeutics Industry Volume K Unit Forecast, by Country 2019 & 2032
- Table 135: South Africa Myeloproliferative Disorder Therapeutics Industry Revenue (Million) Forecast, by Application 2019 & 2032
- Table 136: South Africa Myeloproliferative Disorder Therapeutics Industry Volume (K Unit) Forecast, by Application 2019 & 2032
- Table 137: Rest of Middle East Myeloproliferative Disorder Therapeutics Industry Revenue (Million) Forecast, by Application 2019 & 2032
- Table 138: Rest of Middle East Myeloproliferative Disorder Therapeutics Industry Volume (K Unit) Forecast, by Application 2019 & 2032
- Table 139: Global Myeloproliferative Disorder Therapeutics Industry Revenue Million Forecast, by Type of MPD 2019 & 2032
- Table 140: Global Myeloproliferative Disorder Therapeutics Industry Volume K Unit Forecast, by Type of MPD 2019 & 2032
- Table 141: Global Myeloproliferative Disorder Therapeutics Industry Revenue Million Forecast, by Treatment 2019 & 2032
- Table 142: Global Myeloproliferative Disorder Therapeutics Industry Volume K Unit Forecast, by Treatment 2019 & 2032
- Table 143: Global Myeloproliferative Disorder Therapeutics Industry Revenue Million Forecast, by End User 2019 & 2032
- Table 144: Global Myeloproliferative Disorder Therapeutics Industry Volume K Unit Forecast, by End User 2019 & 2032
- Table 145: Global Myeloproliferative Disorder Therapeutics Industry Revenue Million Forecast, by Country 2019 & 2032
- Table 146: Global Myeloproliferative Disorder Therapeutics Industry Volume K Unit Forecast, by Country 2019 & 2032
- Table 147: Brazil Myeloproliferative Disorder Therapeutics Industry Revenue (Million) Forecast, by Application 2019 & 2032
- Table 148: Brazil Myeloproliferative Disorder Therapeutics Industry Volume (K Unit) Forecast, by Application 2019 & 2032
- Table 149: Argentina Myeloproliferative Disorder Therapeutics Industry Revenue (Million) Forecast, by Application 2019 & 2032
- Table 150: Argentina Myeloproliferative Disorder Therapeutics Industry Volume (K Unit) Forecast, by Application 2019 & 2032
- Table 151: Rest of South America Myeloproliferative Disorder Therapeutics Industry Revenue (Million) Forecast, by Application 2019 & 2032
- Table 152: Rest of South America Myeloproliferative Disorder Therapeutics Industry Volume (K Unit) Forecast, by Application 2019 & 2032
Frequently Asked Questions
1. What is the projected Compound Annual Growth Rate (CAGR) of the Myeloproliferative Disorder Therapeutics Industry?
The projected CAGR is approximately 4.90%.
2. Which companies are prominent players in the Myeloproliferative Disorder Therapeutics Industry?
Key companies in the market include Pfizer, Novartis AG, Teva Pharmaceuticals, Bristol-Myers Squibb, Incyte Corporation, AbbVie, Takeda Pharmaceutical Company Limited, Viatris (Mylan N V ).
3. What are the main segments of the Myeloproliferative Disorder Therapeutics Industry?
The market segments include Type of MPD, Treatment, End User.
4. Can you provide details about the market size?
The market size is estimated to be USD XX Million as of 2022.
5. What are some drivers contributing to market growth?
Increasing Research and Development Investments for Developing Novel Treatments; Strong Presence of Pipeline Drugs.
6. What are the notable trends driving market growth?
Myelofibrosis Segment is Expected to Witness Growth Over the Forecast Period.
7. Are there any restraints impacting market growth?
Side Effects Associated with Medications.
8. Can you provide examples of recent developments in the market?
In February 2022, the United States Food and Drug Administration (FDA) approved pacritinib (Vonjo), an oral kinase inhibitor with specificity for JAK2, IRAK1 and CSF1R. It will be used for the treatment of intermediate or high-risk primary or secondary myelofibrosis, the first specifically for patients with severely low platelet counts (thrombocytopenia).
9. What pricing options are available for accessing the report?
Pricing options include single-user, multi-user, and enterprise licenses priced at USD 4750, USD 5250, and USD 8750 respectively.
10. Is the market size provided in terms of value or volume?
The market size is provided in terms of value, measured in Million and volume, measured in K Unit.
11. Are there any specific market keywords associated with the report?
Yes, the market keyword associated with the report is "Myeloproliferative Disorder Therapeutics Industry," which aids in identifying and referencing the specific market segment covered.
12. How do I determine which pricing option suits my needs best?
The pricing options vary based on user requirements and access needs. Individual users may opt for single-user licenses, while businesses requiring broader access may choose multi-user or enterprise licenses for cost-effective access to the report.
13. Are there any additional resources or data provided in the Myeloproliferative Disorder Therapeutics Industry report?
While the report offers comprehensive insights, it's advisable to review the specific contents or supplementary materials provided to ascertain if additional resources or data are available.
14. How can I stay updated on further developments or reports in the Myeloproliferative Disorder Therapeutics Industry?
To stay informed about further developments, trends, and reports in the Myeloproliferative Disorder Therapeutics Industry, consider subscribing to industry newsletters, following relevant companies and organizations, or regularly checking reputable industry news sources and publications.
Methodology
Step 1 - Identification of Relevant Samples Size from Population Database


Step 2 - Approaches for Defining Global Market Size (Value, Volume* & Price*)

Note*: In applicable scenarios
Step 3 - Data Sources
Primary Research
- Web Analytics
- Survey Reports
- Research Institute
- Latest Research Reports
- Opinion Leaders
Secondary Research
- Annual Reports
- White Paper
- Latest Press Release
- Industry Association
- Paid Database
- Investor Presentations

Step 4 - Data Triangulation
Involves using different sources of information in order to increase the validity of a study
These sources are likely to be stakeholders in a program - participants, other researchers, program staff, other community members, and so on.
Then we put all data in single framework & apply various statistical tools to find out the dynamic on the market.
During the analysis stage, feedback from the stakeholder groups would be compared to determine areas of agreement as well as areas of divergence


