
Key Insights
The North American dehydrated foods market is experiencing robust growth, driven by increasing consumer demand for convenient, healthy, and shelf-stable food options. The market's expansion is fueled by several key factors. The rising popularity of ready-to-eat meals and snacks, particularly among busy professionals and millennials, is a significant driver. Furthermore, the growing awareness of the nutritional benefits of dehydrated foods, including their high nutrient density and extended shelf life, is boosting consumption. The consistent efforts by manufacturers to innovate with new flavors, formats, and product lines, such as organic and gluten-free options, further contribute to market expansion. The burgeoning online retail sector also plays a crucial role, offering consumers greater accessibility and convenience in purchasing dehydrated foods. While the market faces challenges such as potential fluctuations in raw material prices and concerns about nutrient retention during the dehydration process, the overall trend points towards continued growth, particularly within specific segments. The dried fruit and vegetable segment, for instance, benefits from rising health consciousness and the increasing prevalence of vegan and vegetarian diets.
Within the North American context, the United States represents the largest market share due to its substantial population and higher disposable incomes. Canada and Mexico follow, exhibiting moderate growth rates. The distribution channels reveal a preference for hypermarkets and supermarkets, although online retailing is rapidly gaining traction, significantly impacting market dynamics. Competition in the market is moderate, with key players focusing on product differentiation, strategic partnerships, and expansion into new market segments. The market is expected to witness further consolidation in the coming years, driven by mergers, acquisitions, and increased investments in research and development to enhance product quality, taste, and nutritional value. Factors such as evolving consumer preferences, technological advancements in dehydration techniques, and regulatory changes in the food industry will continuously shape the trajectory of the North American dehydrated foods market.
North America Dehydrated Foods Market: A Comprehensive Report (2019-2033)
This comprehensive report provides an in-depth analysis of the North America (NA) dehydrated foods market, offering invaluable insights for industry stakeholders, investors, and market entrants. Covering the period from 2019 to 2033, with 2025 as the base year, this report meticulously examines market trends, segment performance, competitive dynamics, and future growth prospects. The report leverages rigorous research methodologies and data analysis to deliver actionable intelligence, enabling informed decision-making.
NA Dehydrated Foods Market Concentration & Innovation
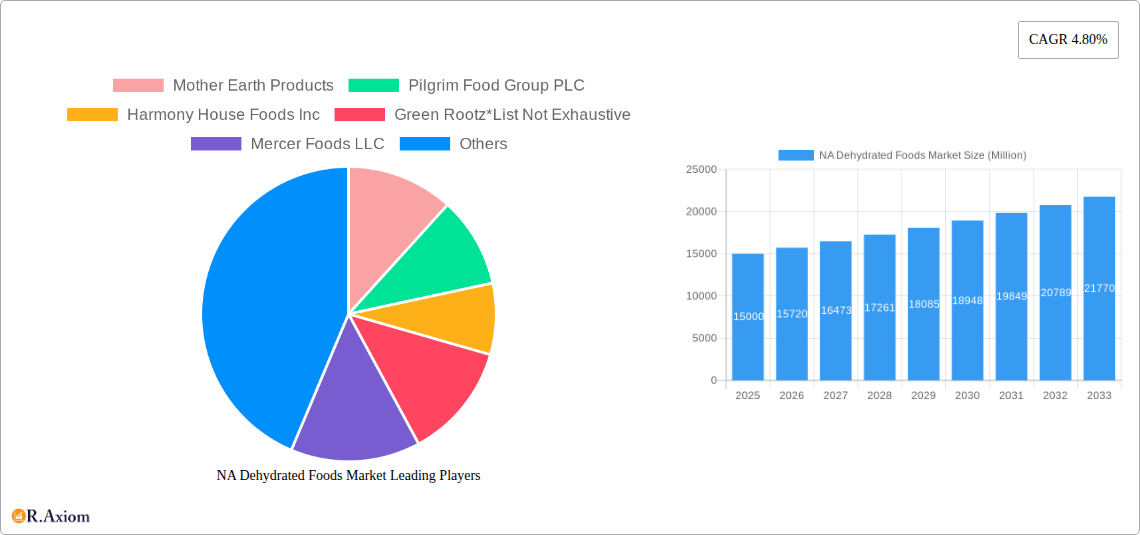
The NA dehydrated foods market exhibits a moderately consolidated structure, with key players like Mother Earth Products, Pilgrim Food Group PLC, Harmony House Foods Inc, Green Rootz, Mercer Foods LLC, Döhler, and Van Drunen Farms holding significant market share. However, the presence of numerous smaller regional players contributes to competitive intensity. Market concentration is assessed through metrics like the Herfindahl-Hirschman Index (HHI) and market share analysis of top players, revealing xx% market share for the top five players in 2025. Innovation within the sector is driven by factors such as the increasing demand for convenient and shelf-stable food products, advancements in dehydration technologies (e.g., freeze-drying, spray drying), and a growing focus on healthier and more nutritious food options. Regulatory frameworks, including food safety standards and labeling requirements, significantly impact the market. Product substitutes, such as canned and frozen foods, pose a competitive threat. Furthermore, evolving consumer preferences towards organic and natural dehydrated foods are shaping product development strategies. M&A activities in the sector, valued at approximately $xx Million in 2024, indicate a drive towards consolidation and expansion of market reach. Notable M&A deals included [Insert Example Deal if available].
NA Dehydrated Foods Market Industry Trends & Insights
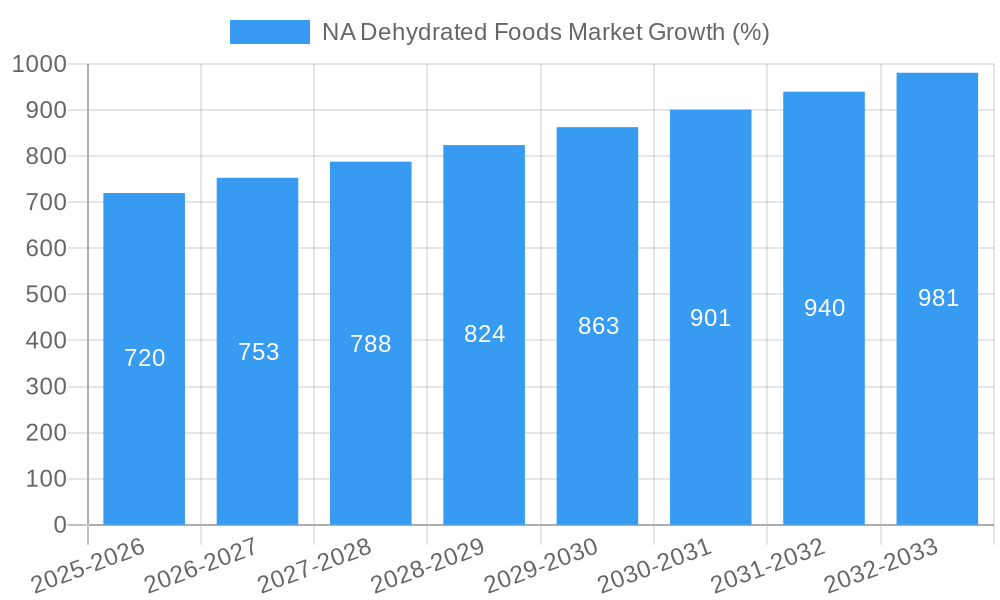
The NA dehydrated foods market demonstrates robust growth, with a projected CAGR of xx% during the forecast period (2025-2033). Several factors fuel this growth. The escalating demand for convenient and ready-to-eat meals, driven by changing lifestyles and busy schedules, is a primary driver. Technological advancements in dehydration techniques have led to improved product quality and extended shelf life, further boosting market expansion. Consumer preference for healthier snacking options, with a focus on natural and minimally processed ingredients, is another key driver. The increasing prevalence of food allergies and intolerances is also pushing demand for products with specific dietary attributes. However, competitive dynamics remain intense, with companies continuously striving for differentiation through innovation in product offerings, packaging, and marketing strategies. Market penetration of dehydrated foods within specific consumer segments (e.g., millennials, health-conscious individuals) continues to increase, contributing to overall market growth.
Dominant Markets & Segments in NA Dehydrated Foods Market
The Dried Fruit and Vegetable segment dominates the NA dehydrated foods market by product type, capturing approximately xx% of market share in 2025. This is primarily due to the growing consumer preference for healthy snack options and the versatility of these products in various culinary applications. The Hypermarket/Supermarket distribution channel holds the largest share in terms of sales, reflecting the widespread availability of dehydrated food products in major retail outlets.
- Key Drivers for Dried Fruit and Vegetable Segment: Increasing health consciousness, growing demand for convenient snacks, and diverse culinary uses.
- Key Drivers for Hypermarket/Supermarket Channel: Wide reach, established distribution networks, and consumer familiarity with purchasing in these stores.
The United States holds the largest market share within the NA region, fueled by factors such as higher disposable incomes, a larger population base, and established food retail infrastructure. Canada represents a significant, albeit smaller, market, with growth driven by similar trends, but at a comparatively slower pace due to the country's smaller population.
NA Dehydrated Foods Market Product Developments
Significant product innovation is shaping the NA dehydrated foods market. Manufacturers are focusing on developing products with enhanced nutritional value, improved texture, and extended shelf life. Freeze-drying technologies are gaining traction, producing high-quality products with better flavor and texture retention compared to traditional methods. Furthermore, the increasing demand for organic and non-GMO dehydrated foods is driving the development of products that cater to these preferences. This innovation aligns with the growing consumer interest in healthy eating and dietary restrictions. The introduction of functional ingredients (e.g., probiotics, antioxidants) in dehydrated food products is another noteworthy trend.
Report Scope & Segmentation Analysis
This report provides a comprehensive segmentation analysis of the NA dehydrated foods market, broken down by product type and distribution channel.
By Product Type: Dried Processed Food, Dried Fruit and Vegetable, Dried Dairy, Dried Meat and Seafood, and Others. Each segment's market size, growth projections, and competitive landscape are thoroughly analyzed, revealing varied growth rates across segments. The Dried Fruit and Vegetable segment shows the fastest growth due to health-conscious trends.
By Distribution Channel: Hypermarket/Supermarket, Convenience Stores, Online Retailing, and Others. Market share and growth projections are provided for each distribution channel, highlighting the dominance of Hypermarkets/Supermarkets and the increasing significance of online retail.
The report offers detailed insights into the market dynamics of each segment, including competitive intensity and key players.
Key Drivers of NA Dehydrated Foods Market Growth
The NA dehydrated foods market growth is propelled by several key factors:
- Rising Consumer Demand: Convenience, health consciousness, and increasing dietary restrictions are driving higher demand.
- Technological Advancements: Improved dehydration techniques, longer shelf life, and enhanced product quality.
- Favorable Economic Conditions: Increasing disposable incomes and changing consumer spending patterns.
- Government Support: Policies encouraging the adoption of healthier food choices and supporting the food processing industry.
Challenges in the NA Dehydrated Foods Market Sector
Despite the positive growth outlook, several challenges hinder the NA dehydrated foods market:
- Supply Chain Disruptions: Fluctuations in raw material prices and logistics complexities impact profitability and product availability. The impact is estimated at xx% reduction in overall market growth during supply chain disruptions (e.g. pandemic periods).
- Intense Competition: The market's competitive landscape necessitates continuous innovation and effective marketing strategies to maintain market share.
- Regulatory Compliance: Adherence to stringent food safety regulations and labeling requirements increases operational costs and complexities.
Emerging Opportunities in NA Dehydrated Foods Market
Several opportunities exist for growth in the NA dehydrated foods market:
- Expansion into Niche Markets: Meeting the specific needs of consumers with unique dietary requirements (e.g., vegan, gluten-free) presents significant potential.
- Product Diversification: Developing novel products with functional benefits (e.g., added vitamins, probiotics) opens new market segments.
- Sustainable Sourcing: Consumers increasingly value products sourced from sustainable and ethical practices.
Leading Players in the NA Dehydrated Foods Market Market
- Mother Earth Products
- Pilgrim Food Group PLC
- Harmony House Foods Inc
- Green Rootz
- Mercer Foods LLC
- Döhler
- Van Drunen Farms
Key Developments in NA Dehydrated Foods Market Industry
- January 2023: Mother Earth Products launched a new line of organic dehydrated soups.
- June 2022: Pilgrim Food Group PLC acquired a smaller dehydrated foods producer, expanding its market reach.
- [Insert other relevant examples with dates]
Strategic Outlook for NA Dehydrated Foods Market Market
The NA dehydrated foods market exhibits strong growth potential throughout the forecast period. Continued innovation in product development, sustainable sourcing practices, and strategic expansion into new market segments will be crucial for success. The increasing focus on health and wellness, coupled with advancements in dehydration technology, positions the market for sustained expansion. Companies that can effectively leverage these trends will enjoy significant growth opportunities.
NA Dehydrated Foods Market Segmentation
-
1. Product Type
- 1.1. Dried Processed Food
- 1.2. Dried Fruit and Vegetable
- 1.3. Dried Dairy
- 1.4. Dried Meat and Seafood
- 1.5. Others
-
2. Distribution Channel
- 2.1. Hypermarket/Supermarket
- 2.2. Convenience Stores
- 2.3. Online Retailing
- 2.4. Others
-
3. Geography
- 3.1. United States
- 3.2. Canada
- 3.3. Mexixo
- 3.4. Rest of North America
NA Dehydrated Foods Market Segmentation By Geography
- 1. United States
- 2. Canada
- 3. Mexixo
- 4. Rest of North America
NA Dehydrated Foods Market REPORT HIGHLIGHTS
| Aspects | Details |
|---|---|
| Study Period | 2019-2033 |
| Base Year | 2024 |
| Estimated Year | 2025 |
| Forecast Period | 2025-2033 |
| Historical Period | 2019-2024 |
| Growth Rate | CAGR of 4.80% from 2019-2033 |
| Segmentation |
|
Table of Contents
- 1. Introduction
- 1.1. Research Scope
- 1.2. Market Segmentation
- 1.3. Research Methodology
- 1.4. Definitions and Assumptions
- 2. Executive Summary
- 2.1. Introduction
- 3. Market Dynamics
- 3.1. Introduction
- 3.2. Market Drivers
- 3.2.1. Growing Presence of International Fast-Food Restaurants; Restaurant Digitization and AI Are Transforming the QSR Industry
- 3.3. Market Restrains
- 3.3.1. Consumer Inclination Toward Ready Meals
- 3.4. Market Trends
- 3.4.1. Increased Demand for Freeze-Dried Food
- 4. Market Factor Analysis
- 4.1. Porters Five Forces
- 4.2. Supply/Value Chain
- 4.3. PESTEL analysis
- 4.4. Market Entropy
- 4.5. Patent/Trademark Analysis
- 5. Global NA Dehydrated Foods Market Analysis, Insights and Forecast, 2019-2031
- 5.1. Market Analysis, Insights and Forecast - by Product Type
- 5.1.1. Dried Processed Food
- 5.1.2. Dried Fruit and Vegetable
- 5.1.3. Dried Dairy
- 5.1.4. Dried Meat and Seafood
- 5.1.5. Others
- 5.2. Market Analysis, Insights and Forecast - by Distribution Channel
- 5.2.1. Hypermarket/Supermarket
- 5.2.2. Convenience Stores
- 5.2.3. Online Retailing
- 5.2.4. Others
- 5.3. Market Analysis, Insights and Forecast - by Geography
- 5.3.1. United States
- 5.3.2. Canada
- 5.3.3. Mexixo
- 5.3.4. Rest of North America
- 5.4. Market Analysis, Insights and Forecast - by Region
- 5.4.1. United States
- 5.4.2. Canada
- 5.4.3. Mexixo
- 5.4.4. Rest of North America
- 5.1. Market Analysis, Insights and Forecast - by Product Type
- 6. United States NA Dehydrated Foods Market Analysis, Insights and Forecast, 2019-2031
- 6.1. Market Analysis, Insights and Forecast - by Product Type
- 6.1.1. Dried Processed Food
- 6.1.2. Dried Fruit and Vegetable
- 6.1.3. Dried Dairy
- 6.1.4. Dried Meat and Seafood
- 6.1.5. Others
- 6.2. Market Analysis, Insights and Forecast - by Distribution Channel
- 6.2.1. Hypermarket/Supermarket
- 6.2.2. Convenience Stores
- 6.2.3. Online Retailing
- 6.2.4. Others
- 6.3. Market Analysis, Insights and Forecast - by Geography
- 6.3.1. United States
- 6.3.2. Canada
- 6.3.3. Mexixo
- 6.3.4. Rest of North America
- 6.1. Market Analysis, Insights and Forecast - by Product Type
- 7. Canada NA Dehydrated Foods Market Analysis, Insights and Forecast, 2019-2031
- 7.1. Market Analysis, Insights and Forecast - by Product Type
- 7.1.1. Dried Processed Food
- 7.1.2. Dried Fruit and Vegetable
- 7.1.3. Dried Dairy
- 7.1.4. Dried Meat and Seafood
- 7.1.5. Others
- 7.2. Market Analysis, Insights and Forecast - by Distribution Channel
- 7.2.1. Hypermarket/Supermarket
- 7.2.2. Convenience Stores
- 7.2.3. Online Retailing
- 7.2.4. Others
- 7.3. Market Analysis, Insights and Forecast - by Geography
- 7.3.1. United States
- 7.3.2. Canada
- 7.3.3. Mexixo
- 7.3.4. Rest of North America
- 7.1. Market Analysis, Insights and Forecast - by Product Type
- 8. Mexixo NA Dehydrated Foods Market Analysis, Insights and Forecast, 2019-2031
- 8.1. Market Analysis, Insights and Forecast - by Product Type
- 8.1.1. Dried Processed Food
- 8.1.2. Dried Fruit and Vegetable
- 8.1.3. Dried Dairy
- 8.1.4. Dried Meat and Seafood
- 8.1.5. Others
- 8.2. Market Analysis, Insights and Forecast - by Distribution Channel
- 8.2.1. Hypermarket/Supermarket
- 8.2.2. Convenience Stores
- 8.2.3. Online Retailing
- 8.2.4. Others
- 8.3. Market Analysis, Insights and Forecast - by Geography
- 8.3.1. United States
- 8.3.2. Canada
- 8.3.3. Mexixo
- 8.3.4. Rest of North America
- 8.1. Market Analysis, Insights and Forecast - by Product Type
- 9. Rest of North America NA Dehydrated Foods Market Analysis, Insights and Forecast, 2019-2031
- 9.1. Market Analysis, Insights and Forecast - by Product Type
- 9.1.1. Dried Processed Food
- 9.1.2. Dried Fruit and Vegetable
- 9.1.3. Dried Dairy
- 9.1.4. Dried Meat and Seafood
- 9.1.5. Others
- 9.2. Market Analysis, Insights and Forecast - by Distribution Channel
- 9.2.1. Hypermarket/Supermarket
- 9.2.2. Convenience Stores
- 9.2.3. Online Retailing
- 9.2.4. Others
- 9.3. Market Analysis, Insights and Forecast - by Geography
- 9.3.1. United States
- 9.3.2. Canada
- 9.3.3. Mexixo
- 9.3.4. Rest of North America
- 9.1. Market Analysis, Insights and Forecast - by Product Type
- 10. North America NA Dehydrated Foods Market Analysis, Insights and Forecast, 2019-2031
- 10.1. Market Analysis, Insights and Forecast - By Country/Sub-region
- 10.1.1 United States
- 10.1.2 Canada
- 10.1.3 Mexico
- 11. Europe NA Dehydrated Foods Market Analysis, Insights and Forecast, 2019-2031
- 11.1. Market Analysis, Insights and Forecast - By Country/Sub-region
- 11.1.1 Germany
- 11.1.2 United Kingdom
- 11.1.3 France
- 11.1.4 Spain
- 11.1.5 Italy
- 11.1.6 Spain
- 11.1.7 Belgium
- 11.1.8 Netherland
- 11.1.9 Nordics
- 11.1.10 Rest of Europe
- 12. Asia Pacific NA Dehydrated Foods Market Analysis, Insights and Forecast, 2019-2031
- 12.1. Market Analysis, Insights and Forecast - By Country/Sub-region
- 12.1.1 China
- 12.1.2 Japan
- 12.1.3 India
- 12.1.4 South Korea
- 12.1.5 Southeast Asia
- 12.1.6 Australia
- 12.1.7 Indonesia
- 12.1.8 Phillipes
- 12.1.9 Singapore
- 12.1.10 Thailandc
- 12.1.11 Rest of Asia Pacific
- 13. South America NA Dehydrated Foods Market Analysis, Insights and Forecast, 2019-2031
- 13.1. Market Analysis, Insights and Forecast - By Country/Sub-region
- 13.1.1 Brazil
- 13.1.2 Argentina
- 13.1.3 Peru
- 13.1.4 Chile
- 13.1.5 Colombia
- 13.1.6 Ecuador
- 13.1.7 Venezuela
- 13.1.8 Rest of South America
- 14. MEA NA Dehydrated Foods Market Analysis, Insights and Forecast, 2019-2031
- 14.1. Market Analysis, Insights and Forecast - By Country/Sub-region
- 14.1.1 United Arab Emirates
- 14.1.2 Saudi Arabia
- 14.1.3 South Africa
- 14.1.4 Rest of Middle East and Africa
- 15. Competitive Analysis
- 15.1. Global Market Share Analysis 2024
- 15.2. Company Profiles
- 15.2.1 Mother Earth Products
- 15.2.1.1. Overview
- 15.2.1.2. Products
- 15.2.1.3. SWOT Analysis
- 15.2.1.4. Recent Developments
- 15.2.1.5. Financials (Based on Availability)
- 15.2.2 Pilgrim Food Group PLC
- 15.2.2.1. Overview
- 15.2.2.2. Products
- 15.2.2.3. SWOT Analysis
- 15.2.2.4. Recent Developments
- 15.2.2.5. Financials (Based on Availability)
- 15.2.3 Harmony House Foods Inc
- 15.2.3.1. Overview
- 15.2.3.2. Products
- 15.2.3.3. SWOT Analysis
- 15.2.3.4. Recent Developments
- 15.2.3.5. Financials (Based on Availability)
- 15.2.4 Green Rootz*List Not Exhaustive
- 15.2.4.1. Overview
- 15.2.4.2. Products
- 15.2.4.3. SWOT Analysis
- 15.2.4.4. Recent Developments
- 15.2.4.5. Financials (Based on Availability)
- 15.2.5 Mercer Foods LLC
- 15.2.5.1. Overview
- 15.2.5.2. Products
- 15.2.5.3. SWOT Analysis
- 15.2.5.4. Recent Developments
- 15.2.5.5. Financials (Based on Availability)
- 15.2.6 Döhler
- 15.2.6.1. Overview
- 15.2.6.2. Products
- 15.2.6.3. SWOT Analysis
- 15.2.6.4. Recent Developments
- 15.2.6.5. Financials (Based on Availability)
- 15.2.7 Van Drunen Farms
- 15.2.7.1. Overview
- 15.2.7.2. Products
- 15.2.7.3. SWOT Analysis
- 15.2.7.4. Recent Developments
- 15.2.7.5. Financials (Based on Availability)
- 15.2.1 Mother Earth Products
List of Figures
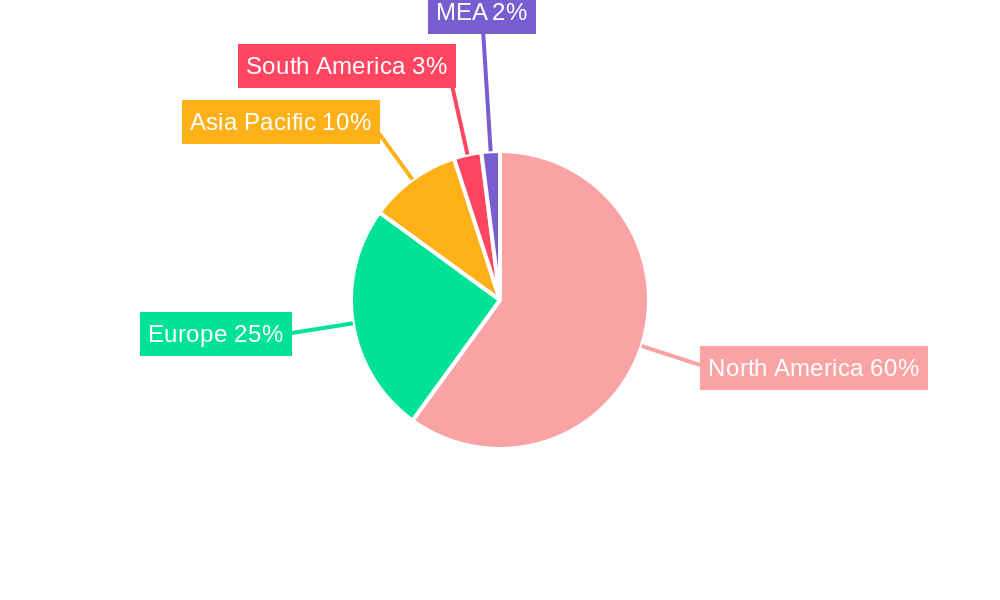
- Figure 1: Global NA Dehydrated Foods Market Revenue Breakdown (Million, %) by Region 2024 & 2032
- Figure 2: North America NA Dehydrated Foods Market Revenue (Million), by Country 2024 & 2032
- Figure 3: North America NA Dehydrated Foods Market Revenue Share (%), by Country 2024 & 2032
- Figure 4: Europe NA Dehydrated Foods Market Revenue (Million), by Country 2024 & 2032
- Figure 5: Europe NA Dehydrated Foods Market Revenue Share (%), by Country 2024 & 2032
- Figure 6: Asia Pacific NA Dehydrated Foods Market Revenue (Million), by Country 2024 & 2032
- Figure 7: Asia Pacific NA Dehydrated Foods Market Revenue Share (%), by Country 2024 & 2032
- Figure 8: South America NA Dehydrated Foods Market Revenue (Million), by Country 2024 & 2032
- Figure 9: South America NA Dehydrated Foods Market Revenue Share (%), by Country 2024 & 2032
- Figure 10: MEA NA Dehydrated Foods Market Revenue (Million), by Country 2024 & 2032
- Figure 11: MEA NA Dehydrated Foods Market Revenue Share (%), by Country 2024 & 2032
- Figure 12: United States NA Dehydrated Foods Market Revenue (Million), by Product Type 2024 & 2032
- Figure 13: United States NA Dehydrated Foods Market Revenue Share (%), by Product Type 2024 & 2032
- Figure 14: United States NA Dehydrated Foods Market Revenue (Million), by Distribution Channel 2024 & 2032
- Figure 15: United States NA Dehydrated Foods Market Revenue Share (%), by Distribution Channel 2024 & 2032
- Figure 16: United States NA Dehydrated Foods Market Revenue (Million), by Geography 2024 & 2032
- Figure 17: United States NA Dehydrated Foods Market Revenue Share (%), by Geography 2024 & 2032
- Figure 18: United States NA Dehydrated Foods Market Revenue (Million), by Country 2024 & 2032
- Figure 19: United States NA Dehydrated Foods Market Revenue Share (%), by Country 2024 & 2032
- Figure 20: Canada NA Dehydrated Foods Market Revenue (Million), by Product Type 2024 & 2032
- Figure 21: Canada NA Dehydrated Foods Market Revenue Share (%), by Product Type 2024 & 2032
- Figure 22: Canada NA Dehydrated Foods Market Revenue (Million), by Distribution Channel 2024 & 2032
- Figure 23: Canada NA Dehydrated Foods Market Revenue Share (%), by Distribution Channel 2024 & 2032
- Figure 24: Canada NA Dehydrated Foods Market Revenue (Million), by Geography 2024 & 2032
- Figure 25: Canada NA Dehydrated Foods Market Revenue Share (%), by Geography 2024 & 2032
- Figure 26: Canada NA Dehydrated Foods Market Revenue (Million), by Country 2024 & 2032
- Figure 27: Canada NA Dehydrated Foods Market Revenue Share (%), by Country 2024 & 2032
- Figure 28: Mexixo NA Dehydrated Foods Market Revenue (Million), by Product Type 2024 & 2032
- Figure 29: Mexixo NA Dehydrated Foods Market Revenue Share (%), by Product Type 2024 & 2032
- Figure 30: Mexixo NA Dehydrated Foods Market Revenue (Million), by Distribution Channel 2024 & 2032
- Figure 31: Mexixo NA Dehydrated Foods Market Revenue Share (%), by Distribution Channel 2024 & 2032
- Figure 32: Mexixo NA Dehydrated Foods Market Revenue (Million), by Geography 2024 & 2032
- Figure 33: Mexixo NA Dehydrated Foods Market Revenue Share (%), by Geography 2024 & 2032
- Figure 34: Mexixo NA Dehydrated Foods Market Revenue (Million), by Country 2024 & 2032
- Figure 35: Mexixo NA Dehydrated Foods Market Revenue Share (%), by Country 2024 & 2032
- Figure 36: Rest of North America NA Dehydrated Foods Market Revenue (Million), by Product Type 2024 & 2032
- Figure 37: Rest of North America NA Dehydrated Foods Market Revenue Share (%), by Product Type 2024 & 2032
- Figure 38: Rest of North America NA Dehydrated Foods Market Revenue (Million), by Distribution Channel 2024 & 2032
- Figure 39: Rest of North America NA Dehydrated Foods Market Revenue Share (%), by Distribution Channel 2024 & 2032
- Figure 40: Rest of North America NA Dehydrated Foods Market Revenue (Million), by Geography 2024 & 2032
- Figure 41: Rest of North America NA Dehydrated Foods Market Revenue Share (%), by Geography 2024 & 2032
- Figure 42: Rest of North America NA Dehydrated Foods Market Revenue (Million), by Country 2024 & 2032
- Figure 43: Rest of North America NA Dehydrated Foods Market Revenue Share (%), by Country 2024 & 2032
List of Tables
- Table 1: Global NA Dehydrated Foods Market Revenue Million Forecast, by Region 2019 & 2032
- Table 2: Global NA Dehydrated Foods Market Revenue Million Forecast, by Product Type 2019 & 2032
- Table 3: Global NA Dehydrated Foods Market Revenue Million Forecast, by Distribution Channel 2019 & 2032
- Table 4: Global NA Dehydrated Foods Market Revenue Million Forecast, by Geography 2019 & 2032
- Table 5: Global NA Dehydrated Foods Market Revenue Million Forecast, by Region 2019 & 2032
- Table 6: Global NA Dehydrated Foods Market Revenue Million Forecast, by Country 2019 & 2032
- Table 7: United States NA Dehydrated Foods Market Revenue (Million) Forecast, by Application 2019 & 2032
- Table 8: Canada NA Dehydrated Foods Market Revenue (Million) Forecast, by Application 2019 & 2032
- Table 9: Mexico NA Dehydrated Foods Market Revenue (Million) Forecast, by Application 2019 & 2032
- Table 10: Global NA Dehydrated Foods Market Revenue Million Forecast, by Country 2019 & 2032
- Table 11: Germany NA Dehydrated Foods Market Revenue (Million) Forecast, by Application 2019 & 2032
- Table 12: United Kingdom NA Dehydrated Foods Market Revenue (Million) Forecast, by Application 2019 & 2032
- Table 13: France NA Dehydrated Foods Market Revenue (Million) Forecast, by Application 2019 & 2032
- Table 14: Spain NA Dehydrated Foods Market Revenue (Million) Forecast, by Application 2019 & 2032
- Table 15: Italy NA Dehydrated Foods Market Revenue (Million) Forecast, by Application 2019 & 2032
- Table 16: Spain NA Dehydrated Foods Market Revenue (Million) Forecast, by Application 2019 & 2032
- Table 17: Belgium NA Dehydrated Foods Market Revenue (Million) Forecast, by Application 2019 & 2032
- Table 18: Netherland NA Dehydrated Foods Market Revenue (Million) Forecast, by Application 2019 & 2032
- Table 19: Nordics NA Dehydrated Foods Market Revenue (Million) Forecast, by Application 2019 & 2032
- Table 20: Rest of Europe NA Dehydrated Foods Market Revenue (Million) Forecast, by Application 2019 & 2032
- Table 21: Global NA Dehydrated Foods Market Revenue Million Forecast, by Country 2019 & 2032
- Table 22: China NA Dehydrated Foods Market Revenue (Million) Forecast, by Application 2019 & 2032
- Table 23: Japan NA Dehydrated Foods Market Revenue (Million) Forecast, by Application 2019 & 2032
- Table 24: India NA Dehydrated Foods Market Revenue (Million) Forecast, by Application 2019 & 2032
- Table 25: South Korea NA Dehydrated Foods Market Revenue (Million) Forecast, by Application 2019 & 2032
- Table 26: Southeast Asia NA Dehydrated Foods Market Revenue (Million) Forecast, by Application 2019 & 2032
- Table 27: Australia NA Dehydrated Foods Market Revenue (Million) Forecast, by Application 2019 & 2032
- Table 28: Indonesia NA Dehydrated Foods Market Revenue (Million) Forecast, by Application 2019 & 2032
- Table 29: Phillipes NA Dehydrated Foods Market Revenue (Million) Forecast, by Application 2019 & 2032
- Table 30: Singapore NA Dehydrated Foods Market Revenue (Million) Forecast, by Application 2019 & 2032
- Table 31: Thailandc NA Dehydrated Foods Market Revenue (Million) Forecast, by Application 2019 & 2032
- Table 32: Rest of Asia Pacific NA Dehydrated Foods Market Revenue (Million) Forecast, by Application 2019 & 2032
- Table 33: Global NA Dehydrated Foods Market Revenue Million Forecast, by Country 2019 & 2032
- Table 34: Brazil NA Dehydrated Foods Market Revenue (Million) Forecast, by Application 2019 & 2032
- Table 35: Argentina NA Dehydrated Foods Market Revenue (Million) Forecast, by Application 2019 & 2032
- Table 36: Peru NA Dehydrated Foods Market Revenue (Million) Forecast, by Application 2019 & 2032
- Table 37: Chile NA Dehydrated Foods Market Revenue (Million) Forecast, by Application 2019 & 2032
- Table 38: Colombia NA Dehydrated Foods Market Revenue (Million) Forecast, by Application 2019 & 2032
- Table 39: Ecuador NA Dehydrated Foods Market Revenue (Million) Forecast, by Application 2019 & 2032
- Table 40: Venezuela NA Dehydrated Foods Market Revenue (Million) Forecast, by Application 2019 & 2032
- Table 41: Rest of South America NA Dehydrated Foods Market Revenue (Million) Forecast, by Application 2019 & 2032
- Table 42: Global NA Dehydrated Foods Market Revenue Million Forecast, by Country 2019 & 2032
- Table 43: United Arab Emirates NA Dehydrated Foods Market Revenue (Million) Forecast, by Application 2019 & 2032
- Table 44: Saudi Arabia NA Dehydrated Foods Market Revenue (Million) Forecast, by Application 2019 & 2032
- Table 45: South Africa NA Dehydrated Foods Market Revenue (Million) Forecast, by Application 2019 & 2032
- Table 46: Rest of Middle East and Africa NA Dehydrated Foods Market Revenue (Million) Forecast, by Application 2019 & 2032
- Table 47: Global NA Dehydrated Foods Market Revenue Million Forecast, by Product Type 2019 & 2032
- Table 48: Global NA Dehydrated Foods Market Revenue Million Forecast, by Distribution Channel 2019 & 2032
- Table 49: Global NA Dehydrated Foods Market Revenue Million Forecast, by Geography 2019 & 2032
- Table 50: Global NA Dehydrated Foods Market Revenue Million Forecast, by Country 2019 & 2032
- Table 51: Global NA Dehydrated Foods Market Revenue Million Forecast, by Product Type 2019 & 2032
- Table 52: Global NA Dehydrated Foods Market Revenue Million Forecast, by Distribution Channel 2019 & 2032
- Table 53: Global NA Dehydrated Foods Market Revenue Million Forecast, by Geography 2019 & 2032
- Table 54: Global NA Dehydrated Foods Market Revenue Million Forecast, by Country 2019 & 2032
- Table 55: Global NA Dehydrated Foods Market Revenue Million Forecast, by Product Type 2019 & 2032
- Table 56: Global NA Dehydrated Foods Market Revenue Million Forecast, by Distribution Channel 2019 & 2032
- Table 57: Global NA Dehydrated Foods Market Revenue Million Forecast, by Geography 2019 & 2032
- Table 58: Global NA Dehydrated Foods Market Revenue Million Forecast, by Country 2019 & 2032
- Table 59: Global NA Dehydrated Foods Market Revenue Million Forecast, by Product Type 2019 & 2032
- Table 60: Global NA Dehydrated Foods Market Revenue Million Forecast, by Distribution Channel 2019 & 2032
- Table 61: Global NA Dehydrated Foods Market Revenue Million Forecast, by Geography 2019 & 2032
- Table 62: Global NA Dehydrated Foods Market Revenue Million Forecast, by Country 2019 & 2032
Frequently Asked Questions
1. What is the projected Compound Annual Growth Rate (CAGR) of the NA Dehydrated Foods Market?
The projected CAGR is approximately 4.80%.
2. Which companies are prominent players in the NA Dehydrated Foods Market?
Key companies in the market include Mother Earth Products, Pilgrim Food Group PLC, Harmony House Foods Inc, Green Rootz*List Not Exhaustive, Mercer Foods LLC, Döhler, Van Drunen Farms.
3. What are the main segments of the NA Dehydrated Foods Market?
The market segments include Product Type, Distribution Channel, Geography.
4. Can you provide details about the market size?
The market size is estimated to be USD XX Million as of 2022.
5. What are some drivers contributing to market growth?
Growing Presence of International Fast-Food Restaurants; Restaurant Digitization and AI Are Transforming the QSR Industry.
6. What are the notable trends driving market growth?
Increased Demand for Freeze-Dried Food.
7. Are there any restraints impacting market growth?
Consumer Inclination Toward Ready Meals.
8. Can you provide examples of recent developments in the market?
N/A
9. What pricing options are available for accessing the report?
Pricing options include single-user, multi-user, and enterprise licenses priced at USD 4750, USD 5250, and USD 8750 respectively.
10. Is the market size provided in terms of value or volume?
The market size is provided in terms of value, measured in Million.
11. Are there any specific market keywords associated with the report?
Yes, the market keyword associated with the report is "NA Dehydrated Foods Market," which aids in identifying and referencing the specific market segment covered.
12. How do I determine which pricing option suits my needs best?
The pricing options vary based on user requirements and access needs. Individual users may opt for single-user licenses, while businesses requiring broader access may choose multi-user or enterprise licenses for cost-effective access to the report.
13. Are there any additional resources or data provided in the NA Dehydrated Foods Market report?
While the report offers comprehensive insights, it's advisable to review the specific contents or supplementary materials provided to ascertain if additional resources or data are available.
14. How can I stay updated on further developments or reports in the NA Dehydrated Foods Market?
To stay informed about further developments, trends, and reports in the NA Dehydrated Foods Market, consider subscribing to industry newsletters, following relevant companies and organizations, or regularly checking reputable industry news sources and publications.
Methodology
Step 1 - Identification of Relevant Samples Size from Population Database


Step 2 - Approaches for Defining Global Market Size (Value, Volume* & Price*)

Note*: In applicable scenarios
Step 3 - Data Sources
Primary Research
- Web Analytics
- Survey Reports
- Research Institute
- Latest Research Reports
- Opinion Leaders
Secondary Research
- Annual Reports
- White Paper
- Latest Press Release
- Industry Association
- Paid Database
- Investor Presentations

Step 4 - Data Triangulation
Involves using different sources of information in order to increase the validity of a study
These sources are likely to be stakeholders in a program - participants, other researchers, program staff, other community members, and so on.
Then we put all data in single framework & apply various statistical tools to find out the dynamic on the market.
During the analysis stage, feedback from the stakeholder groups would be compared to determine areas of agreement as well as areas of divergence


