

Key Insights
The North American Managed Mobility Services (MMS) market is experiencing significant expansion, fueled by escalating enterprise adoption of mobile devices and the critical need for robust mobile device management. The market is projected to grow at a Compound Annual Growth Rate (CAGR) of 25.77%. This robust growth underscores the increasing demand for comprehensive MMS solutions. Key growth drivers include the widespread adoption of Bring Your Own Device (BYOD) policies, the imperative to boost employee productivity via optimized mobile workflows, and heightened concerns regarding data security and regulatory compliance. Prominent sectors such as Banking, Financial Services, and Insurance (BFSI), Retail, and Healthcare are significant contributors, driven by their reliance on mobile technologies for enhanced customer engagement, operational efficiency, and secure handling of sensitive data. The Cloud deployment model is gaining prominence due to its inherent scalability, cost-effectiveness, and simplified management capabilities. While on-premise solutions retain a notable market share, the transition towards cloud-based offerings is accelerating, driven by the pursuit of greater agility and reduced IT infrastructure overhead.
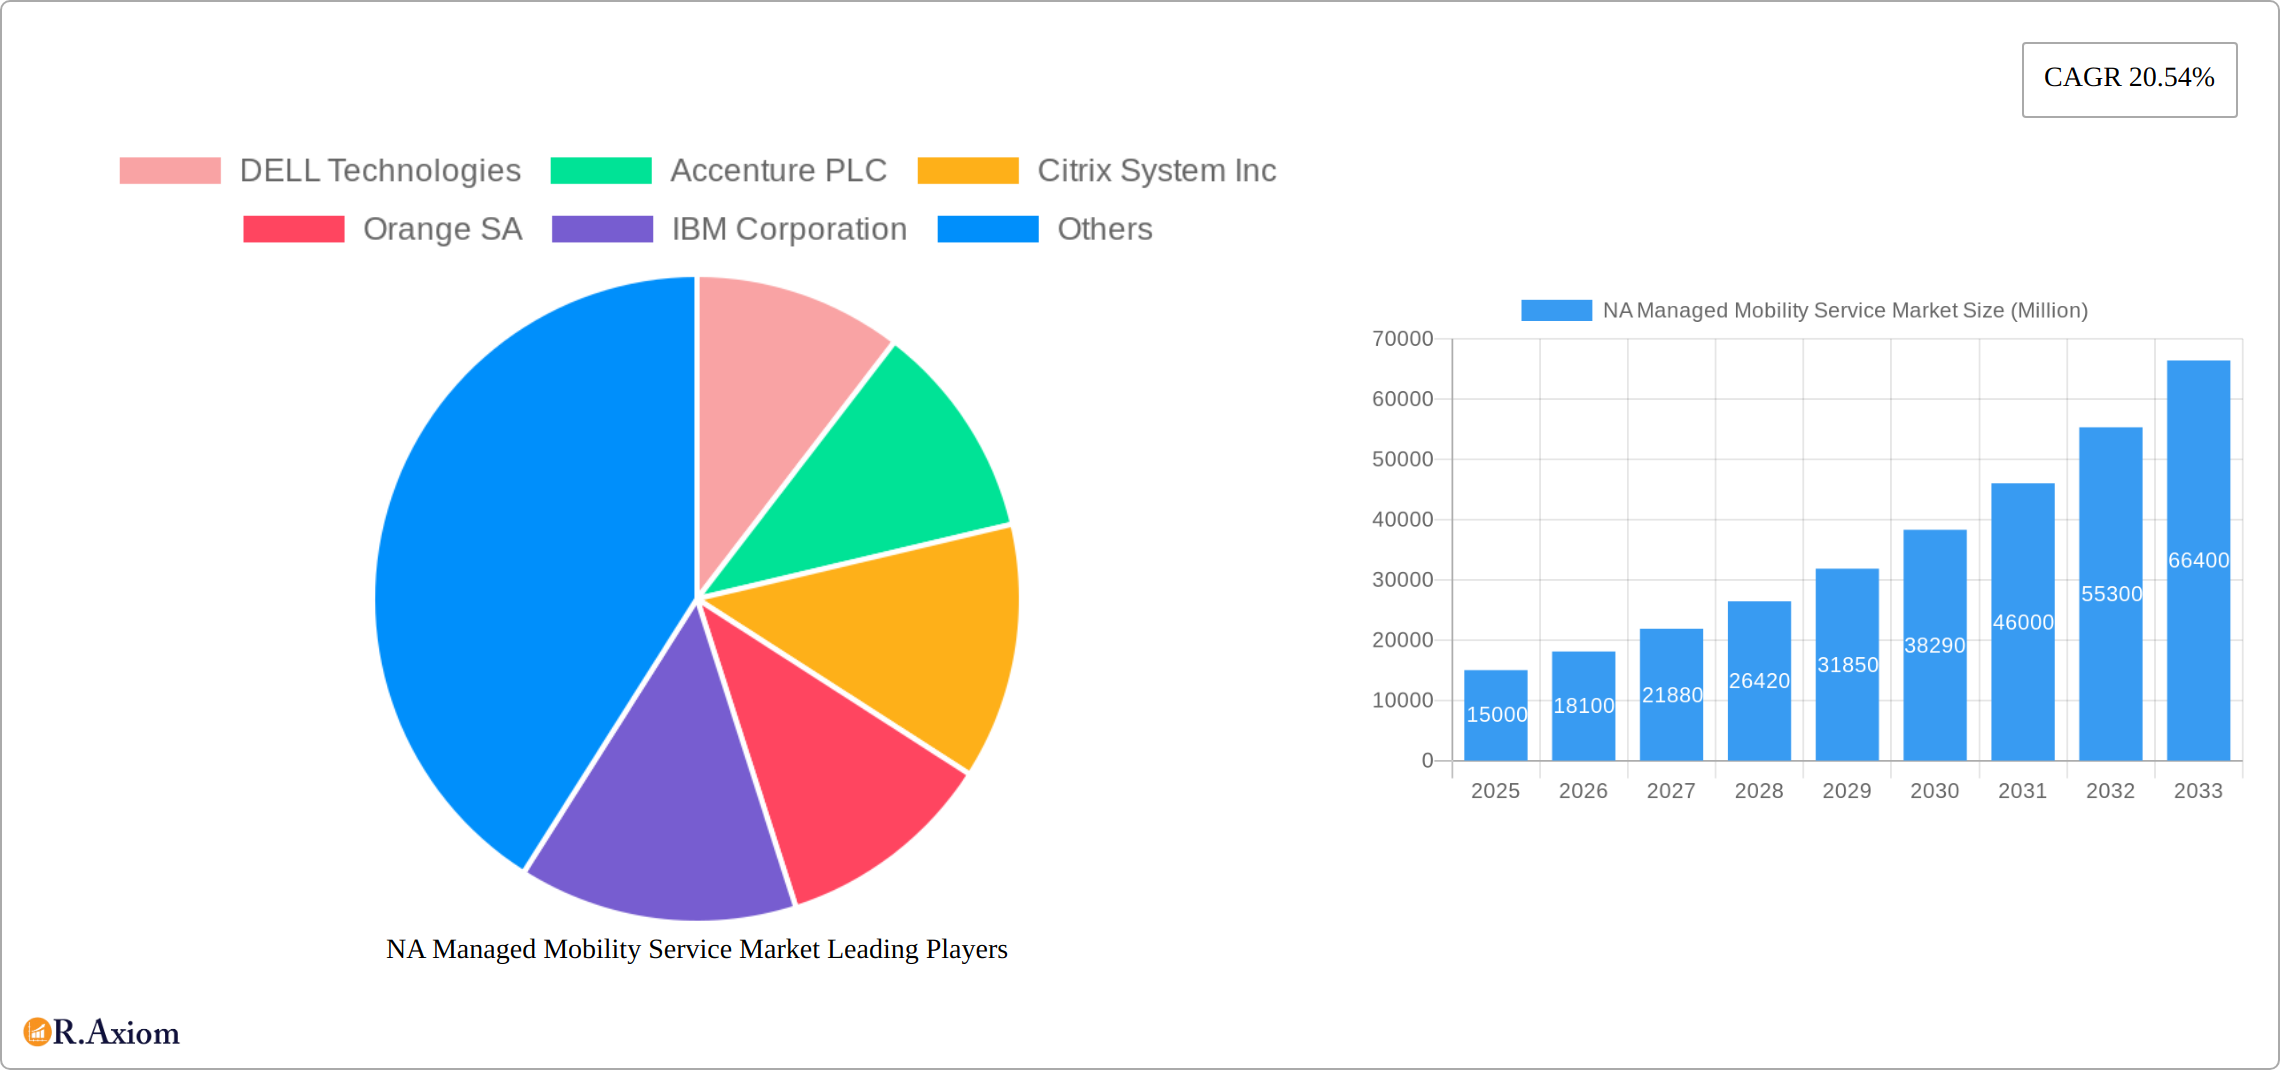
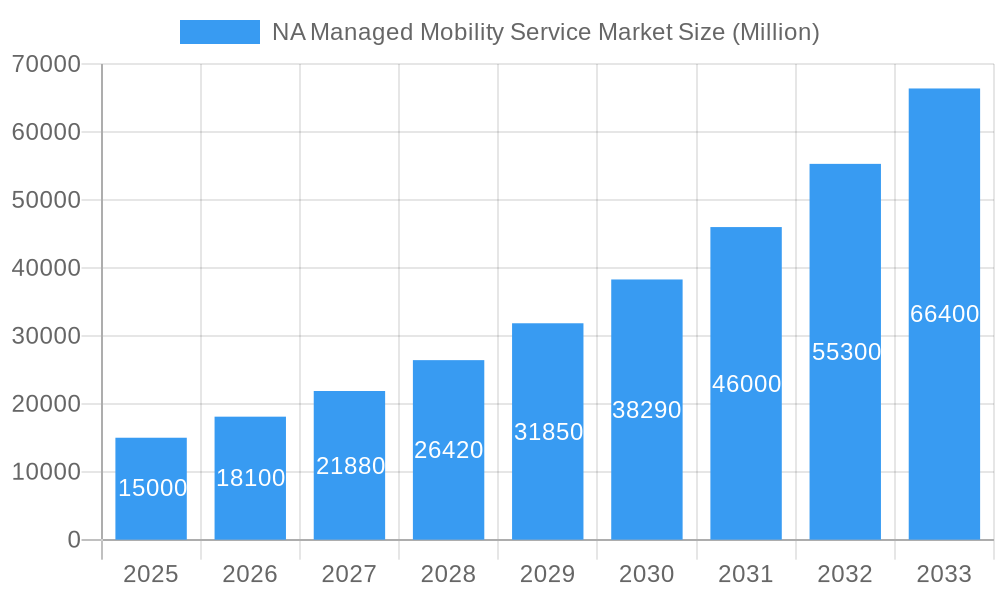
NA Managed Mobility Service Market Market Size (In Billion)
Competition within the North American MMS market is dynamic, featuring established global technology providers and specialized MMS vendors. Future market expansion will be contingent upon continuous technological advancements, including the integration of Artificial Intelligence (AI) and Machine Learning (ML) for enhanced security and automation, alongside the expanding adoption of 5G networks and their impact on mobile device management strategies. The market size is estimated at 39.62 billion in the base year of 2024, with a unit of billion.
NA Managed Mobility Service Market Company Market Share
The North American MMS market is segmented by service type (Mobile Device Management, Mobile Security, Mobile Application Management, and others), deployment model (Cloud and On-Premise), end-user industry (BFSI, Retail, Power & Energy, Manufacturing, IT & Telecom, Education, Healthcare, and others), and geographic region. The forecast period (2025-2033) anticipates sustained growth, propelled by ongoing innovation in mobile technologies and pervasive digital transformation across industries. Future market dynamics will be shaped by evolving security threats, advancements in 5G and edge computing, and stringent regulatory compliance requirements, necessitating adaptable and advanced MMS solutions.
NA Managed Mobility Service Market: A Comprehensive Report (2019-2033)
This in-depth report provides a comprehensive analysis of the North American Managed Mobility Service (MMS) market, offering valuable insights for stakeholders across the industry. Covering the period from 2019 to 2033, with a base year of 2025 and a forecast period of 2025-2033, this report unveils key trends, growth drivers, and challenges shaping this dynamic sector. The report segments the market by type, deployment, end-user industry, and geography, providing granular data and actionable insights for strategic decision-making. The total market size in 2025 is estimated at xx Million, projected to reach xx Million by 2033, exhibiting a CAGR of xx% during the forecast period.
NA Managed Mobility Service Market Concentration & Innovation
The North American Managed Mobility Service market exhibits a moderately concentrated landscape, with key players like DELL Technologies, Accenture PLC, and IBM Corporation holding significant market share. The exact market share for each company in 2025 is estimated as follows: DELL Technologies (xx%), Accenture PLC (xx%), IBM Corporation (xx%), while others such as Citrix System Inc, Orange SA, Wipro Ltd, Fujitsu Ltd, Hewlett Packard Enterprise Company, Tech Mahindra Limited, AT&T Inc, and Telefonica SA together control the remaining xx%. Innovation within the sector is driven by the increasing adoption of 5G technology, the rise of IoT devices, and the growing demand for enhanced security solutions. Regulatory frameworks, particularly concerning data privacy (like CCPA and GDPR), significantly influence market dynamics. Product substitutes, such as in-house IT management solutions, pose a competitive challenge, but the complexities and cost-effectiveness of MMS continue to drive market growth. Mergers and acquisitions (M&A) activities, with estimated deal values totaling xx Million in 2024, have further consolidated the market, leading to increased competition and technological advancements. End-user trends, including the adoption of BYOD policies and the demand for seamless mobility solutions, are also reshaping the market landscape.
NA Managed Mobility Service Market Industry Trends & Insights
The NA Managed Mobility Service market is experiencing robust growth, fueled by several key trends. The increasing adoption of mobile devices across various industries, coupled with the rising need for secure and efficient mobile device management, is a primary driver. The shift towards cloud-based deployment models offers scalability and cost-effectiveness, further accelerating market expansion. Technological disruptions, such as the emergence of 5G and AI-powered security solutions, are enhancing the capabilities of MMS offerings, attracting new customers and expanding market applications. Consumer preferences are shifting towards integrated solutions that streamline device management, security, and application deployment. Competitive dynamics are marked by intense rivalry, with established players and emerging technology providers vying for market share through strategic partnerships, product innovation, and enhanced service offerings. The market penetration rate for MMS in various sectors varies considerably, with the BFSI and IT & Telecom sectors showing the highest adoption rates, projected at xx% and xx% respectively by 2025. This translates to significant market expansion and opportunities for growth throughout the forecast period. The overall CAGR during this period is estimated at xx%.
Dominant Markets & Segments in NA Managed Mobility Service Market
- By Type: Mobile Device Management (MDM) is the dominant segment, driven by the widespread use of smartphones and tablets in various industries. Mobile Security is witnessing substantial growth due to increasing cyber threats.
- By Deployment: Cloud-based deployment is the leading segment, offering scalability and cost-effectiveness compared to on-premise solutions.
- By End-user Industry: The BFSI sector is currently the largest end-user segment, followed by the IT and Telecom sector. This is mainly because of the stringent security requirements and the high volume of mobile devices used within these sectors. Retail and Healthcare also display considerable growth potential.
- By Country: The United States dominates the North American market, driven by high technological adoption rates and a large mobile workforce. Canada follows, with a steadily increasing adoption rate and supportive government policies. Key drivers within these regions include strong technological infrastructure, supportive regulatory environments, and high levels of digital adoption across various industries. The economic stability and robust IT spending also contribute to this dominance.
The dominance of these segments is a result of several factors, including: * Strong government support for digital transformation initiatives. * High mobile penetration rates amongst the population. * Well-established IT infrastructure. * Stringent regulatory frameworks emphasizing data privacy and security.
NA Managed Mobility Service Market Product Developments
Recent product innovations focus on integrating AI and machine learning for improved security and automation, as well as enhanced user experience features for greater device management efficiency. These advancements offer significant competitive advantages, such as proactive threat detection, simplified workflows, and improved cost optimization. The market trend is toward unified endpoint management (UEM) solutions that integrate MDM, mobile application management (MAM), and other functionalities into a single platform. This trend enhances operational efficiency and cost-effectiveness, shaping the competitive landscape.
Report Scope & Segmentation Analysis
This comprehensive report offers a detailed analysis of the North American Managed Mobility Service (MMS) market, providing a granular breakdown across key segments to facilitate a thorough understanding of market dynamics and growth potential. The segmentation encompasses:
- Type: The market is segmented by solution type, including Mobile Device Management (MDM), Mobile Security Management (MSM), Mobile Application Management (MAM), and Other Types. Each segment's market size, growth trajectory, competitive landscape, and technological advancements are meticulously analyzed to provide a clear picture of its individual contribution to the overall market.
- Deployment: The report examines the market based on deployment models: Cloud and On-premise. A detailed assessment of the market share, adoption rates, and influencing factors for each deployment model provides valuable insights into prevailing trends and future projections.
- End-user Industry: The analysis covers a wide spectrum of end-user industries, including Banking, Financial Services, and Insurance (BFSI); Retail; Power and Energy; Manufacturing; Information Technology and Telecommunications (IT and Telecom); Education; Healthcare; and Other End-user Industries. The report delves into the specific MMS requirements and adoption rates of each sector, highlighting industry-specific trends and challenges.
- Country: The report provides a country-level breakdown of the market, focusing on the United States and Canada. This geographical segmentation allows for a deeper understanding of regional variations in market size, growth rates, and influential factors.
Key Drivers of NA Managed Mobility Service Market Growth
The robust growth of the North American Managed Mobility Service market is propelled by a confluence of factors. Significant technological advancements, particularly in 5G network infrastructure and AI-powered security solutions, are enhancing the capabilities and attractiveness of MMS offerings. The widespread adoption of Bring Your Own Device (BYOD) policies necessitates robust and secure management solutions, further fueling market demand. Furthermore, increasingly stringent data privacy regulations (like GDPR and CCPA) and escalating cybersecurity threats are driving the demand for sophisticated mobile device management systems. The relatively stable North American economy and substantial IT spending across various sectors contribute significantly to the market's expansion.
Challenges in the NA Managed Mobility Service Market Sector
Despite its significant growth potential, the NA Managed Mobility Service market faces several challenges. The complexity of integrating diverse solutions across heterogeneous platforms presents a significant hurdle for many organizations. The escalating cost of advanced security solutions, coupled with the constantly evolving nature of cyber threats, necessitates continuous investment in adaptation and upgrades. The highly competitive landscape demands continuous innovation and adaptation to maintain a competitive edge. Supply chain disruptions can also impact the availability of essential devices and services, potentially hindering market growth. Meeting stringent regulatory compliance demands and maintaining robust data privacy protocols add significant operational and financial burdens for MMS providers.
Emerging Opportunities in NA Managed Mobility Service Market
The NA Managed Mobility Service market presents compelling opportunities for growth and innovation. The integration of Internet of Things (IoT) devices into MMS solutions is opening up new avenues for service providers. The accelerating adoption of remote work models demands enhanced security and management capabilities, creating significant market opportunities for secure remote access and management solutions. Expansion into underserved market segments, particularly within smaller and medium-sized enterprises (SMEs), presents significant untapped potential. The rollout of 5G technology will unlock new possibilities for mobile applications and device management, offering substantial growth prospects. Furthermore, the development of tailored, industry-specific MMS solutions can address unique challenges and needs, creating new avenues for differentiation and market share growth.
Leading Players in the NA Managed Mobility Service Market Market
- DELL Technologies
- Accenture PLC
- Citrix System Inc
- Orange SA
- IBM Corporation
- Wipro Ltd
- Fujitsu Ltd
- Hewlett Packard Enterprise Company
- Tech Mahindra Limited
- AT&T Inc
- Telefonica SA
Key Developments in NA Managed Mobility Service Market Industry
- October 2024: DELL Technologies launched a new AI-powered security solution for enhanced threat detection.
- June 2024: Accenture PLC acquired a smaller MMS provider, expanding its service portfolio.
- March 2024: IBM Corporation announced a strategic partnership with a 5G network provider to offer integrated mobility solutions. (Further developments can be added here as they occur)
Strategic Outlook for NA Managed Mobility Service Market Market
The future of the NA Managed Mobility Service market appears bright. Continued technological advancements, coupled with the growing adoption of mobile devices and the increasing emphasis on security, will fuel sustained market growth. The expansion into new market segments, particularly in the IoT and industrial sectors, will unlock significant opportunities. Companies that prioritize innovation, strategic partnerships, and customer-centric solutions will be best positioned to capitalize on this growth.
NA Managed Mobility Service Market Segmentation
-
1. Type
- 1.1. Mobile Device Management
- 1.2. Mobile Security
- 1.3. Mobile Application Management
- 1.4. Other Type
-
2. Deployment
- 2.1. Cloud
- 2.2. On-premise
-
3. End-user Industry
- 3.1. BFSI
- 3.2. Retail
- 3.3. Power and Energy
- 3.4. Manufacturing
- 3.5. IT and Telecom
- 3.6. Education
- 3.7. Healthcare
- 3.8. Other End-user Industry
NA Managed Mobility Service Market Segmentation By Geography
-
1. North America
- 1.1. United States
- 1.2. Canada
- 1.3. Mexico
-
2. South America
- 2.1. Brazil
- 2.2. Argentina
- 2.3. Rest of South America
-
3. Europe
- 3.1. United Kingdom
- 3.2. Germany
- 3.3. France
- 3.4. Italy
- 3.5. Spain
- 3.6. Russia
- 3.7. Benelux
- 3.8. Nordics
- 3.9. Rest of Europe
-
4. Middle East & Africa
- 4.1. Turkey
- 4.2. Israel
- 4.3. GCC
- 4.4. North Africa
- 4.5. South Africa
- 4.6. Rest of Middle East & Africa
-
5. Asia Pacific
- 5.1. China
- 5.2. India
- 5.3. Japan
- 5.4. South Korea
- 5.5. ASEAN
- 5.6. Oceania
- 5.7. Rest of Asia Pacific
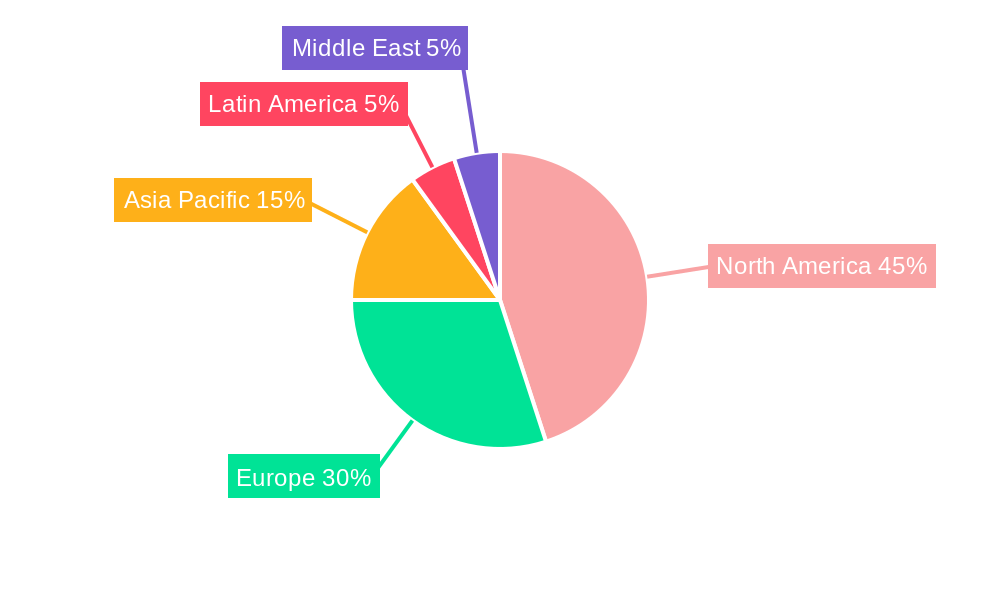
NA Managed Mobility Service Market Regional Market Share
Geographic Coverage of NA Managed Mobility Service Market
NA Managed Mobility Service Market REPORT HIGHLIGHTS
| Aspects | Details |
|---|---|
| Study Period | 2020-2034 |
| Base Year | 2025 |
| Estimated Year | 2026 |
| Forecast Period | 2026-2034 |
| Historical Period | 2020-2025 |
| Growth Rate | CAGR of 25.77% from 2020-2034 |
| Segmentation |
|
Table of Contents
- 1. Introduction
- 1.1. Research Scope
- 1.2. Market Segmentation
- 1.3. Research Methodology
- 1.4. Definitions and Assumptions
- 2. Executive Summary
- 2.1. Introduction
- 3. Market Dynamics
- 3.1. Introduction
- 3.2. Market Drivers
- 3.2.1. ; Increasing Acceptability for BYOD in Organizations; Companies Outsourcing IT Activities
- 3.3. Market Restrains
- 3.3.1. ; Lack of Control over Operations and Cost Visibility
- 3.4. Market Trends
- 3.4.1. Mobile Application Management to Hold Major Share
- 4. Market Factor Analysis
- 4.1. Porters Five Forces
- 4.2. Supply/Value Chain
- 4.3. PESTEL analysis
- 4.4. Market Entropy
- 4.5. Patent/Trademark Analysis
- 5. Global NA Managed Mobility Service Market Analysis, Insights and Forecast, 2020-2032
- 5.1. Market Analysis, Insights and Forecast - by Type
- 5.1.1. Mobile Device Management
- 5.1.2. Mobile Security
- 5.1.3. Mobile Application Management
- 5.1.4. Other Type
- 5.2. Market Analysis, Insights and Forecast - by Deployment
- 5.2.1. Cloud
- 5.2.2. On-premise
- 5.3. Market Analysis, Insights and Forecast - by End-user Industry
- 5.3.1. BFSI
- 5.3.2. Retail
- 5.3.3. Power and Energy
- 5.3.4. Manufacturing
- 5.3.5. IT and Telecom
- 5.3.6. Education
- 5.3.7. Healthcare
- 5.3.8. Other End-user Industry
- 5.4. Market Analysis, Insights and Forecast - by Region
- 5.4.1. North America
- 5.4.2. South America
- 5.4.3. Europe
- 5.4.4. Middle East & Africa
- 5.4.5. Asia Pacific
- 5.1. Market Analysis, Insights and Forecast - by Type
- 6. North America NA Managed Mobility Service Market Analysis, Insights and Forecast, 2020-2032
- 6.1. Market Analysis, Insights and Forecast - by Type
- 6.1.1. Mobile Device Management
- 6.1.2. Mobile Security
- 6.1.3. Mobile Application Management
- 6.1.4. Other Type
- 6.2. Market Analysis, Insights and Forecast - by Deployment
- 6.2.1. Cloud
- 6.2.2. On-premise
- 6.3. Market Analysis, Insights and Forecast - by End-user Industry
- 6.3.1. BFSI
- 6.3.2. Retail
- 6.3.3. Power and Energy
- 6.3.4. Manufacturing
- 6.3.5. IT and Telecom
- 6.3.6. Education
- 6.3.7. Healthcare
- 6.3.8. Other End-user Industry
- 6.1. Market Analysis, Insights and Forecast - by Type
- 7. South America NA Managed Mobility Service Market Analysis, Insights and Forecast, 2020-2032
- 7.1. Market Analysis, Insights and Forecast - by Type
- 7.1.1. Mobile Device Management
- 7.1.2. Mobile Security
- 7.1.3. Mobile Application Management
- 7.1.4. Other Type
- 7.2. Market Analysis, Insights and Forecast - by Deployment
- 7.2.1. Cloud
- 7.2.2. On-premise
- 7.3. Market Analysis, Insights and Forecast - by End-user Industry
- 7.3.1. BFSI
- 7.3.2. Retail
- 7.3.3. Power and Energy
- 7.3.4. Manufacturing
- 7.3.5. IT and Telecom
- 7.3.6. Education
- 7.3.7. Healthcare
- 7.3.8. Other End-user Industry
- 7.1. Market Analysis, Insights and Forecast - by Type
- 8. Europe NA Managed Mobility Service Market Analysis, Insights and Forecast, 2020-2032
- 8.1. Market Analysis, Insights and Forecast - by Type
- 8.1.1. Mobile Device Management
- 8.1.2. Mobile Security
- 8.1.3. Mobile Application Management
- 8.1.4. Other Type
- 8.2. Market Analysis, Insights and Forecast - by Deployment
- 8.2.1. Cloud
- 8.2.2. On-premise
- 8.3. Market Analysis, Insights and Forecast - by End-user Industry
- 8.3.1. BFSI
- 8.3.2. Retail
- 8.3.3. Power and Energy
- 8.3.4. Manufacturing
- 8.3.5. IT and Telecom
- 8.3.6. Education
- 8.3.7. Healthcare
- 8.3.8. Other End-user Industry
- 8.1. Market Analysis, Insights and Forecast - by Type
- 9. Middle East & Africa NA Managed Mobility Service Market Analysis, Insights and Forecast, 2020-2032
- 9.1. Market Analysis, Insights and Forecast - by Type
- 9.1.1. Mobile Device Management
- 9.1.2. Mobile Security
- 9.1.3. Mobile Application Management
- 9.1.4. Other Type
- 9.2. Market Analysis, Insights and Forecast - by Deployment
- 9.2.1. Cloud
- 9.2.2. On-premise
- 9.3. Market Analysis, Insights and Forecast - by End-user Industry
- 9.3.1. BFSI
- 9.3.2. Retail
- 9.3.3. Power and Energy
- 9.3.4. Manufacturing
- 9.3.5. IT and Telecom
- 9.3.6. Education
- 9.3.7. Healthcare
- 9.3.8. Other End-user Industry
- 9.1. Market Analysis, Insights and Forecast - by Type
- 10. Asia Pacific NA Managed Mobility Service Market Analysis, Insights and Forecast, 2020-2032
- 10.1. Market Analysis, Insights and Forecast - by Type
- 10.1.1. Mobile Device Management
- 10.1.2. Mobile Security
- 10.1.3. Mobile Application Management
- 10.1.4. Other Type
- 10.2. Market Analysis, Insights and Forecast - by Deployment
- 10.2.1. Cloud
- 10.2.2. On-premise
- 10.3. Market Analysis, Insights and Forecast - by End-user Industry
- 10.3.1. BFSI
- 10.3.2. Retail
- 10.3.3. Power and Energy
- 10.3.4. Manufacturing
- 10.3.5. IT and Telecom
- 10.3.6. Education
- 10.3.7. Healthcare
- 10.3.8. Other End-user Industry
- 10.1. Market Analysis, Insights and Forecast - by Type
- 11. Competitive Analysis
- 11.1. Global Market Share Analysis 2025
- 11.2. Company Profiles
- 11.2.1 DELL Technologies
- 11.2.1.1. Overview
- 11.2.1.2. Products
- 11.2.1.3. SWOT Analysis
- 11.2.1.4. Recent Developments
- 11.2.1.5. Financials (Based on Availability)
- 11.2.2 Accenture PLC
- 11.2.2.1. Overview
- 11.2.2.2. Products
- 11.2.2.3. SWOT Analysis
- 11.2.2.4. Recent Developments
- 11.2.2.5. Financials (Based on Availability)
- 11.2.3 Citrix System Inc
- 11.2.3.1. Overview
- 11.2.3.2. Products
- 11.2.3.3. SWOT Analysis
- 11.2.3.4. Recent Developments
- 11.2.3.5. Financials (Based on Availability)
- 11.2.4 Orange SA
- 11.2.4.1. Overview
- 11.2.4.2. Products
- 11.2.4.3. SWOT Analysis
- 11.2.4.4. Recent Developments
- 11.2.4.5. Financials (Based on Availability)
- 11.2.5 IBM Corporation
- 11.2.5.1. Overview
- 11.2.5.2. Products
- 11.2.5.3. SWOT Analysis
- 11.2.5.4. Recent Developments
- 11.2.5.5. Financials (Based on Availability)
- 11.2.6 Wipro Ltd
- 11.2.6.1. Overview
- 11.2.6.2. Products
- 11.2.6.3. SWOT Analysis
- 11.2.6.4. Recent Developments
- 11.2.6.5. Financials (Based on Availability)
- 11.2.7 Fujitsu Ltd
- 11.2.7.1. Overview
- 11.2.7.2. Products
- 11.2.7.3. SWOT Analysis
- 11.2.7.4. Recent Developments
- 11.2.7.5. Financials (Based on Availability)
- 11.2.8 Hewlett Packard Enterprise Company
- 11.2.8.1. Overview
- 11.2.8.2. Products
- 11.2.8.3. SWOT Analysis
- 11.2.8.4. Recent Developments
- 11.2.8.5. Financials (Based on Availability)
- 11.2.9 Tech Mahindra Limited
- 11.2.9.1. Overview
- 11.2.9.2. Products
- 11.2.9.3. SWOT Analysis
- 11.2.9.4. Recent Developments
- 11.2.9.5. Financials (Based on Availability)
- 11.2.10 AT&T Inc
- 11.2.10.1. Overview
- 11.2.10.2. Products
- 11.2.10.3. SWOT Analysis
- 11.2.10.4. Recent Developments
- 11.2.10.5. Financials (Based on Availability)
- 11.2.11 Telefonica SA
- 11.2.11.1. Overview
- 11.2.11.2. Products
- 11.2.11.3. SWOT Analysis
- 11.2.11.4. Recent Developments
- 11.2.11.5. Financials (Based on Availability)
- 11.2.1 DELL Technologies
List of Figures
- Figure 1: Global NA Managed Mobility Service Market Revenue Breakdown (billion, %) by Region 2025 & 2033
- Figure 2: Global NA Managed Mobility Service Market Volume Breakdown (K Unit, %) by Region 2025 & 2033
- Figure 3: North America NA Managed Mobility Service Market Revenue (billion), by Type 2025 & 2033
- Figure 4: North America NA Managed Mobility Service Market Volume (K Unit), by Type 2025 & 2033
- Figure 5: North America NA Managed Mobility Service Market Revenue Share (%), by Type 2025 & 2033
- Figure 6: North America NA Managed Mobility Service Market Volume Share (%), by Type 2025 & 2033
- Figure 7: North America NA Managed Mobility Service Market Revenue (billion), by Deployment 2025 & 2033
- Figure 8: North America NA Managed Mobility Service Market Volume (K Unit), by Deployment 2025 & 2033
- Figure 9: North America NA Managed Mobility Service Market Revenue Share (%), by Deployment 2025 & 2033
- Figure 10: North America NA Managed Mobility Service Market Volume Share (%), by Deployment 2025 & 2033
- Figure 11: North America NA Managed Mobility Service Market Revenue (billion), by End-user Industry 2025 & 2033
- Figure 12: North America NA Managed Mobility Service Market Volume (K Unit), by End-user Industry 2025 & 2033
- Figure 13: North America NA Managed Mobility Service Market Revenue Share (%), by End-user Industry 2025 & 2033
- Figure 14: North America NA Managed Mobility Service Market Volume Share (%), by End-user Industry 2025 & 2033
- Figure 15: North America NA Managed Mobility Service Market Revenue (billion), by Country 2025 & 2033
- Figure 16: North America NA Managed Mobility Service Market Volume (K Unit), by Country 2025 & 2033
- Figure 17: North America NA Managed Mobility Service Market Revenue Share (%), by Country 2025 & 2033
- Figure 18: North America NA Managed Mobility Service Market Volume Share (%), by Country 2025 & 2033
- Figure 19: South America NA Managed Mobility Service Market Revenue (billion), by Type 2025 & 2033
- Figure 20: South America NA Managed Mobility Service Market Volume (K Unit), by Type 2025 & 2033
- Figure 21: South America NA Managed Mobility Service Market Revenue Share (%), by Type 2025 & 2033
- Figure 22: South America NA Managed Mobility Service Market Volume Share (%), by Type 2025 & 2033
- Figure 23: South America NA Managed Mobility Service Market Revenue (billion), by Deployment 2025 & 2033
- Figure 24: South America NA Managed Mobility Service Market Volume (K Unit), by Deployment 2025 & 2033
- Figure 25: South America NA Managed Mobility Service Market Revenue Share (%), by Deployment 2025 & 2033
- Figure 26: South America NA Managed Mobility Service Market Volume Share (%), by Deployment 2025 & 2033
- Figure 27: South America NA Managed Mobility Service Market Revenue (billion), by End-user Industry 2025 & 2033
- Figure 28: South America NA Managed Mobility Service Market Volume (K Unit), by End-user Industry 2025 & 2033
- Figure 29: South America NA Managed Mobility Service Market Revenue Share (%), by End-user Industry 2025 & 2033
- Figure 30: South America NA Managed Mobility Service Market Volume Share (%), by End-user Industry 2025 & 2033
- Figure 31: South America NA Managed Mobility Service Market Revenue (billion), by Country 2025 & 2033
- Figure 32: South America NA Managed Mobility Service Market Volume (K Unit), by Country 2025 & 2033
- Figure 33: South America NA Managed Mobility Service Market Revenue Share (%), by Country 2025 & 2033
- Figure 34: South America NA Managed Mobility Service Market Volume Share (%), by Country 2025 & 2033
- Figure 35: Europe NA Managed Mobility Service Market Revenue (billion), by Type 2025 & 2033
- Figure 36: Europe NA Managed Mobility Service Market Volume (K Unit), by Type 2025 & 2033
- Figure 37: Europe NA Managed Mobility Service Market Revenue Share (%), by Type 2025 & 2033
- Figure 38: Europe NA Managed Mobility Service Market Volume Share (%), by Type 2025 & 2033
- Figure 39: Europe NA Managed Mobility Service Market Revenue (billion), by Deployment 2025 & 2033
- Figure 40: Europe NA Managed Mobility Service Market Volume (K Unit), by Deployment 2025 & 2033
- Figure 41: Europe NA Managed Mobility Service Market Revenue Share (%), by Deployment 2025 & 2033
- Figure 42: Europe NA Managed Mobility Service Market Volume Share (%), by Deployment 2025 & 2033
- Figure 43: Europe NA Managed Mobility Service Market Revenue (billion), by End-user Industry 2025 & 2033
- Figure 44: Europe NA Managed Mobility Service Market Volume (K Unit), by End-user Industry 2025 & 2033
- Figure 45: Europe NA Managed Mobility Service Market Revenue Share (%), by End-user Industry 2025 & 2033
- Figure 46: Europe NA Managed Mobility Service Market Volume Share (%), by End-user Industry 2025 & 2033
- Figure 47: Europe NA Managed Mobility Service Market Revenue (billion), by Country 2025 & 2033
- Figure 48: Europe NA Managed Mobility Service Market Volume (K Unit), by Country 2025 & 2033
- Figure 49: Europe NA Managed Mobility Service Market Revenue Share (%), by Country 2025 & 2033
- Figure 50: Europe NA Managed Mobility Service Market Volume Share (%), by Country 2025 & 2033
- Figure 51: Middle East & Africa NA Managed Mobility Service Market Revenue (billion), by Type 2025 & 2033
- Figure 52: Middle East & Africa NA Managed Mobility Service Market Volume (K Unit), by Type 2025 & 2033
- Figure 53: Middle East & Africa NA Managed Mobility Service Market Revenue Share (%), by Type 2025 & 2033
- Figure 54: Middle East & Africa NA Managed Mobility Service Market Volume Share (%), by Type 2025 & 2033
- Figure 55: Middle East & Africa NA Managed Mobility Service Market Revenue (billion), by Deployment 2025 & 2033
- Figure 56: Middle East & Africa NA Managed Mobility Service Market Volume (K Unit), by Deployment 2025 & 2033
- Figure 57: Middle East & Africa NA Managed Mobility Service Market Revenue Share (%), by Deployment 2025 & 2033
- Figure 58: Middle East & Africa NA Managed Mobility Service Market Volume Share (%), by Deployment 2025 & 2033
- Figure 59: Middle East & Africa NA Managed Mobility Service Market Revenue (billion), by End-user Industry 2025 & 2033
- Figure 60: Middle East & Africa NA Managed Mobility Service Market Volume (K Unit), by End-user Industry 2025 & 2033
- Figure 61: Middle East & Africa NA Managed Mobility Service Market Revenue Share (%), by End-user Industry 2025 & 2033
- Figure 62: Middle East & Africa NA Managed Mobility Service Market Volume Share (%), by End-user Industry 2025 & 2033
- Figure 63: Middle East & Africa NA Managed Mobility Service Market Revenue (billion), by Country 2025 & 2033
- Figure 64: Middle East & Africa NA Managed Mobility Service Market Volume (K Unit), by Country 2025 & 2033
- Figure 65: Middle East & Africa NA Managed Mobility Service Market Revenue Share (%), by Country 2025 & 2033
- Figure 66: Middle East & Africa NA Managed Mobility Service Market Volume Share (%), by Country 2025 & 2033
- Figure 67: Asia Pacific NA Managed Mobility Service Market Revenue (billion), by Type 2025 & 2033
- Figure 68: Asia Pacific NA Managed Mobility Service Market Volume (K Unit), by Type 2025 & 2033
- Figure 69: Asia Pacific NA Managed Mobility Service Market Revenue Share (%), by Type 2025 & 2033
- Figure 70: Asia Pacific NA Managed Mobility Service Market Volume Share (%), by Type 2025 & 2033
- Figure 71: Asia Pacific NA Managed Mobility Service Market Revenue (billion), by Deployment 2025 & 2033
- Figure 72: Asia Pacific NA Managed Mobility Service Market Volume (K Unit), by Deployment 2025 & 2033
- Figure 73: Asia Pacific NA Managed Mobility Service Market Revenue Share (%), by Deployment 2025 & 2033
- Figure 74: Asia Pacific NA Managed Mobility Service Market Volume Share (%), by Deployment 2025 & 2033
- Figure 75: Asia Pacific NA Managed Mobility Service Market Revenue (billion), by End-user Industry 2025 & 2033
- Figure 76: Asia Pacific NA Managed Mobility Service Market Volume (K Unit), by End-user Industry 2025 & 2033
- Figure 77: Asia Pacific NA Managed Mobility Service Market Revenue Share (%), by End-user Industry 2025 & 2033
- Figure 78: Asia Pacific NA Managed Mobility Service Market Volume Share (%), by End-user Industry 2025 & 2033
- Figure 79: Asia Pacific NA Managed Mobility Service Market Revenue (billion), by Country 2025 & 2033
- Figure 80: Asia Pacific NA Managed Mobility Service Market Volume (K Unit), by Country 2025 & 2033
- Figure 81: Asia Pacific NA Managed Mobility Service Market Revenue Share (%), by Country 2025 & 2033
- Figure 82: Asia Pacific NA Managed Mobility Service Market Volume Share (%), by Country 2025 & 2033
List of Tables
- Table 1: Global NA Managed Mobility Service Market Revenue billion Forecast, by Type 2020 & 2033
- Table 2: Global NA Managed Mobility Service Market Volume K Unit Forecast, by Type 2020 & 2033
- Table 3: Global NA Managed Mobility Service Market Revenue billion Forecast, by Deployment 2020 & 2033
- Table 4: Global NA Managed Mobility Service Market Volume K Unit Forecast, by Deployment 2020 & 2033
- Table 5: Global NA Managed Mobility Service Market Revenue billion Forecast, by End-user Industry 2020 & 2033
- Table 6: Global NA Managed Mobility Service Market Volume K Unit Forecast, by End-user Industry 2020 & 2033
- Table 7: Global NA Managed Mobility Service Market Revenue billion Forecast, by Region 2020 & 2033
- Table 8: Global NA Managed Mobility Service Market Volume K Unit Forecast, by Region 2020 & 2033
- Table 9: Global NA Managed Mobility Service Market Revenue billion Forecast, by Type 2020 & 2033
- Table 10: Global NA Managed Mobility Service Market Volume K Unit Forecast, by Type 2020 & 2033
- Table 11: Global NA Managed Mobility Service Market Revenue billion Forecast, by Deployment 2020 & 2033
- Table 12: Global NA Managed Mobility Service Market Volume K Unit Forecast, by Deployment 2020 & 2033
- Table 13: Global NA Managed Mobility Service Market Revenue billion Forecast, by End-user Industry 2020 & 2033
- Table 14: Global NA Managed Mobility Service Market Volume K Unit Forecast, by End-user Industry 2020 & 2033
- Table 15: Global NA Managed Mobility Service Market Revenue billion Forecast, by Country 2020 & 2033
- Table 16: Global NA Managed Mobility Service Market Volume K Unit Forecast, by Country 2020 & 2033
- Table 17: United States NA Managed Mobility Service Market Revenue (billion) Forecast, by Application 2020 & 2033
- Table 18: United States NA Managed Mobility Service Market Volume (K Unit) Forecast, by Application 2020 & 2033
- Table 19: Canada NA Managed Mobility Service Market Revenue (billion) Forecast, by Application 2020 & 2033
- Table 20: Canada NA Managed Mobility Service Market Volume (K Unit) Forecast, by Application 2020 & 2033
- Table 21: Mexico NA Managed Mobility Service Market Revenue (billion) Forecast, by Application 2020 & 2033
- Table 22: Mexico NA Managed Mobility Service Market Volume (K Unit) Forecast, by Application 2020 & 2033
- Table 23: Global NA Managed Mobility Service Market Revenue billion Forecast, by Type 2020 & 2033
- Table 24: Global NA Managed Mobility Service Market Volume K Unit Forecast, by Type 2020 & 2033
- Table 25: Global NA Managed Mobility Service Market Revenue billion Forecast, by Deployment 2020 & 2033
- Table 26: Global NA Managed Mobility Service Market Volume K Unit Forecast, by Deployment 2020 & 2033
- Table 27: Global NA Managed Mobility Service Market Revenue billion Forecast, by End-user Industry 2020 & 2033
- Table 28: Global NA Managed Mobility Service Market Volume K Unit Forecast, by End-user Industry 2020 & 2033
- Table 29: Global NA Managed Mobility Service Market Revenue billion Forecast, by Country 2020 & 2033
- Table 30: Global NA Managed Mobility Service Market Volume K Unit Forecast, by Country 2020 & 2033
- Table 31: Brazil NA Managed Mobility Service Market Revenue (billion) Forecast, by Application 2020 & 2033
- Table 32: Brazil NA Managed Mobility Service Market Volume (K Unit) Forecast, by Application 2020 & 2033
- Table 33: Argentina NA Managed Mobility Service Market Revenue (billion) Forecast, by Application 2020 & 2033
- Table 34: Argentina NA Managed Mobility Service Market Volume (K Unit) Forecast, by Application 2020 & 2033
- Table 35: Rest of South America NA Managed Mobility Service Market Revenue (billion) Forecast, by Application 2020 & 2033
- Table 36: Rest of South America NA Managed Mobility Service Market Volume (K Unit) Forecast, by Application 2020 & 2033
- Table 37: Global NA Managed Mobility Service Market Revenue billion Forecast, by Type 2020 & 2033
- Table 38: Global NA Managed Mobility Service Market Volume K Unit Forecast, by Type 2020 & 2033
- Table 39: Global NA Managed Mobility Service Market Revenue billion Forecast, by Deployment 2020 & 2033
- Table 40: Global NA Managed Mobility Service Market Volume K Unit Forecast, by Deployment 2020 & 2033
- Table 41: Global NA Managed Mobility Service Market Revenue billion Forecast, by End-user Industry 2020 & 2033
- Table 42: Global NA Managed Mobility Service Market Volume K Unit Forecast, by End-user Industry 2020 & 2033
- Table 43: Global NA Managed Mobility Service Market Revenue billion Forecast, by Country 2020 & 2033
- Table 44: Global NA Managed Mobility Service Market Volume K Unit Forecast, by Country 2020 & 2033
- Table 45: United Kingdom NA Managed Mobility Service Market Revenue (billion) Forecast, by Application 2020 & 2033
- Table 46: United Kingdom NA Managed Mobility Service Market Volume (K Unit) Forecast, by Application 2020 & 2033
- Table 47: Germany NA Managed Mobility Service Market Revenue (billion) Forecast, by Application 2020 & 2033
- Table 48: Germany NA Managed Mobility Service Market Volume (K Unit) Forecast, by Application 2020 & 2033
- Table 49: France NA Managed Mobility Service Market Revenue (billion) Forecast, by Application 2020 & 2033
- Table 50: France NA Managed Mobility Service Market Volume (K Unit) Forecast, by Application 2020 & 2033
- Table 51: Italy NA Managed Mobility Service Market Revenue (billion) Forecast, by Application 2020 & 2033
- Table 52: Italy NA Managed Mobility Service Market Volume (K Unit) Forecast, by Application 2020 & 2033
- Table 53: Spain NA Managed Mobility Service Market Revenue (billion) Forecast, by Application 2020 & 2033
- Table 54: Spain NA Managed Mobility Service Market Volume (K Unit) Forecast, by Application 2020 & 2033
- Table 55: Russia NA Managed Mobility Service Market Revenue (billion) Forecast, by Application 2020 & 2033
- Table 56: Russia NA Managed Mobility Service Market Volume (K Unit) Forecast, by Application 2020 & 2033
- Table 57: Benelux NA Managed Mobility Service Market Revenue (billion) Forecast, by Application 2020 & 2033
- Table 58: Benelux NA Managed Mobility Service Market Volume (K Unit) Forecast, by Application 2020 & 2033
- Table 59: Nordics NA Managed Mobility Service Market Revenue (billion) Forecast, by Application 2020 & 2033
- Table 60: Nordics NA Managed Mobility Service Market Volume (K Unit) Forecast, by Application 2020 & 2033
- Table 61: Rest of Europe NA Managed Mobility Service Market Revenue (billion) Forecast, by Application 2020 & 2033
- Table 62: Rest of Europe NA Managed Mobility Service Market Volume (K Unit) Forecast, by Application 2020 & 2033
- Table 63: Global NA Managed Mobility Service Market Revenue billion Forecast, by Type 2020 & 2033
- Table 64: Global NA Managed Mobility Service Market Volume K Unit Forecast, by Type 2020 & 2033
- Table 65: Global NA Managed Mobility Service Market Revenue billion Forecast, by Deployment 2020 & 2033
- Table 66: Global NA Managed Mobility Service Market Volume K Unit Forecast, by Deployment 2020 & 2033
- Table 67: Global NA Managed Mobility Service Market Revenue billion Forecast, by End-user Industry 2020 & 2033
- Table 68: Global NA Managed Mobility Service Market Volume K Unit Forecast, by End-user Industry 2020 & 2033
- Table 69: Global NA Managed Mobility Service Market Revenue billion Forecast, by Country 2020 & 2033
- Table 70: Global NA Managed Mobility Service Market Volume K Unit Forecast, by Country 2020 & 2033
- Table 71: Turkey NA Managed Mobility Service Market Revenue (billion) Forecast, by Application 2020 & 2033
- Table 72: Turkey NA Managed Mobility Service Market Volume (K Unit) Forecast, by Application 2020 & 2033
- Table 73: Israel NA Managed Mobility Service Market Revenue (billion) Forecast, by Application 2020 & 2033
- Table 74: Israel NA Managed Mobility Service Market Volume (K Unit) Forecast, by Application 2020 & 2033
- Table 75: GCC NA Managed Mobility Service Market Revenue (billion) Forecast, by Application 2020 & 2033
- Table 76: GCC NA Managed Mobility Service Market Volume (K Unit) Forecast, by Application 2020 & 2033
- Table 77: North Africa NA Managed Mobility Service Market Revenue (billion) Forecast, by Application 2020 & 2033
- Table 78: North Africa NA Managed Mobility Service Market Volume (K Unit) Forecast, by Application 2020 & 2033
- Table 79: South Africa NA Managed Mobility Service Market Revenue (billion) Forecast, by Application 2020 & 2033
- Table 80: South Africa NA Managed Mobility Service Market Volume (K Unit) Forecast, by Application 2020 & 2033
- Table 81: Rest of Middle East & Africa NA Managed Mobility Service Market Revenue (billion) Forecast, by Application 2020 & 2033
- Table 82: Rest of Middle East & Africa NA Managed Mobility Service Market Volume (K Unit) Forecast, by Application 2020 & 2033
- Table 83: Global NA Managed Mobility Service Market Revenue billion Forecast, by Type 2020 & 2033
- Table 84: Global NA Managed Mobility Service Market Volume K Unit Forecast, by Type 2020 & 2033
- Table 85: Global NA Managed Mobility Service Market Revenue billion Forecast, by Deployment 2020 & 2033
- Table 86: Global NA Managed Mobility Service Market Volume K Unit Forecast, by Deployment 2020 & 2033
- Table 87: Global NA Managed Mobility Service Market Revenue billion Forecast, by End-user Industry 2020 & 2033
- Table 88: Global NA Managed Mobility Service Market Volume K Unit Forecast, by End-user Industry 2020 & 2033
- Table 89: Global NA Managed Mobility Service Market Revenue billion Forecast, by Country 2020 & 2033
- Table 90: Global NA Managed Mobility Service Market Volume K Unit Forecast, by Country 2020 & 2033
- Table 91: China NA Managed Mobility Service Market Revenue (billion) Forecast, by Application 2020 & 2033
- Table 92: China NA Managed Mobility Service Market Volume (K Unit) Forecast, by Application 2020 & 2033
- Table 93: India NA Managed Mobility Service Market Revenue (billion) Forecast, by Application 2020 & 2033
- Table 94: India NA Managed Mobility Service Market Volume (K Unit) Forecast, by Application 2020 & 2033
- Table 95: Japan NA Managed Mobility Service Market Revenue (billion) Forecast, by Application 2020 & 2033
- Table 96: Japan NA Managed Mobility Service Market Volume (K Unit) Forecast, by Application 2020 & 2033
- Table 97: South Korea NA Managed Mobility Service Market Revenue (billion) Forecast, by Application 2020 & 2033
- Table 98: South Korea NA Managed Mobility Service Market Volume (K Unit) Forecast, by Application 2020 & 2033
- Table 99: ASEAN NA Managed Mobility Service Market Revenue (billion) Forecast, by Application 2020 & 2033
- Table 100: ASEAN NA Managed Mobility Service Market Volume (K Unit) Forecast, by Application 2020 & 2033
- Table 101: Oceania NA Managed Mobility Service Market Revenue (billion) Forecast, by Application 2020 & 2033
- Table 102: Oceania NA Managed Mobility Service Market Volume (K Unit) Forecast, by Application 2020 & 2033
- Table 103: Rest of Asia Pacific NA Managed Mobility Service Market Revenue (billion) Forecast, by Application 2020 & 2033
- Table 104: Rest of Asia Pacific NA Managed Mobility Service Market Volume (K Unit) Forecast, by Application 2020 & 2033
Frequently Asked Questions
1. What is the projected Compound Annual Growth Rate (CAGR) of the NA Managed Mobility Service Market?
The projected CAGR is approximately 25.77%.
2. Which companies are prominent players in the NA Managed Mobility Service Market?
Key companies in the market include DELL Technologies, Accenture PLC, Citrix System Inc, Orange SA, IBM Corporation, Wipro Ltd, Fujitsu Ltd, Hewlett Packard Enterprise Company, Tech Mahindra Limited, AT&T Inc, Telefonica SA.
3. What are the main segments of the NA Managed Mobility Service Market?
The market segments include Type, Deployment, End-user Industry.
4. Can you provide details about the market size?
The market size is estimated to be USD 39.62 billion as of 2022.
5. What are some drivers contributing to market growth?
; Increasing Acceptability for BYOD in Organizations; Companies Outsourcing IT Activities.
6. What are the notable trends driving market growth?
Mobile Application Management to Hold Major Share.
7. Are there any restraints impacting market growth?
; Lack of Control over Operations and Cost Visibility.
8. Can you provide examples of recent developments in the market?
N/A
9. What pricing options are available for accessing the report?
Pricing options include single-user, multi-user, and enterprise licenses priced at USD 4750, USD 4950, and USD 6800 respectively.
10. Is the market size provided in terms of value or volume?
The market size is provided in terms of value, measured in billion and volume, measured in K Unit.
11. Are there any specific market keywords associated with the report?
Yes, the market keyword associated with the report is "NA Managed Mobility Service Market," which aids in identifying and referencing the specific market segment covered.
12. How do I determine which pricing option suits my needs best?
The pricing options vary based on user requirements and access needs. Individual users may opt for single-user licenses, while businesses requiring broader access may choose multi-user or enterprise licenses for cost-effective access to the report.
13. Are there any additional resources or data provided in the NA Managed Mobility Service Market report?
While the report offers comprehensive insights, it's advisable to review the specific contents or supplementary materials provided to ascertain if additional resources or data are available.
14. How can I stay updated on further developments or reports in the NA Managed Mobility Service Market?
To stay informed about further developments, trends, and reports in the NA Managed Mobility Service Market, consider subscribing to industry newsletters, following relevant companies and organizations, or regularly checking reputable industry news sources and publications.
Methodology
Step 1 - Identification of Relevant Samples Size from Population Database


Step 2 - Approaches for Defining Global Market Size (Value, Volume* & Price*)

Note*: In applicable scenarios
Step 3 - Data Sources
Primary Research
- Web Analytics
- Survey Reports
- Research Institute
- Latest Research Reports
- Opinion Leaders
Secondary Research
- Annual Reports
- White Paper
- Latest Press Release
- Industry Association
- Paid Database
- Investor Presentations

Step 4 - Data Triangulation
Involves using different sources of information in order to increase the validity of a study
These sources are likely to be stakeholders in a program - participants, other researchers, program staff, other community members, and so on.
Then we put all data in single framework & apply various statistical tools to find out the dynamic on the market.
During the analysis stage, feedback from the stakeholder groups would be compared to determine areas of agreement as well as areas of divergence