
Key Insights
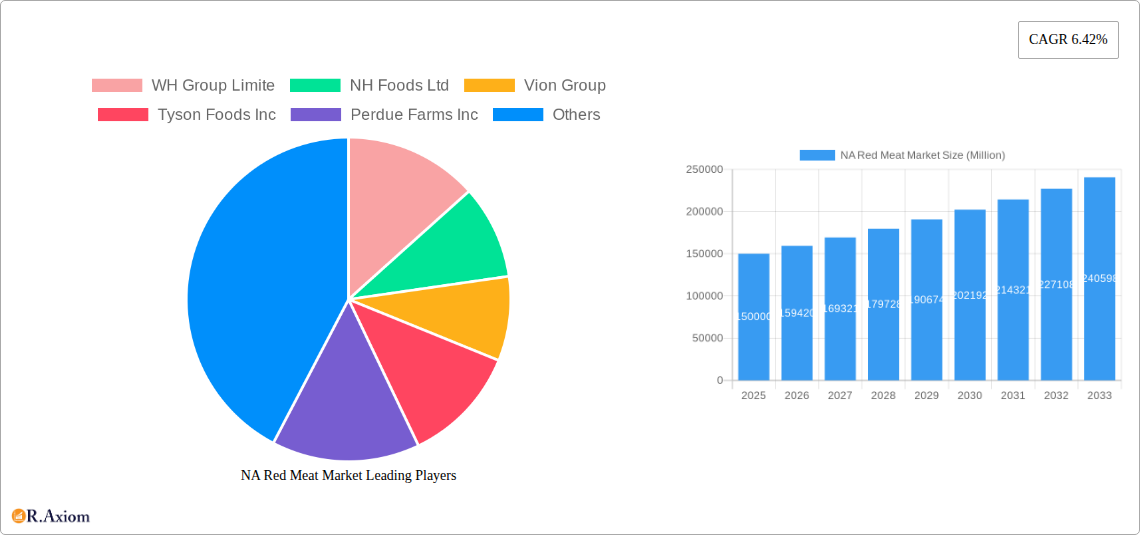
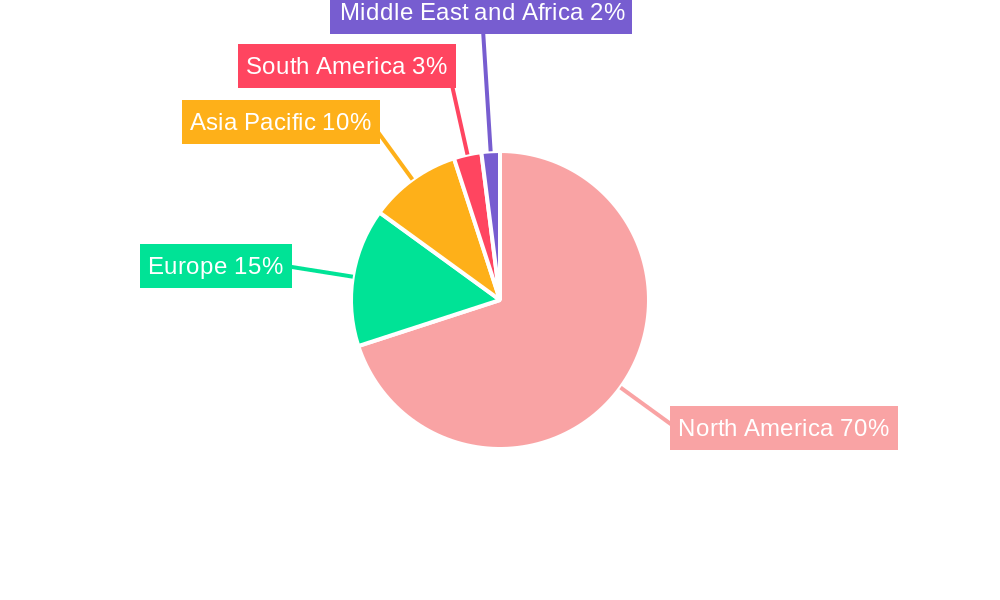
The North American red meat market, encompassing beef, pork, and mutton, presents a robust growth trajectory, projected to expand significantly over the forecast period (2025-2033). Driven by increasing consumer demand for protein-rich diets, coupled with rising disposable incomes and changing culinary preferences, the market is poised for substantial expansion. The canned segment is expected to maintain a steady growth rate, while fresh/chilled and frozen red meat segments are likely to witness the most significant growth, reflecting consumer preference for convenience and readily available options. The on-trade sector, including restaurants and food service establishments, will contribute considerably to market growth, while the off-trade segment (retail sales) will maintain a substantial share. Factors like increasing health consciousness, promoting leaner cuts and alternative protein sources might act as slight restraints, however the overall growth is expected to remain positive. Major players like Tyson Foods, JBS SA, and Cargill are strategically investing in value-added products, processing technologies, and efficient supply chains to capitalize on the burgeoning demand and improve profitability. Regional variations in consumption patterns exist, with the United States dominating the market share due to its large population and higher per capita consumption of red meat compared to Canada and Mexico.
The diverse range of product forms—canned, fresh/chilled, frozen, and processed— caters to varied consumer needs and preferences. Beef consistently holds the largest market share, followed by pork, with mutton accounting for a smaller but steadily growing segment. The strong presence of established industry giants, combined with the emergence of smaller, specialized players focusing on niche markets like organic and grass-fed red meat, ensures a dynamic and competitive landscape. Looking ahead, the market will witness continued innovation in packaging, processing techniques, and product diversification, including value-added items like ready-to-cook meals and marinated cuts, aiming to cater to evolving consumer demands and enhance overall market attractiveness. Sustainable and ethical sourcing practices are gaining importance, influencing consumer purchasing decisions and compelling producers to adopt more responsible and transparent approaches.
North America Red Meat Market Report: 2019-2033
This comprehensive report provides an in-depth analysis of the North America red meat market, covering the period from 2019 to 2033. It offers actionable insights for industry stakeholders, investors, and businesses operating within this dynamic sector. With a focus on key market segments, leading players, and future trends, this report is an essential resource for navigating the complexities of the NA red meat market. The report’s detailed segmentation allows for a granular understanding of market dynamics across various forms (Canned, Fresh/Chilled, Frozen, Processed), types (Beef, Mutton, Pork, Other Meat), and distribution channels (Off-Trade, On-Trade). We project a market size of xx Million by 2025 and xx Million by 2033.
NA Red Meat Market Market Concentration & Innovation
This section analyzes the competitive landscape of the North American red meat market, focusing on market concentration, innovation drivers, regulatory frameworks, product substitutes, end-user trends, and merger & acquisition (M&A) activities. The market is characterized by a moderate level of concentration, with a few major players holding significant market share. However, the presence of numerous smaller players also contributes to competitive dynamics.
- Market Share: Top 5 players hold an estimated xx% market share in 2025, while the remaining xx% is distributed among numerous smaller companies.
- Innovation Drivers: Consumer demand for healthier, more sustainable, and convenient red meat products fuels innovation in processing techniques, packaging, and product offerings. Technological advancements in farming and processing methods contribute to efficiency and cost reduction.
- Regulatory Framework: Stringent food safety regulations and labeling requirements shape the market's dynamics. Growing environmental concerns necessitate the adoption of sustainable farming practices, adding to regulatory pressures.
- Product Substitutes: Plant-based meat alternatives pose a growing threat to the traditional red meat market, driving innovation and differentiation strategies among red meat producers.
- End-User Trends: Changing consumer preferences towards healthier diets, convenience, and ethical sourcing influence product demand and innovation.
- M&A Activities: Significant M&A activity has reshaped the market, resulting in increased consolidation. Total M&A deal values from 2019 to 2024 are estimated at xx Million, with average deal size being xx Million.
NA Red Meat Market Industry Trends & Insights
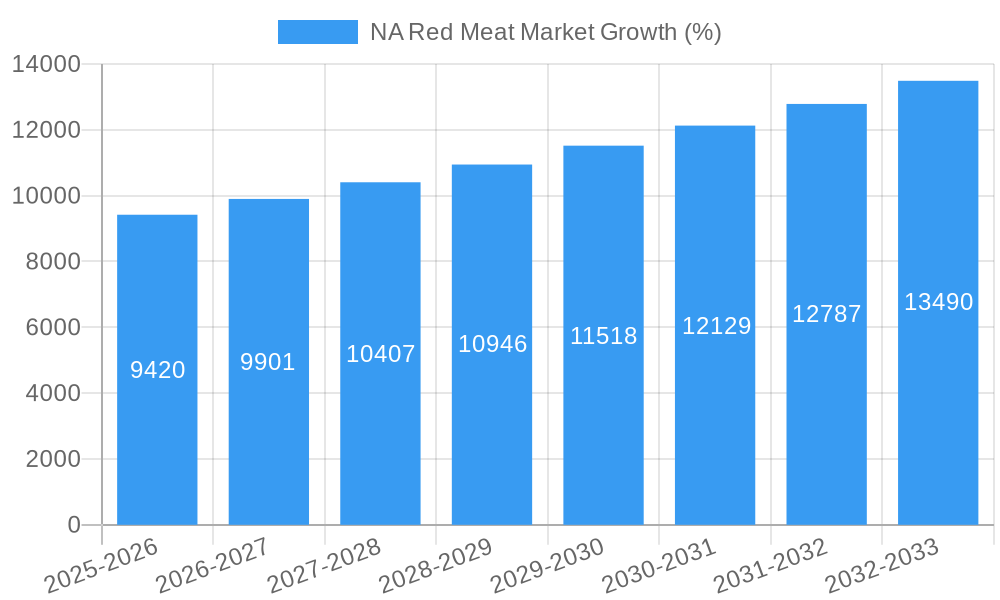
This section explores the key factors driving growth and shaping the dynamics of the North American red meat market. The market is witnessing robust growth, driven by factors such as rising disposable incomes, increasing consumption of red meat in certain demographics, and the expansion of food service sectors. However, challenges such as fluctuations in raw material prices, supply chain disruptions, and growing consumer preference for alternative protein sources also impact market performance. We project a CAGR of xx% during the forecast period (2025-2033), with market penetration of xx% in key segments by 2033.
Dominant Markets & Segments in NA Red Meat Market
This section identifies the leading segments and regions within the North American red meat market. The analysis includes market size, growth rate, and key drivers for each dominant segment and region.
Dominant Region: The US is the dominant market for red meat in North America, due to high consumption levels, strong infrastructure, and a well-established processing and distribution network.
Dominant Form: Fresh/Chilled red meat commands the largest market share among all forms due to consumer preference for freshness and quality. Growth is driven by increased availability in retail channels and rising consumer demand for convenience.
Dominant Type: Beef is the dominant type of red meat in North America, owing to its popularity and versatility in culinary applications. Growing demand for high-quality cuts and value-added beef products contributes to its market dominance.
Dominant Distribution Channel: Off-trade (retail) dominates distribution, reflecting consumers' preference for purchasing red meat from supermarkets and hypermarkets. On-trade (food service) shows steady growth, fueled by the expansion of restaurants and food service providers.
Key Drivers for Dominant Segments:
- Economic Policies: Government support for the agricultural sector and trade policies influence market dynamics.
- Infrastructure: A robust cold chain logistics network facilitates efficient distribution of perishable red meat products.
- Consumer Preferences: Demand for specific cuts, preparations, and ethically sourced meat influences product offerings and market segments.
NA Red Meat Market Product Developments
Recent years have witnessed significant product innovation in the North American red meat market. This includes the development of value-added products, such as marinated meats, ready-to-cook meals, and organic red meat options. Technological advancements, including improved processing techniques and packaging solutions, play a crucial role in enhancing product quality, safety, and shelf life. Furthermore, the market is seeing a rise in convenience products catering to busy consumers. These developments aim to address changing consumer preferences and sustain market competitiveness amid the rise of plant-based alternatives.
Report Scope & Segmentation Analysis
This report segments the North American red meat market based on form (Canned, Fresh/Chilled, Frozen, Processed), type (Beef, Mutton, Pork, Other Meat), and distribution channel (Off-Trade, On-Trade). Each segment’s market size, growth rate, and competitive dynamics are analyzed across the historical period (2019-2024), base year (2025), and forecast period (2025-2033). For instance, the Fresh/Chilled segment is projected to maintain strong growth due to consumer preference. Similarly, the Beef segment holds a leading position due to high demand, while the Off-Trade segment accounts for the largest market share in distribution channels.
Key Drivers of NA Red Meat Market Growth
The growth of the North American red meat market is propelled by various factors. Rising disposable incomes enable consumers to spend more on protein-rich foods. The popularity of barbecuing and grilling further boosts consumption, while the expansion of the food service industry creates greater demand. Furthermore, government support for the agricultural sector contributes to the market's expansion.
Challenges in the NA Red Meat Market Sector
Despite its growth potential, the North American red meat market faces several challenges. Fluctuations in livestock prices and feed costs impact profitability. Stringent food safety regulations necessitate high compliance costs. Supply chain disruptions can cause price volatility and shortages. Finally, increasing competition from plant-based meat alternatives exerts downward pressure on market shares and prices.
Emerging Opportunities in NA Red Meat Market
The NA red meat market presents promising opportunities. Growing demand for organic and sustainably produced red meat creates niche markets. Value-added products and convenient ready-to-eat options cater to busy lifestyles. Innovation in packaging and processing technologies enhances product quality and shelf life. Lastly, the growing interest in high-protein diets could further drive market expansion.
Leading Players in the NA Red Meat Market Market
- WH Group Limited
- NH Foods Ltd
- Vion Group
- Tyson Foods Inc
- Perdue Farms Inc
- Conagra Brands Inc
- Sysco Corporation
- The Kraft Heinz Company
- Hormel Foods Corporation
- Cargill Inc
- Marfrig Global Foods S A
- The Clemens Family Corporation
- JBS SA
- OSI Group
Key Developments in NA Red Meat Market Industry
- November 2022: Conagra Brands, Inc. announced a USD 60 Million investment to expand its Troy, Ohio facility, boosting Slim Jim production capacity.
- December 2022: JBS acquired certain assets from TriOak Foods, enhancing its supply chain control.
- April 2023: JBS USA's Swift Prepared Food launched Principe Foods, a producer of high-quality Italian meats and charcuterie.
Strategic Outlook for NA Red Meat Market Market
The future of the North American red meat market appears promising, driven by consistent demand, innovation in product offerings, and the expansion of food service channels. While challenges such as supply chain vulnerabilities and competition from alternative proteins persist, the market's long-term growth potential remains strong. Strategic investments in sustainable practices, technological advancements, and value-added products will be crucial for success in this evolving landscape.
NA Red Meat Market Segmentation
-
1. Type
- 1.1. Beef
- 1.2. Mutton
- 1.3. Pork
- 1.4. Other Meat
-
2. Form
- 2.1. Canned
- 2.2. Fresh / Chilled
- 2.3. Frozen
- 2.4. Processed
-
3. Distribution Channel
-
3.1. Off-Trade
- 3.1.1. Convenience Stores
- 3.1.2. Online Channel
- 3.1.3. Supermarkets and Hypermarkets
- 3.1.4. Others
- 3.2. On-Trade
-
3.1. Off-Trade
NA Red Meat Market Segmentation By Geography
-
1. North America
- 1.1. United States
- 1.2. Canada
- 1.3. Mexico
-
2. South America
- 2.1. Brazil
- 2.2. Argentina
- 2.3. Rest of South America
-
3. Europe
- 3.1. United Kingdom
- 3.2. Germany
- 3.3. France
- 3.4. Italy
- 3.5. Spain
- 3.6. Russia
- 3.7. Benelux
- 3.8. Nordics
- 3.9. Rest of Europe
-
4. Middle East & Africa
- 4.1. Turkey
- 4.2. Israel
- 4.3. GCC
- 4.4. North Africa
- 4.5. South Africa
- 4.6. Rest of Middle East & Africa
-
5. Asia Pacific
- 5.1. China
- 5.2. India
- 5.3. Japan
- 5.4. South Korea
- 5.5. ASEAN
- 5.6. Oceania
- 5.7. Rest of Asia Pacific
NA Red Meat Market REPORT HIGHLIGHTS
| Aspects | Details |
|---|---|
| Study Period | 2019-2033 |
| Base Year | 2024 |
| Estimated Year | 2025 |
| Forecast Period | 2025-2033 |
| Historical Period | 2019-2024 |
| Growth Rate | CAGR of 6.42% from 2019-2033 |
| Segmentation |
|
Table of Contents
- 1. Introduction
- 1.1. Research Scope
- 1.2. Market Segmentation
- 1.3. Research Methodology
- 1.4. Definitions and Assumptions
- 2. Executive Summary
- 2.1. Introduction
- 3. Market Dynamics
- 3.1. Introduction
- 3.2. Market Drivers
- 3.2.1. Increasing Demand for Low-Fat and Low-Calorie Food; Increasing Product Innovation
- 3.3. Market Restrains
- 3.3.1. ; Threat of New Entrants; Bargaining Power of Buyers/Consumers; Bargaining Power of Suppliers; Threat of Substitute Products; Degree Of Competition
- 3.4. Market Trends
- 3.4.1. OTHER KEY INDUSTRY TRENDS COVERED IN THE REPORT
- 4. Market Factor Analysis
- 4.1. Porters Five Forces
- 4.2. Supply/Value Chain
- 4.3. PESTEL analysis
- 4.4. Market Entropy
- 4.5. Patent/Trademark Analysis
- 5. Global NA Red Meat Market Analysis, Insights and Forecast, 2019-2031
- 5.1. Market Analysis, Insights and Forecast - by Type
- 5.1.1. Beef
- 5.1.2. Mutton
- 5.1.3. Pork
- 5.1.4. Other Meat
- 5.2. Market Analysis, Insights and Forecast - by Form
- 5.2.1. Canned
- 5.2.2. Fresh / Chilled
- 5.2.3. Frozen
- 5.2.4. Processed
- 5.3. Market Analysis, Insights and Forecast - by Distribution Channel
- 5.3.1. Off-Trade
- 5.3.1.1. Convenience Stores
- 5.3.1.2. Online Channel
- 5.3.1.3. Supermarkets and Hypermarkets
- 5.3.1.4. Others
- 5.3.2. On-Trade
- 5.3.1. Off-Trade
- 5.4. Market Analysis, Insights and Forecast - by Region
- 5.4.1. North America
- 5.4.2. South America
- 5.4.3. Europe
- 5.4.4. Middle East & Africa
- 5.4.5. Asia Pacific
- 5.1. Market Analysis, Insights and Forecast - by Type
- 6. North America NA Red Meat Market Analysis, Insights and Forecast, 2019-2031
- 6.1. Market Analysis, Insights and Forecast - by Type
- 6.1.1. Beef
- 6.1.2. Mutton
- 6.1.3. Pork
- 6.1.4. Other Meat
- 6.2. Market Analysis, Insights and Forecast - by Form
- 6.2.1. Canned
- 6.2.2. Fresh / Chilled
- 6.2.3. Frozen
- 6.2.4. Processed
- 6.3. Market Analysis, Insights and Forecast - by Distribution Channel
- 6.3.1. Off-Trade
- 6.3.1.1. Convenience Stores
- 6.3.1.2. Online Channel
- 6.3.1.3. Supermarkets and Hypermarkets
- 6.3.1.4. Others
- 6.3.2. On-Trade
- 6.3.1. Off-Trade
- 6.1. Market Analysis, Insights and Forecast - by Type
- 7. South America NA Red Meat Market Analysis, Insights and Forecast, 2019-2031
- 7.1. Market Analysis, Insights and Forecast - by Type
- 7.1.1. Beef
- 7.1.2. Mutton
- 7.1.3. Pork
- 7.1.4. Other Meat
- 7.2. Market Analysis, Insights and Forecast - by Form
- 7.2.1. Canned
- 7.2.2. Fresh / Chilled
- 7.2.3. Frozen
- 7.2.4. Processed
- 7.3. Market Analysis, Insights and Forecast - by Distribution Channel
- 7.3.1. Off-Trade
- 7.3.1.1. Convenience Stores
- 7.3.1.2. Online Channel
- 7.3.1.3. Supermarkets and Hypermarkets
- 7.3.1.4. Others
- 7.3.2. On-Trade
- 7.3.1. Off-Trade
- 7.1. Market Analysis, Insights and Forecast - by Type
- 8. Europe NA Red Meat Market Analysis, Insights and Forecast, 2019-2031
- 8.1. Market Analysis, Insights and Forecast - by Type
- 8.1.1. Beef
- 8.1.2. Mutton
- 8.1.3. Pork
- 8.1.4. Other Meat
- 8.2. Market Analysis, Insights and Forecast - by Form
- 8.2.1. Canned
- 8.2.2. Fresh / Chilled
- 8.2.3. Frozen
- 8.2.4. Processed
- 8.3. Market Analysis, Insights and Forecast - by Distribution Channel
- 8.3.1. Off-Trade
- 8.3.1.1. Convenience Stores
- 8.3.1.2. Online Channel
- 8.3.1.3. Supermarkets and Hypermarkets
- 8.3.1.4. Others
- 8.3.2. On-Trade
- 8.3.1. Off-Trade
- 8.1. Market Analysis, Insights and Forecast - by Type
- 9. Middle East & Africa NA Red Meat Market Analysis, Insights and Forecast, 2019-2031
- 9.1. Market Analysis, Insights and Forecast - by Type
- 9.1.1. Beef
- 9.1.2. Mutton
- 9.1.3. Pork
- 9.1.4. Other Meat
- 9.2. Market Analysis, Insights and Forecast - by Form
- 9.2.1. Canned
- 9.2.2. Fresh / Chilled
- 9.2.3. Frozen
- 9.2.4. Processed
- 9.3. Market Analysis, Insights and Forecast - by Distribution Channel
- 9.3.1. Off-Trade
- 9.3.1.1. Convenience Stores
- 9.3.1.2. Online Channel
- 9.3.1.3. Supermarkets and Hypermarkets
- 9.3.1.4. Others
- 9.3.2. On-Trade
- 9.3.1. Off-Trade
- 9.1. Market Analysis, Insights and Forecast - by Type
- 10. Asia Pacific NA Red Meat Market Analysis, Insights and Forecast, 2019-2031
- 10.1. Market Analysis, Insights and Forecast - by Type
- 10.1.1. Beef
- 10.1.2. Mutton
- 10.1.3. Pork
- 10.1.4. Other Meat
- 10.2. Market Analysis, Insights and Forecast - by Form
- 10.2.1. Canned
- 10.2.2. Fresh / Chilled
- 10.2.3. Frozen
- 10.2.4. Processed
- 10.3. Market Analysis, Insights and Forecast - by Distribution Channel
- 10.3.1. Off-Trade
- 10.3.1.1. Convenience Stores
- 10.3.1.2. Online Channel
- 10.3.1.3. Supermarkets and Hypermarkets
- 10.3.1.4. Others
- 10.3.2. On-Trade
- 10.3.1. Off-Trade
- 10.1. Market Analysis, Insights and Forecast - by Type
- 11. North America NA Red Meat Market Analysis, Insights and Forecast, 2019-2031
- 11.1. Market Analysis, Insights and Forecast - By Country/Sub-region
- 11.1.1 United States
- 11.1.2 Canada
- 11.1.3 Mexico
- 11.1.4 Rest of North America
- 12. Europe NA Red Meat Market Analysis, Insights and Forecast, 2019-2031
- 12.1. Market Analysis, Insights and Forecast - By Country/Sub-region
- 12.1.1 Spain
- 12.1.2 United Kingdom
- 12.1.3 Germany
- 12.1.4 France
- 12.1.5 Italy
- 12.1.6 Russia
- 12.1.7 Rest of Europe
- 13. Asia Pacific NA Red Meat Market Analysis, Insights and Forecast, 2019-2031
- 13.1. Market Analysis, Insights and Forecast - By Country/Sub-region
- 13.1.1 China
- 13.1.2 Japan
- 13.1.3 India
- 13.1.4 Australia
- 13.1.5 Rest of Asia Pacific
- 14. South America NA Red Meat Market Analysis, Insights and Forecast, 2019-2031
- 14.1. Market Analysis, Insights and Forecast - By Country/Sub-region
- 14.1.1 Brazil
- 14.1.2 Argentina
- 14.1.3 Rest of South America
- 15. Middle East and Africa NA Red Meat Market Analysis, Insights and Forecast, 2019-2031
- 15.1. Market Analysis, Insights and Forecast - By Country/Sub-region
- 15.1.1 South Africa
- 15.1.2 United Arab Emirates
- 15.1.3 Rest of Middle East and Africa
- 16. Competitive Analysis
- 16.1. Global Market Share Analysis 2024
- 16.2. Company Profiles
- 16.2.1 WH Group Limite
- 16.2.1.1. Overview
- 16.2.1.2. Products
- 16.2.1.3. SWOT Analysis
- 16.2.1.4. Recent Developments
- 16.2.1.5. Financials (Based on Availability)
- 16.2.2 NH Foods Ltd
- 16.2.2.1. Overview
- 16.2.2.2. Products
- 16.2.2.3. SWOT Analysis
- 16.2.2.4. Recent Developments
- 16.2.2.5. Financials (Based on Availability)
- 16.2.3 Vion Group
- 16.2.3.1. Overview
- 16.2.3.2. Products
- 16.2.3.3. SWOT Analysis
- 16.2.3.4. Recent Developments
- 16.2.3.5. Financials (Based on Availability)
- 16.2.4 Tyson Foods Inc
- 16.2.4.1. Overview
- 16.2.4.2. Products
- 16.2.4.3. SWOT Analysis
- 16.2.4.4. Recent Developments
- 16.2.4.5. Financials (Based on Availability)
- 16.2.5 Perdue Farms Inc
- 16.2.5.1. Overview
- 16.2.5.2. Products
- 16.2.5.3. SWOT Analysis
- 16.2.5.4. Recent Developments
- 16.2.5.5. Financials (Based on Availability)
- 16.2.6 Conagra Brands Inc
- 16.2.6.1. Overview
- 16.2.6.2. Products
- 16.2.6.3. SWOT Analysis
- 16.2.6.4. Recent Developments
- 16.2.6.5. Financials (Based on Availability)
- 16.2.7 Sysco Corporation
- 16.2.7.1. Overview
- 16.2.7.2. Products
- 16.2.7.3. SWOT Analysis
- 16.2.7.4. Recent Developments
- 16.2.7.5. Financials (Based on Availability)
- 16.2.8 The Kraft Heinz Company
- 16.2.8.1. Overview
- 16.2.8.2. Products
- 16.2.8.3. SWOT Analysis
- 16.2.8.4. Recent Developments
- 16.2.8.5. Financials (Based on Availability)
- 16.2.9 Hormel Foods Corporation
- 16.2.9.1. Overview
- 16.2.9.2. Products
- 16.2.9.3. SWOT Analysis
- 16.2.9.4. Recent Developments
- 16.2.9.5. Financials (Based on Availability)
- 16.2.10 Cargill Inc
- 16.2.10.1. Overview
- 16.2.10.2. Products
- 16.2.10.3. SWOT Analysis
- 16.2.10.4. Recent Developments
- 16.2.10.5. Financials (Based on Availability)
- 16.2.11 Marfrig Global Foods S A
- 16.2.11.1. Overview
- 16.2.11.2. Products
- 16.2.11.3. SWOT Analysis
- 16.2.11.4. Recent Developments
- 16.2.11.5. Financials (Based on Availability)
- 16.2.12 The Clemens Family Corporation
- 16.2.12.1. Overview
- 16.2.12.2. Products
- 16.2.12.3. SWOT Analysis
- 16.2.12.4. Recent Developments
- 16.2.12.5. Financials (Based on Availability)
- 16.2.13 JBS SA
- 16.2.13.1. Overview
- 16.2.13.2. Products
- 16.2.13.3. SWOT Analysis
- 16.2.13.4. Recent Developments
- 16.2.13.5. Financials (Based on Availability)
- 16.2.14 OSI Group
- 16.2.14.1. Overview
- 16.2.14.2. Products
- 16.2.14.3. SWOT Analysis
- 16.2.14.4. Recent Developments
- 16.2.14.5. Financials (Based on Availability)
- 16.2.1 WH Group Limite
List of Figures
- Figure 1: Global NA Red Meat Market Revenue Breakdown (Million, %) by Region 2024 & 2032
- Figure 2: North America NA Red Meat Market Revenue (Million), by Country 2024 & 2032
- Figure 3: North America NA Red Meat Market Revenue Share (%), by Country 2024 & 2032
- Figure 4: Europe NA Red Meat Market Revenue (Million), by Country 2024 & 2032
- Figure 5: Europe NA Red Meat Market Revenue Share (%), by Country 2024 & 2032
- Figure 6: Asia Pacific NA Red Meat Market Revenue (Million), by Country 2024 & 2032
- Figure 7: Asia Pacific NA Red Meat Market Revenue Share (%), by Country 2024 & 2032
- Figure 8: South America NA Red Meat Market Revenue (Million), by Country 2024 & 2032
- Figure 9: South America NA Red Meat Market Revenue Share (%), by Country 2024 & 2032
- Figure 10: Middle East and Africa NA Red Meat Market Revenue (Million), by Country 2024 & 2032
- Figure 11: Middle East and Africa NA Red Meat Market Revenue Share (%), by Country 2024 & 2032
- Figure 12: North America NA Red Meat Market Revenue (Million), by Type 2024 & 2032
- Figure 13: North America NA Red Meat Market Revenue Share (%), by Type 2024 & 2032
- Figure 14: North America NA Red Meat Market Revenue (Million), by Form 2024 & 2032
- Figure 15: North America NA Red Meat Market Revenue Share (%), by Form 2024 & 2032
- Figure 16: North America NA Red Meat Market Revenue (Million), by Distribution Channel 2024 & 2032
- Figure 17: North America NA Red Meat Market Revenue Share (%), by Distribution Channel 2024 & 2032
- Figure 18: North America NA Red Meat Market Revenue (Million), by Country 2024 & 2032
- Figure 19: North America NA Red Meat Market Revenue Share (%), by Country 2024 & 2032
- Figure 20: South America NA Red Meat Market Revenue (Million), by Type 2024 & 2032
- Figure 21: South America NA Red Meat Market Revenue Share (%), by Type 2024 & 2032
- Figure 22: South America NA Red Meat Market Revenue (Million), by Form 2024 & 2032
- Figure 23: South America NA Red Meat Market Revenue Share (%), by Form 2024 & 2032
- Figure 24: South America NA Red Meat Market Revenue (Million), by Distribution Channel 2024 & 2032
- Figure 25: South America NA Red Meat Market Revenue Share (%), by Distribution Channel 2024 & 2032
- Figure 26: South America NA Red Meat Market Revenue (Million), by Country 2024 & 2032
- Figure 27: South America NA Red Meat Market Revenue Share (%), by Country 2024 & 2032
- Figure 28: Europe NA Red Meat Market Revenue (Million), by Type 2024 & 2032
- Figure 29: Europe NA Red Meat Market Revenue Share (%), by Type 2024 & 2032
- Figure 30: Europe NA Red Meat Market Revenue (Million), by Form 2024 & 2032
- Figure 31: Europe NA Red Meat Market Revenue Share (%), by Form 2024 & 2032
- Figure 32: Europe NA Red Meat Market Revenue (Million), by Distribution Channel 2024 & 2032
- Figure 33: Europe NA Red Meat Market Revenue Share (%), by Distribution Channel 2024 & 2032
- Figure 34: Europe NA Red Meat Market Revenue (Million), by Country 2024 & 2032
- Figure 35: Europe NA Red Meat Market Revenue Share (%), by Country 2024 & 2032
- Figure 36: Middle East & Africa NA Red Meat Market Revenue (Million), by Type 2024 & 2032
- Figure 37: Middle East & Africa NA Red Meat Market Revenue Share (%), by Type 2024 & 2032
- Figure 38: Middle East & Africa NA Red Meat Market Revenue (Million), by Form 2024 & 2032
- Figure 39: Middle East & Africa NA Red Meat Market Revenue Share (%), by Form 2024 & 2032
- Figure 40: Middle East & Africa NA Red Meat Market Revenue (Million), by Distribution Channel 2024 & 2032
- Figure 41: Middle East & Africa NA Red Meat Market Revenue Share (%), by Distribution Channel 2024 & 2032
- Figure 42: Middle East & Africa NA Red Meat Market Revenue (Million), by Country 2024 & 2032
- Figure 43: Middle East & Africa NA Red Meat Market Revenue Share (%), by Country 2024 & 2032
- Figure 44: Asia Pacific NA Red Meat Market Revenue (Million), by Type 2024 & 2032
- Figure 45: Asia Pacific NA Red Meat Market Revenue Share (%), by Type 2024 & 2032
- Figure 46: Asia Pacific NA Red Meat Market Revenue (Million), by Form 2024 & 2032
- Figure 47: Asia Pacific NA Red Meat Market Revenue Share (%), by Form 2024 & 2032
- Figure 48: Asia Pacific NA Red Meat Market Revenue (Million), by Distribution Channel 2024 & 2032
- Figure 49: Asia Pacific NA Red Meat Market Revenue Share (%), by Distribution Channel 2024 & 2032
- Figure 50: Asia Pacific NA Red Meat Market Revenue (Million), by Country 2024 & 2032
- Figure 51: Asia Pacific NA Red Meat Market Revenue Share (%), by Country 2024 & 2032
List of Tables
- Table 1: Global NA Red Meat Market Revenue Million Forecast, by Region 2019 & 2032
- Table 2: Global NA Red Meat Market Revenue Million Forecast, by Type 2019 & 2032
- Table 3: Global NA Red Meat Market Revenue Million Forecast, by Form 2019 & 2032
- Table 4: Global NA Red Meat Market Revenue Million Forecast, by Distribution Channel 2019 & 2032
- Table 5: Global NA Red Meat Market Revenue Million Forecast, by Region 2019 & 2032
- Table 6: Global NA Red Meat Market Revenue Million Forecast, by Country 2019 & 2032
- Table 7: United States NA Red Meat Market Revenue (Million) Forecast, by Application 2019 & 2032
- Table 8: Canada NA Red Meat Market Revenue (Million) Forecast, by Application 2019 & 2032
- Table 9: Mexico NA Red Meat Market Revenue (Million) Forecast, by Application 2019 & 2032
- Table 10: Rest of North America NA Red Meat Market Revenue (Million) Forecast, by Application 2019 & 2032
- Table 11: Global NA Red Meat Market Revenue Million Forecast, by Country 2019 & 2032
- Table 12: Spain NA Red Meat Market Revenue (Million) Forecast, by Application 2019 & 2032
- Table 13: United Kingdom NA Red Meat Market Revenue (Million) Forecast, by Application 2019 & 2032
- Table 14: Germany NA Red Meat Market Revenue (Million) Forecast, by Application 2019 & 2032
- Table 15: France NA Red Meat Market Revenue (Million) Forecast, by Application 2019 & 2032
- Table 16: Italy NA Red Meat Market Revenue (Million) Forecast, by Application 2019 & 2032
- Table 17: Russia NA Red Meat Market Revenue (Million) Forecast, by Application 2019 & 2032
- Table 18: Rest of Europe NA Red Meat Market Revenue (Million) Forecast, by Application 2019 & 2032
- Table 19: Global NA Red Meat Market Revenue Million Forecast, by Country 2019 & 2032
- Table 20: China NA Red Meat Market Revenue (Million) Forecast, by Application 2019 & 2032
- Table 21: Japan NA Red Meat Market Revenue (Million) Forecast, by Application 2019 & 2032
- Table 22: India NA Red Meat Market Revenue (Million) Forecast, by Application 2019 & 2032
- Table 23: Australia NA Red Meat Market Revenue (Million) Forecast, by Application 2019 & 2032
- Table 24: Rest of Asia Pacific NA Red Meat Market Revenue (Million) Forecast, by Application 2019 & 2032
- Table 25: Global NA Red Meat Market Revenue Million Forecast, by Country 2019 & 2032
- Table 26: Brazil NA Red Meat Market Revenue (Million) Forecast, by Application 2019 & 2032
- Table 27: Argentina NA Red Meat Market Revenue (Million) Forecast, by Application 2019 & 2032
- Table 28: Rest of South America NA Red Meat Market Revenue (Million) Forecast, by Application 2019 & 2032
- Table 29: Global NA Red Meat Market Revenue Million Forecast, by Country 2019 & 2032
- Table 30: South Africa NA Red Meat Market Revenue (Million) Forecast, by Application 2019 & 2032
- Table 31: United Arab Emirates NA Red Meat Market Revenue (Million) Forecast, by Application 2019 & 2032
- Table 32: Rest of Middle East and Africa NA Red Meat Market Revenue (Million) Forecast, by Application 2019 & 2032
- Table 33: Global NA Red Meat Market Revenue Million Forecast, by Type 2019 & 2032
- Table 34: Global NA Red Meat Market Revenue Million Forecast, by Form 2019 & 2032
- Table 35: Global NA Red Meat Market Revenue Million Forecast, by Distribution Channel 2019 & 2032
- Table 36: Global NA Red Meat Market Revenue Million Forecast, by Country 2019 & 2032
- Table 37: United States NA Red Meat Market Revenue (Million) Forecast, by Application 2019 & 2032
- Table 38: Canada NA Red Meat Market Revenue (Million) Forecast, by Application 2019 & 2032
- Table 39: Mexico NA Red Meat Market Revenue (Million) Forecast, by Application 2019 & 2032
- Table 40: Global NA Red Meat Market Revenue Million Forecast, by Type 2019 & 2032
- Table 41: Global NA Red Meat Market Revenue Million Forecast, by Form 2019 & 2032
- Table 42: Global NA Red Meat Market Revenue Million Forecast, by Distribution Channel 2019 & 2032
- Table 43: Global NA Red Meat Market Revenue Million Forecast, by Country 2019 & 2032
- Table 44: Brazil NA Red Meat Market Revenue (Million) Forecast, by Application 2019 & 2032
- Table 45: Argentina NA Red Meat Market Revenue (Million) Forecast, by Application 2019 & 2032
- Table 46: Rest of South America NA Red Meat Market Revenue (Million) Forecast, by Application 2019 & 2032
- Table 47: Global NA Red Meat Market Revenue Million Forecast, by Type 2019 & 2032
- Table 48: Global NA Red Meat Market Revenue Million Forecast, by Form 2019 & 2032
- Table 49: Global NA Red Meat Market Revenue Million Forecast, by Distribution Channel 2019 & 2032
- Table 50: Global NA Red Meat Market Revenue Million Forecast, by Country 2019 & 2032
- Table 51: United Kingdom NA Red Meat Market Revenue (Million) Forecast, by Application 2019 & 2032
- Table 52: Germany NA Red Meat Market Revenue (Million) Forecast, by Application 2019 & 2032
- Table 53: France NA Red Meat Market Revenue (Million) Forecast, by Application 2019 & 2032
- Table 54: Italy NA Red Meat Market Revenue (Million) Forecast, by Application 2019 & 2032
- Table 55: Spain NA Red Meat Market Revenue (Million) Forecast, by Application 2019 & 2032
- Table 56: Russia NA Red Meat Market Revenue (Million) Forecast, by Application 2019 & 2032
- Table 57: Benelux NA Red Meat Market Revenue (Million) Forecast, by Application 2019 & 2032
- Table 58: Nordics NA Red Meat Market Revenue (Million) Forecast, by Application 2019 & 2032
- Table 59: Rest of Europe NA Red Meat Market Revenue (Million) Forecast, by Application 2019 & 2032
- Table 60: Global NA Red Meat Market Revenue Million Forecast, by Type 2019 & 2032
- Table 61: Global NA Red Meat Market Revenue Million Forecast, by Form 2019 & 2032
- Table 62: Global NA Red Meat Market Revenue Million Forecast, by Distribution Channel 2019 & 2032
- Table 63: Global NA Red Meat Market Revenue Million Forecast, by Country 2019 & 2032
- Table 64: Turkey NA Red Meat Market Revenue (Million) Forecast, by Application 2019 & 2032
- Table 65: Israel NA Red Meat Market Revenue (Million) Forecast, by Application 2019 & 2032
- Table 66: GCC NA Red Meat Market Revenue (Million) Forecast, by Application 2019 & 2032
- Table 67: North Africa NA Red Meat Market Revenue (Million) Forecast, by Application 2019 & 2032
- Table 68: South Africa NA Red Meat Market Revenue (Million) Forecast, by Application 2019 & 2032
- Table 69: Rest of Middle East & Africa NA Red Meat Market Revenue (Million) Forecast, by Application 2019 & 2032
- Table 70: Global NA Red Meat Market Revenue Million Forecast, by Type 2019 & 2032
- Table 71: Global NA Red Meat Market Revenue Million Forecast, by Form 2019 & 2032
- Table 72: Global NA Red Meat Market Revenue Million Forecast, by Distribution Channel 2019 & 2032
- Table 73: Global NA Red Meat Market Revenue Million Forecast, by Country 2019 & 2032
- Table 74: China NA Red Meat Market Revenue (Million) Forecast, by Application 2019 & 2032
- Table 75: India NA Red Meat Market Revenue (Million) Forecast, by Application 2019 & 2032
- Table 76: Japan NA Red Meat Market Revenue (Million) Forecast, by Application 2019 & 2032
- Table 77: South Korea NA Red Meat Market Revenue (Million) Forecast, by Application 2019 & 2032
- Table 78: ASEAN NA Red Meat Market Revenue (Million) Forecast, by Application 2019 & 2032
- Table 79: Oceania NA Red Meat Market Revenue (Million) Forecast, by Application 2019 & 2032
- Table 80: Rest of Asia Pacific NA Red Meat Market Revenue (Million) Forecast, by Application 2019 & 2032
Frequently Asked Questions
1. What is the projected Compound Annual Growth Rate (CAGR) of the NA Red Meat Market?
The projected CAGR is approximately 6.42%.
2. Which companies are prominent players in the NA Red Meat Market?
Key companies in the market include WH Group Limite, NH Foods Ltd, Vion Group, Tyson Foods Inc, Perdue Farms Inc, Conagra Brands Inc, Sysco Corporation, The Kraft Heinz Company, Hormel Foods Corporation, Cargill Inc, Marfrig Global Foods S A, The Clemens Family Corporation, JBS SA, OSI Group.
3. What are the main segments of the NA Red Meat Market?
The market segments include Type, Form, Distribution Channel.
4. Can you provide details about the market size?
The market size is estimated to be USD XX Million as of 2022.
5. What are some drivers contributing to market growth?
Increasing Demand for Low-Fat and Low-Calorie Food; Increasing Product Innovation.
6. What are the notable trends driving market growth?
OTHER KEY INDUSTRY TRENDS COVERED IN THE REPORT.
7. Are there any restraints impacting market growth?
; Threat of New Entrants; Bargaining Power of Buyers/Consumers; Bargaining Power of Suppliers; Threat of Substitute Products; Degree Of Competition.
8. Can you provide examples of recent developments in the market?
April 2023: Swift Prepared Food, a subsidiary of JBS USA, launched Principe Foods, which produces high-quality Italian meats and charcuterie.December 2022: JBS has acquired “certain assets” from US-based pork supplier TriOak Foods, strengthening its control over the supply chain.November 2022: Conagra Brands, Inc. has announced plans to invest about USD 60 million to expand the Troy facility's production capacity in Ohio, United States. Slim Jim products are mainly manufactured in the facility. Conagra stated that the 389,000 square foot plant will gain around 15,000 square feet as part of the expansion.
9. What pricing options are available for accessing the report?
Pricing options include single-user, multi-user, and enterprise licenses priced at USD 3800, USD 4500, and USD 5800 respectively.
10. Is the market size provided in terms of value or volume?
The market size is provided in terms of value, measured in Million.
11. Are there any specific market keywords associated with the report?
Yes, the market keyword associated with the report is "NA Red Meat Market," which aids in identifying and referencing the specific market segment covered.
12. How do I determine which pricing option suits my needs best?
The pricing options vary based on user requirements and access needs. Individual users may opt for single-user licenses, while businesses requiring broader access may choose multi-user or enterprise licenses for cost-effective access to the report.
13. Are there any additional resources or data provided in the NA Red Meat Market report?
While the report offers comprehensive insights, it's advisable to review the specific contents or supplementary materials provided to ascertain if additional resources or data are available.
14. How can I stay updated on further developments or reports in the NA Red Meat Market?
To stay informed about further developments, trends, and reports in the NA Red Meat Market, consider subscribing to industry newsletters, following relevant companies and organizations, or regularly checking reputable industry news sources and publications.
Methodology
Step 1 - Identification of Relevant Samples Size from Population Database


Step 2 - Approaches for Defining Global Market Size (Value, Volume* & Price*)

Note*: In applicable scenarios
Step 3 - Data Sources
Primary Research
- Web Analytics
- Survey Reports
- Research Institute
- Latest Research Reports
- Opinion Leaders
Secondary Research
- Annual Reports
- White Paper
- Latest Press Release
- Industry Association
- Paid Database
- Investor Presentations

Step 4 - Data Triangulation
Involves using different sources of information in order to increase the validity of a study
These sources are likely to be stakeholders in a program - participants, other researchers, program staff, other community members, and so on.
Then we put all data in single framework & apply various statistical tools to find out the dynamic on the market.
During the analysis stage, feedback from the stakeholder groups would be compared to determine areas of agreement as well as areas of divergence


