

Key Insights
The naval gas turbine market, valued at 585.96 million in 2025, is projected to grow at a CAGR of 4.7% from 2025 to 2033. Key growth drivers include rising demand for advanced naval vessels due to geopolitical shifts and modernization, alongside the adoption of fuel-efficient and high-performance gas turbines. The market is segmented by application (Gas Turbine Generators, Main Gas Turbines) and vessel type (Naval Carriers, Destroyers, Frigates, Other Vessel Types). While large vessels are significant, smaller patrol boats and corvettes contribute to expansion. Major players like General Electric, Rolls Royce, and Mitsubishi Heavy Industries are investing in R&D for advanced turbines, fostering innovation.
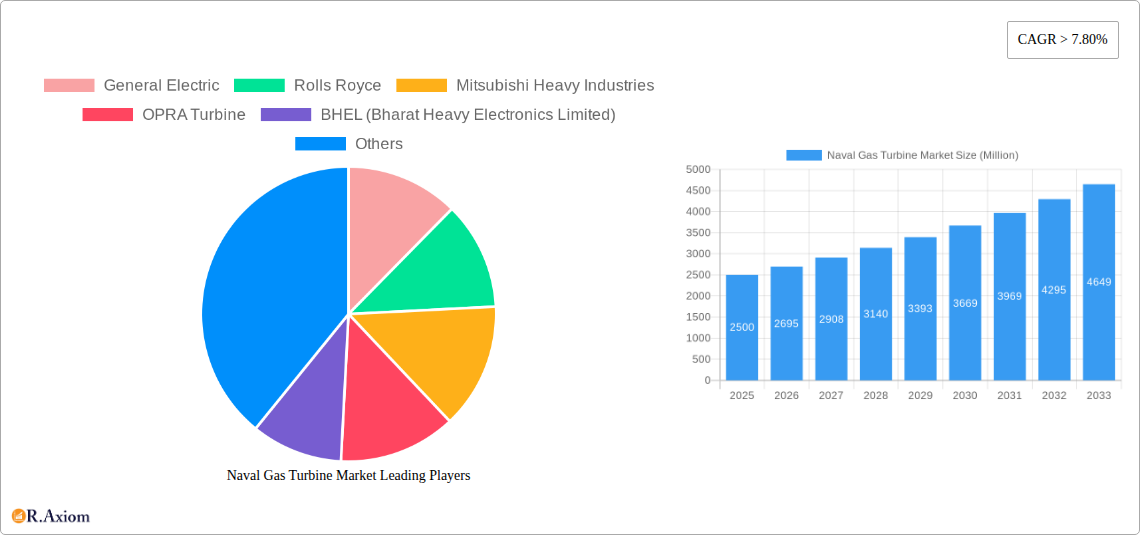
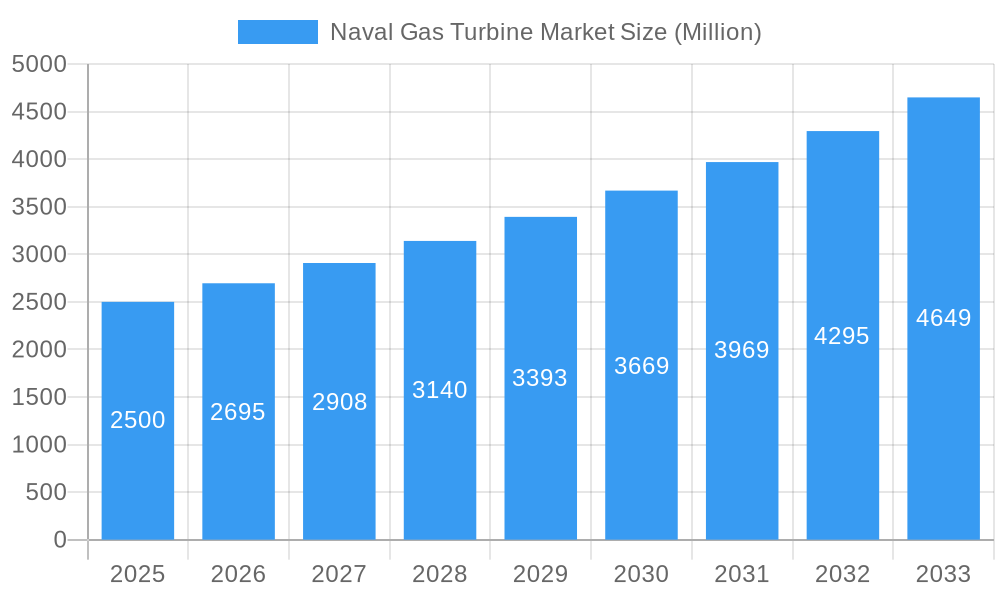
Naval Gas Turbine Market Market Size (In Million)
Geographically, North America, Europe, and Asia-Pacific are key regions. North America leads with substantial naval fleets and defense spending. Europe's modernization programs drive demand, while Asia-Pacific, fueled by expansion in India, China, and Japan, presents significant growth opportunities. Market dynamics are influenced by defense budget fluctuations and alternative propulsion technologies. While sustainable energy sources are a long-term consideration, gas turbines are expected to remain dominant in naval applications.
Naval Gas Turbine Market Company Market Share
Naval Gas Turbine Market: A Comprehensive Analysis (2019-2033)
This in-depth report provides a comprehensive analysis of the global Naval Gas Turbine Market, covering the period 2019-2033. It offers actionable insights for industry stakeholders, including manufacturers, investors, and government agencies. The report utilizes data from the historical period (2019-2024), the base year (2025), and the estimated year (2025) to project market trends through 2033. The report is meticulously structured to offer a clear understanding of market dynamics, competitive landscape, and future growth potential. Key segments analyzed include Gas Turbine Generators and Main Gas Turbines by vessel types: Naval Carriers, Destroyers, Frigates, and Other Vessel Types (Patrol Boats, Corvette, and Cruisers).
Naval Gas Turbine Market Concentration & Innovation
The Naval Gas Turbine market exhibits a moderately concentrated structure, with a few major players holding significant market share. General Electric, Rolls Royce, and Mitsubishi Heavy Industries are among the dominant players, collectively accounting for approximately xx% of the global market in 2025. However, smaller players like OPRA Turbine, BHEL, Solar Turbines, Vericor Power Systems, Siemens Energy, Kawasaki Heavy Industries Ltd, and IHI Power Systems Co Ltd are actively contributing to innovation and niche market penetration. Market concentration is influenced by factors such as technological advancements, regulatory approvals, and the significant capital investment required for R&D and manufacturing.
Innovation is a key driver in this market, fueled by the demand for improved fuel efficiency, reduced emissions, and enhanced power output. M&A activities have played a crucial role in shaping the competitive landscape. While precise deal values are not publicly available for all transactions, several significant acquisitions in the past five years have resulted in increased market consolidation. For example, xx M&A deals valued at approximately xx Million were recorded between 2020-2024, mostly focused on strengthening technological capabilities and expanding market reach. Stringent regulatory frameworks concerning emissions and safety standards further influence innovation, pushing companies to develop more environmentally friendly and robust gas turbines. Product substitution is limited due to the highly specialized nature of naval gas turbines, but ongoing research in alternative fuels and propulsion systems presents a potential long-term challenge. End-user trends indicate a growing demand for greater customization and integration of advanced technologies such as digital twins and predictive maintenance capabilities.
Naval Gas Turbine Market Industry Trends & Insights
The Naval Gas Turbine market is projected to experience a Compound Annual Growth Rate (CAGR) of xx% during the forecast period (2025-2033), driven by several key factors. Increasing defense budgets globally, particularly in regions experiencing geopolitical instability, are fueling demand for new naval vessels equipped with advanced gas turbines. Technological advancements, such as the development of more efficient and durable turbine blades, are leading to improved performance and reduced operational costs. Furthermore, the adoption of advanced materials and manufacturing processes is enhancing the reliability and lifespan of these systems. The market penetration of gas turbines in newer vessel designs remains high, exceeding xx% in 2025, indicating a strong reliance on this technology for naval propulsion. However, competitive dynamics are intensifying, with companies focusing on differentiation through technological superiority, superior after-sales support, and strategic partnerships to secure contracts with naval forces. Consumer preferences are heavily influenced by factors such as performance, reliability, fuel efficiency, and life-cycle costs.
Dominant Markets & Segments in Naval Gas Turbine Market
The Asia-Pacific region is currently the dominant market for naval gas turbines, driven by robust defense spending and a growing number of naval modernization projects in countries like China, India, and South Korea. Within the application segments, Main Gas Turbines hold a larger market share than Gas Turbine Generators, primarily due to their critical role in ship propulsion.
- Key Drivers for Asia-Pacific Dominance:
- Significant investments in naval expansion programs.
- Rising geopolitical tensions and regional security concerns.
- Government initiatives promoting indigenous defense manufacturing.
Among vessel types, Naval Carriers and Destroyers represent the most significant market segments, demanding high-power and sophisticated gas turbines. The demand for Frigates and other vessel types (Patrol Boats, Corvettes, and Cruisers) is also substantial and is expected to grow steadily during the forecast period. This is driven by the need for improved surveillance, coastal defense, and anti-piracy capabilities, which requires a larger fleet of smaller vessels.
Naval Gas Turbine Market Product Developments
Recent product developments focus on enhancing fuel efficiency, reducing emissions, and improving overall system reliability. Companies are investing in advanced materials, improved blade designs, and advanced control systems to optimize turbine performance. Integration of digital technologies for predictive maintenance and remote diagnostics is also gaining traction. These developments are crucial for addressing the increasing demand for more cost-effective and environmentally friendly naval propulsion systems. The market fit for these innovations is strong, as naval forces prioritize operational efficiency, reduced maintenance costs, and environmental compliance.
Report Scope & Segmentation Analysis
This report segments the Naval Gas Turbine market by Application (Gas Turbine Generators and Main Gas Turbines) and Vessel Type (Naval Carriers, Destroyers, Frigates, and Other Vessel Types). Each segment exhibits unique growth projections and competitive dynamics.
- Gas Turbine Generators: This segment is expected to witness steady growth, driven by the need for reliable power generation onboard naval vessels.
- Main Gas Turbines: This segment holds a larger market share, with growth driven by the increasing demand for high-power propulsion systems in larger naval vessels.
- Naval Carriers: This segment commands a significant share of the market due to the high power requirements of these large vessels.
- Destroyers & Frigates: These segments represent a substantial portion of the market, driven by the large number of these vessels in service worldwide.
- Other Vessel Types: This segment, comprising patrol boats, corvettes, and cruisers, is projected to witness robust growth owing to increasing naval modernization efforts across various nations.
Key Drivers of Naval Gas Turbine Market Growth
Several factors drive the growth of the Naval Gas Turbine market. Increased defense spending by several nations, particularly in regions experiencing geopolitical instability, fuels demand for advanced naval propulsion systems. Technological advancements, such as improved fuel efficiency and enhanced power output, also contribute significantly. Stringent environmental regulations necessitate the development of cleaner and more sustainable gas turbine technologies, pushing innovation and driving market growth. Furthermore, the increasing complexity of naval operations necessitates the deployment of highly reliable and sophisticated gas turbine systems.
Challenges in the Naval Gas Turbine Market Sector
The Naval Gas Turbine market faces several challenges. Stringent environmental regulations, such as emission standards, impose constraints on manufacturers. Supply chain disruptions and rising raw material costs impact production costs and profitability. Intense competition among established players and the emergence of new entrants create a challenging market environment. The high cost of R&D and the lengthy lead times involved in developing new gas turbine technologies represent significant hurdles for smaller players. The overall effect of these challenges limits market expansion and increases cost pressures for industry participants.
Emerging Opportunities in Naval Gas Turbine Market
Several emerging opportunities exist within the Naval Gas Turbine market. The development of alternative fuels, such as biofuels and hydrogen, offers the potential to create more environmentally friendly propulsion systems. The integration of advanced technologies, such as AI and machine learning, for predictive maintenance and autonomous operation, presents growth prospects. Expanding into emerging markets with growing naval modernization programs presents significant opportunities. Lastly, exploring hybrid propulsion systems combining gas turbines with electric motors could revolutionize naval propulsion technology.
Leading Players in the Naval Gas Turbine Market
- General Electric
- Rolls Royce
- Mitsubishi Heavy Industries
- OPRA Turbine
- BHEL (Bharat Heavy Electronics Limited)
- Solar Turbines
- Vericor Power Systems
- Siemens Energy
- Kawasaki Heavy Industries Ltd
- IHI Power Systems Co Ltd
Key Developments in Naval Gas Turbine Market Industry
- 2022 July: General Electric launched a new generation of naval gas turbine with improved fuel efficiency.
- 2023 January: Rolls Royce secured a major contract for the supply of gas turbines to a Southeast Asian navy.
- 2024 March: Mitsubishi Heavy Industries announced a strategic partnership for the joint development of a next-generation gas turbine technology.
- 2025 May: Siemens Energy acquired a smaller gas turbine manufacturer, expanding its portfolio. (Further developments will be added during the update.)
Strategic Outlook for Naval Gas Turbine Market
The Naval Gas Turbine market is poised for continued growth, driven by sustained defense spending and ongoing technological advancements. The focus on enhancing fuel efficiency, reducing emissions, and integrating advanced technologies will shape the market's future. Opportunities in emerging markets and the development of innovative propulsion solutions will drive competition and market expansion over the next decade. Companies strategically positioned to capitalize on these trends are expected to experience significant growth and market leadership.
Naval Gas Turbine Market Segmentation
-
1. Vessel Type
- 1.1. Naval Carriers
- 1.2. Destroyers
- 1.3. Frigates
- 1.4. Other Ve
-
2. Application
- 2.1. Gas Turbine Generators
- 2.2. Main Gas Turbines
Naval Gas Turbine Market Segmentation By Geography
-
1. North America
- 1.1. United States
- 1.2. Canada
-
2. Europe
- 2.1. Germany
- 2.2. United Kingdom
- 2.3. France
- 2.4. Russia
- 2.5. Rest of Europe
-
3. Asia Pacific
- 3.1. India
- 3.2. China
- 3.3. Japan
- 3.4. Rest of Asia Pacific
-
4. Latin America
- 4.1. Brazil
- 4.2. Rest of Latin America
-
5. Middle East and Africa
- 5.1. United Arab Emirates
- 5.2. Saudi Arabia
- 5.3. Rest of Middle East and Africa
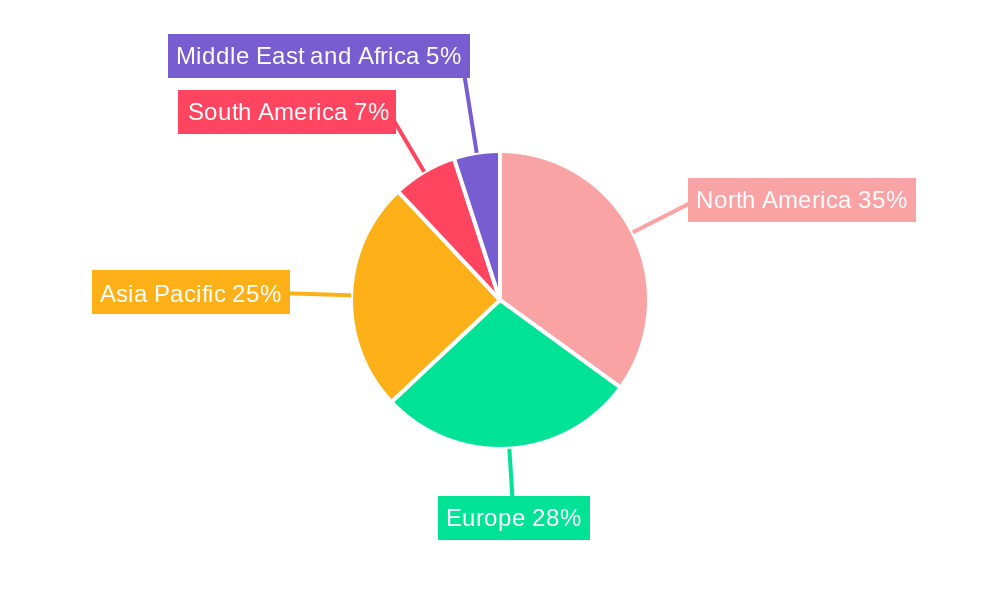
Naval Gas Turbine Market Regional Market Share
Geographic Coverage of Naval Gas Turbine Market
Naval Gas Turbine Market REPORT HIGHLIGHTS
| Aspects | Details |
|---|---|
| Study Period | 2020-2034 |
| Base Year | 2025 |
| Estimated Year | 2026 |
| Forecast Period | 2026-2034 |
| Historical Period | 2020-2025 |
| Growth Rate | CAGR of 4.7% from 2020-2034 |
| Segmentation |
|
Table of Contents
- 1. Introduction
- 1.1. Research Scope
- 1.2. Market Segmentation
- 1.3. Research Objective
- 1.4. Definitions and Assumptions
- 2. Executive Summary
- 2.1. Market Snapshot
- 3. Market Dynamics
- 3.1. Market Drivers
- 3.2. Market Restrains
- 3.3. Market Trends
- 3.4. Market Opportunities
- 4. Market Factor Analysis
- 4.1. Porters Five Forces
- 4.1.1. Bargaining Power of Suppliers
- 4.1.2. Bargaining Power of Buyers
- 4.1.3. Threat of New Entrants
- 4.1.4. Threat of Substitutes
- 4.1.5. Competitive Rivalry
- 4.2. PESTEL analysis
- 4.3. BCG Analysis
- 4.3.1. Stars (High Growth, High Market Share)
- 4.3.2. Cash Cows (Low Growth, High Market Share)
- 4.3.3. Question Mark (High Growth, Low Market Share)
- 4.3.4. Dogs (Low Growth, Low Market Share)
- 4.4. Ansoff Matrix Analysis
- 4.5. Supply Chain Analysis
- 4.6. Regulatory Landscape
- 4.7. Current Market Potential and Opportunity Assessment (TAM–SAM–SOM Framework)
- 4.8. RAX Analyst Note
- 4.1. Porters Five Forces
- 5. Market Analysis, Insights and Forecast 2021-2033
- 5.1. Market Analysis, Insights and Forecast - by Vessel Type
- 5.1.1. Naval Carriers
- 5.1.2. Destroyers
- 5.1.3. Frigates
- 5.1.4. Other Ve
- 5.2. Market Analysis, Insights and Forecast - by Application
- 5.2.1. Gas Turbine Generators
- 5.2.2. Main Gas Turbines
- 5.3. Market Analysis, Insights and Forecast - by Region
- 5.3.1. North America
- 5.3.2. Europe
- 5.3.3. Asia Pacific
- 5.3.4. Latin America
- 5.3.5. Middle East and Africa
- 5.1. Market Analysis, Insights and Forecast - by Vessel Type
- 6. Global Naval Gas Turbine Market Analysis, Insights and Forecast, 2021-2033
- 6.1. Market Analysis, Insights and Forecast - by Vessel Type
- 6.1.1. Naval Carriers
- 6.1.2. Destroyers
- 6.1.3. Frigates
- 6.1.4. Other Ve
- 6.2. Market Analysis, Insights and Forecast - by Application
- 6.2.1. Gas Turbine Generators
- 6.2.2. Main Gas Turbines
- 6.1. Market Analysis, Insights and Forecast - by Vessel Type
- 7. North America Naval Gas Turbine Market Analysis, Insights and Forecast, 2020-2032
- 7.1. Market Analysis, Insights and Forecast - by Vessel Type
- 7.1.1. Naval Carriers
- 7.1.2. Destroyers
- 7.1.3. Frigates
- 7.1.4. Other Ve
- 7.2. Market Analysis, Insights and Forecast - by Application
- 7.2.1. Gas Turbine Generators
- 7.2.2. Main Gas Turbines
- 7.1. Market Analysis, Insights and Forecast - by Vessel Type
- 8. Europe Naval Gas Turbine Market Analysis, Insights and Forecast, 2020-2032
- 8.1. Market Analysis, Insights and Forecast - by Vessel Type
- 8.1.1. Naval Carriers
- 8.1.2. Destroyers
- 8.1.3. Frigates
- 8.1.4. Other Ve
- 8.2. Market Analysis, Insights and Forecast - by Application
- 8.2.1. Gas Turbine Generators
- 8.2.2. Main Gas Turbines
- 8.1. Market Analysis, Insights and Forecast - by Vessel Type
- 9. Asia Pacific Naval Gas Turbine Market Analysis, Insights and Forecast, 2020-2032
- 9.1. Market Analysis, Insights and Forecast - by Vessel Type
- 9.1.1. Naval Carriers
- 9.1.2. Destroyers
- 9.1.3. Frigates
- 9.1.4. Other Ve
- 9.2. Market Analysis, Insights and Forecast - by Application
- 9.2.1. Gas Turbine Generators
- 9.2.2. Main Gas Turbines
- 9.1. Market Analysis, Insights and Forecast - by Vessel Type
- 10. Latin America Naval Gas Turbine Market Analysis, Insights and Forecast, 2020-2032
- 10.1. Market Analysis, Insights and Forecast - by Vessel Type
- 10.1.1. Naval Carriers
- 10.1.2. Destroyers
- 10.1.3. Frigates
- 10.1.4. Other Ve
- 10.2. Market Analysis, Insights and Forecast - by Application
- 10.2.1. Gas Turbine Generators
- 10.2.2. Main Gas Turbines
- 10.1. Market Analysis, Insights and Forecast - by Vessel Type
- 11. Middle East and Africa Naval Gas Turbine Market Analysis, Insights and Forecast, 2020-2032
- 11.1. Market Analysis, Insights and Forecast - by Vessel Type
- 11.1.1. Naval Carriers
- 11.1.2. Destroyers
- 11.1.3. Frigates
- 11.1.4. Other Ve
- 11.2. Market Analysis, Insights and Forecast - by Application
- 11.2.1. Gas Turbine Generators
- 11.2.2. Main Gas Turbines
- 11.1. Market Analysis, Insights and Forecast - by Vessel Type
- 12. Competitive Analysis
- 12.1. Company Profiles
- 12.1.1 General Electric
- 12.1.1.1. Company Overview
- 12.1.1.2. Products
- 12.1.1.3. Company Financials
- 12.1.1.4. SWOT Analysis
- 12.1.2 Rolls Royce
- 12.1.2.1. Company Overview
- 12.1.2.2. Products
- 12.1.2.3. Company Financials
- 12.1.2.4. SWOT Analysis
- 12.1.3 Mitsubishi Heavy Industries
- 12.1.3.1. Company Overview
- 12.1.3.2. Products
- 12.1.3.3. Company Financials
- 12.1.3.4. SWOT Analysis
- 12.1.4 OPRA Turbine
- 12.1.4.1. Company Overview
- 12.1.4.2. Products
- 12.1.4.3. Company Financials
- 12.1.4.4. SWOT Analysis
- 12.1.5 BHEL (Bharat Heavy Electronics Limited)
- 12.1.5.1. Company Overview
- 12.1.5.2. Products
- 12.1.5.3. Company Financials
- 12.1.5.4. SWOT Analysis
- 12.1.6 Solar Turbines
- 12.1.6.1. Company Overview
- 12.1.6.2. Products
- 12.1.6.3. Company Financials
- 12.1.6.4. SWOT Analysis
- 12.1.7 Vericor Power Systems*List Not Exhaustive
- 12.1.7.1. Company Overview
- 12.1.7.2. Products
- 12.1.7.3. Company Financials
- 12.1.7.4. SWOT Analysis
- 12.1.8 Siemens Energy
- 12.1.8.1. Company Overview
- 12.1.8.2. Products
- 12.1.8.3. Company Financials
- 12.1.8.4. SWOT Analysis
- 12.1.9 Kawasaki Heavy Industries Ltd
- 12.1.9.1. Company Overview
- 12.1.9.2. Products
- 12.1.9.3. Company Financials
- 12.1.9.4. SWOT Analysis
- 12.1.10 IHI Power Systems Co Ltd
- 12.1.10.1. Company Overview
- 12.1.10.2. Products
- 12.1.10.3. Company Financials
- 12.1.10.4. SWOT Analysis
- 12.1.1 General Electric
- 12.2. Market Entropy
- 12.2.1 Company's Key Areas Served
- 12.2.2 Recent Developments
- 12.3. Company Market Share Analysis 2025
- 12.3.1 Top 5 Companies Market Share Analysis
- 12.3.2 Top 3 Companies Market Share Analysis
- 12.4. List of Potential Customers
- 13. Research Methodology
List of Figures
- Figure 1: Global Naval Gas Turbine Market Revenue Breakdown (million, %) by Region 2025 & 2033
- Figure 2: North America Naval Gas Turbine Market Revenue (million), by Vessel Type 2025 & 2033
- Figure 3: North America Naval Gas Turbine Market Revenue Share (%), by Vessel Type 2025 & 2033
- Figure 4: North America Naval Gas Turbine Market Revenue (million), by Application 2025 & 2033
- Figure 5: North America Naval Gas Turbine Market Revenue Share (%), by Application 2025 & 2033
- Figure 6: North America Naval Gas Turbine Market Revenue (million), by Country 2025 & 2033
- Figure 7: North America Naval Gas Turbine Market Revenue Share (%), by Country 2025 & 2033
- Figure 8: Europe Naval Gas Turbine Market Revenue (million), by Vessel Type 2025 & 2033
- Figure 9: Europe Naval Gas Turbine Market Revenue Share (%), by Vessel Type 2025 & 2033
- Figure 10: Europe Naval Gas Turbine Market Revenue (million), by Application 2025 & 2033
- Figure 11: Europe Naval Gas Turbine Market Revenue Share (%), by Application 2025 & 2033
- Figure 12: Europe Naval Gas Turbine Market Revenue (million), by Country 2025 & 2033
- Figure 13: Europe Naval Gas Turbine Market Revenue Share (%), by Country 2025 & 2033
- Figure 14: Asia Pacific Naval Gas Turbine Market Revenue (million), by Vessel Type 2025 & 2033
- Figure 15: Asia Pacific Naval Gas Turbine Market Revenue Share (%), by Vessel Type 2025 & 2033
- Figure 16: Asia Pacific Naval Gas Turbine Market Revenue (million), by Application 2025 & 2033
- Figure 17: Asia Pacific Naval Gas Turbine Market Revenue Share (%), by Application 2025 & 2033
- Figure 18: Asia Pacific Naval Gas Turbine Market Revenue (million), by Country 2025 & 2033
- Figure 19: Asia Pacific Naval Gas Turbine Market Revenue Share (%), by Country 2025 & 2033
- Figure 20: Latin America Naval Gas Turbine Market Revenue (million), by Vessel Type 2025 & 2033
- Figure 21: Latin America Naval Gas Turbine Market Revenue Share (%), by Vessel Type 2025 & 2033
- Figure 22: Latin America Naval Gas Turbine Market Revenue (million), by Application 2025 & 2033
- Figure 23: Latin America Naval Gas Turbine Market Revenue Share (%), by Application 2025 & 2033
- Figure 24: Latin America Naval Gas Turbine Market Revenue (million), by Country 2025 & 2033
- Figure 25: Latin America Naval Gas Turbine Market Revenue Share (%), by Country 2025 & 2033
- Figure 26: Middle East and Africa Naval Gas Turbine Market Revenue (million), by Vessel Type 2025 & 2033
- Figure 27: Middle East and Africa Naval Gas Turbine Market Revenue Share (%), by Vessel Type 2025 & 2033
- Figure 28: Middle East and Africa Naval Gas Turbine Market Revenue (million), by Application 2025 & 2033
- Figure 29: Middle East and Africa Naval Gas Turbine Market Revenue Share (%), by Application 2025 & 2033
- Figure 30: Middle East and Africa Naval Gas Turbine Market Revenue (million), by Country 2025 & 2033
- Figure 31: Middle East and Africa Naval Gas Turbine Market Revenue Share (%), by Country 2025 & 2033
List of Tables
- Table 1: Global Naval Gas Turbine Market Revenue million Forecast, by Vessel Type 2020 & 2033
- Table 2: Global Naval Gas Turbine Market Revenue million Forecast, by Application 2020 & 2033
- Table 3: Global Naval Gas Turbine Market Revenue million Forecast, by Region 2020 & 2033
- Table 4: Global Naval Gas Turbine Market Revenue million Forecast, by Vessel Type 2020 & 2033
- Table 5: Global Naval Gas Turbine Market Revenue million Forecast, by Application 2020 & 2033
- Table 6: Global Naval Gas Turbine Market Revenue million Forecast, by Country 2020 & 2033
- Table 7: United States Naval Gas Turbine Market Revenue (million) Forecast, by Application 2020 & 2033
- Table 8: Canada Naval Gas Turbine Market Revenue (million) Forecast, by Application 2020 & 2033
- Table 9: Global Naval Gas Turbine Market Revenue million Forecast, by Vessel Type 2020 & 2033
- Table 10: Global Naval Gas Turbine Market Revenue million Forecast, by Application 2020 & 2033
- Table 11: Global Naval Gas Turbine Market Revenue million Forecast, by Country 2020 & 2033
- Table 12: Germany Naval Gas Turbine Market Revenue (million) Forecast, by Application 2020 & 2033
- Table 13: United Kingdom Naval Gas Turbine Market Revenue (million) Forecast, by Application 2020 & 2033
- Table 14: France Naval Gas Turbine Market Revenue (million) Forecast, by Application 2020 & 2033
- Table 15: Russia Naval Gas Turbine Market Revenue (million) Forecast, by Application 2020 & 2033
- Table 16: Rest of Europe Naval Gas Turbine Market Revenue (million) Forecast, by Application 2020 & 2033
- Table 17: Global Naval Gas Turbine Market Revenue million Forecast, by Vessel Type 2020 & 2033
- Table 18: Global Naval Gas Turbine Market Revenue million Forecast, by Application 2020 & 2033
- Table 19: Global Naval Gas Turbine Market Revenue million Forecast, by Country 2020 & 2033
- Table 20: India Naval Gas Turbine Market Revenue (million) Forecast, by Application 2020 & 2033
- Table 21: China Naval Gas Turbine Market Revenue (million) Forecast, by Application 2020 & 2033
- Table 22: Japan Naval Gas Turbine Market Revenue (million) Forecast, by Application 2020 & 2033
- Table 23: Rest of Asia Pacific Naval Gas Turbine Market Revenue (million) Forecast, by Application 2020 & 2033
- Table 24: Global Naval Gas Turbine Market Revenue million Forecast, by Vessel Type 2020 & 2033
- Table 25: Global Naval Gas Turbine Market Revenue million Forecast, by Application 2020 & 2033
- Table 26: Global Naval Gas Turbine Market Revenue million Forecast, by Country 2020 & 2033
- Table 27: Brazil Naval Gas Turbine Market Revenue (million) Forecast, by Application 2020 & 2033
- Table 28: Rest of Latin America Naval Gas Turbine Market Revenue (million) Forecast, by Application 2020 & 2033
- Table 29: Global Naval Gas Turbine Market Revenue million Forecast, by Vessel Type 2020 & 2033
- Table 30: Global Naval Gas Turbine Market Revenue million Forecast, by Application 2020 & 2033
- Table 31: Global Naval Gas Turbine Market Revenue million Forecast, by Country 2020 & 2033
- Table 32: United Arab Emirates Naval Gas Turbine Market Revenue (million) Forecast, by Application 2020 & 2033
- Table 33: Saudi Arabia Naval Gas Turbine Market Revenue (million) Forecast, by Application 2020 & 2033
- Table 34: Rest of Middle East and Africa Naval Gas Turbine Market Revenue (million) Forecast, by Application 2020 & 2033
Frequently Asked Questions
1. What is the projected Compound Annual Growth Rate (CAGR) of the Naval Gas Turbine Market?
The projected CAGR is approximately 4.7%.
2. Which companies are prominent players in the Naval Gas Turbine Market?
Key companies in the market include General Electric, Rolls Royce, Mitsubishi Heavy Industries, OPRA Turbine, BHEL (Bharat Heavy Electronics Limited), Solar Turbines, Vericor Power Systems*List Not Exhaustive, Siemens Energy, Kawasaki Heavy Industries Ltd, IHI Power Systems Co Ltd.
3. What are the main segments of the Naval Gas Turbine Market?
The market segments include Vessel Type, Application.
4. Can you provide details about the market size?
The market size is estimated to be USD 585.96 million as of 2022.
5. What are some drivers contributing to market growth?
N/A
6. What are the notable trends driving market growth?
Destroyers Is Expected To Witness Significant Growth During The Forecast Period.
7. Are there any restraints impacting market growth?
N/A
8. Can you provide examples of recent developments in the market?
N/A
9. What pricing options are available for accessing the report?
Pricing options include single-user, multi-user, and enterprise licenses priced at USD 4750, USD 5250, and USD 8750 respectively.
10. Is the market size provided in terms of value or volume?
The market size is provided in terms of value, measured in million.
11. Are there any specific market keywords associated with the report?
Yes, the market keyword associated with the report is "Naval Gas Turbine Market," which aids in identifying and referencing the specific market segment covered.
12. How do I determine which pricing option suits my needs best?
The pricing options vary based on user requirements and access needs. Individual users may opt for single-user licenses, while businesses requiring broader access may choose multi-user or enterprise licenses for cost-effective access to the report.
13. Are there any additional resources or data provided in the Naval Gas Turbine Market report?
While the report offers comprehensive insights, it's advisable to review the specific contents or supplementary materials provided to ascertain if additional resources or data are available.
14. How can I stay updated on further developments or reports in the Naval Gas Turbine Market?
To stay informed about further developments, trends, and reports in the Naval Gas Turbine Market, consider subscribing to industry newsletters, following relevant companies and organizations, or regularly checking reputable industry news sources and publications.
Methodology
Step 1 - Identification of Relevant Samples Size from Population Database


Step 2 - Approaches for Defining Global Market Size (Value, Volume* & Price*)

Note*: In applicable scenarios
Step 3 - Data Sources
Primary Research
- Web Analytics
- Survey Reports
- Research Institute
- Latest Research Reports
- Opinion Leaders
Secondary Research
- Annual Reports
- White Paper
- Latest Press Release
- Industry Association
- Paid Database
- Investor Presentations

Step 4 - Data Triangulation
Involves using different sources of information in order to increase the validity of a study
These sources are likely to be stakeholders in a program - participants, other researchers, program staff, other community members, and so on.
Then we put all data in single framework & apply various statistical tools to find out the dynamic on the market.
During the analysis stage, feedback from the stakeholder groups would be compared to determine areas of agreement as well as areas of divergence