


Key Insights into the Nebulizer Devices Market
The global Nebulizer Devices Market is experiencing robust expansion, driven by the escalating prevalence of chronic respiratory diseases and a paradigm shift towards home-based patient care. Valued at an estimated $1.3 billion in 2025, the market is poised for significant growth, projected to achieve a Compound Annual Growth Rate (CAGR) of 9.8% through 2035. This trajectory is expected to propel the market valuation beyond $3.3 billion by the end of the forecast period. The increasing global burden of conditions such as asthma, Chronic Obstructive Pulmonary Disease (COPD), and cystic fibrosis remains a primary demand driver. Furthermore, an aging global demographic, which is particularly susceptible to respiratory ailments, contributes substantially to the demand for efficient and accessible nebulization therapies. Technological advancements, especially in mesh nebulizer technology, have revolutionized device portability, efficiency, and drug delivery efficacy, making them more appealing for both clinical and personal use.
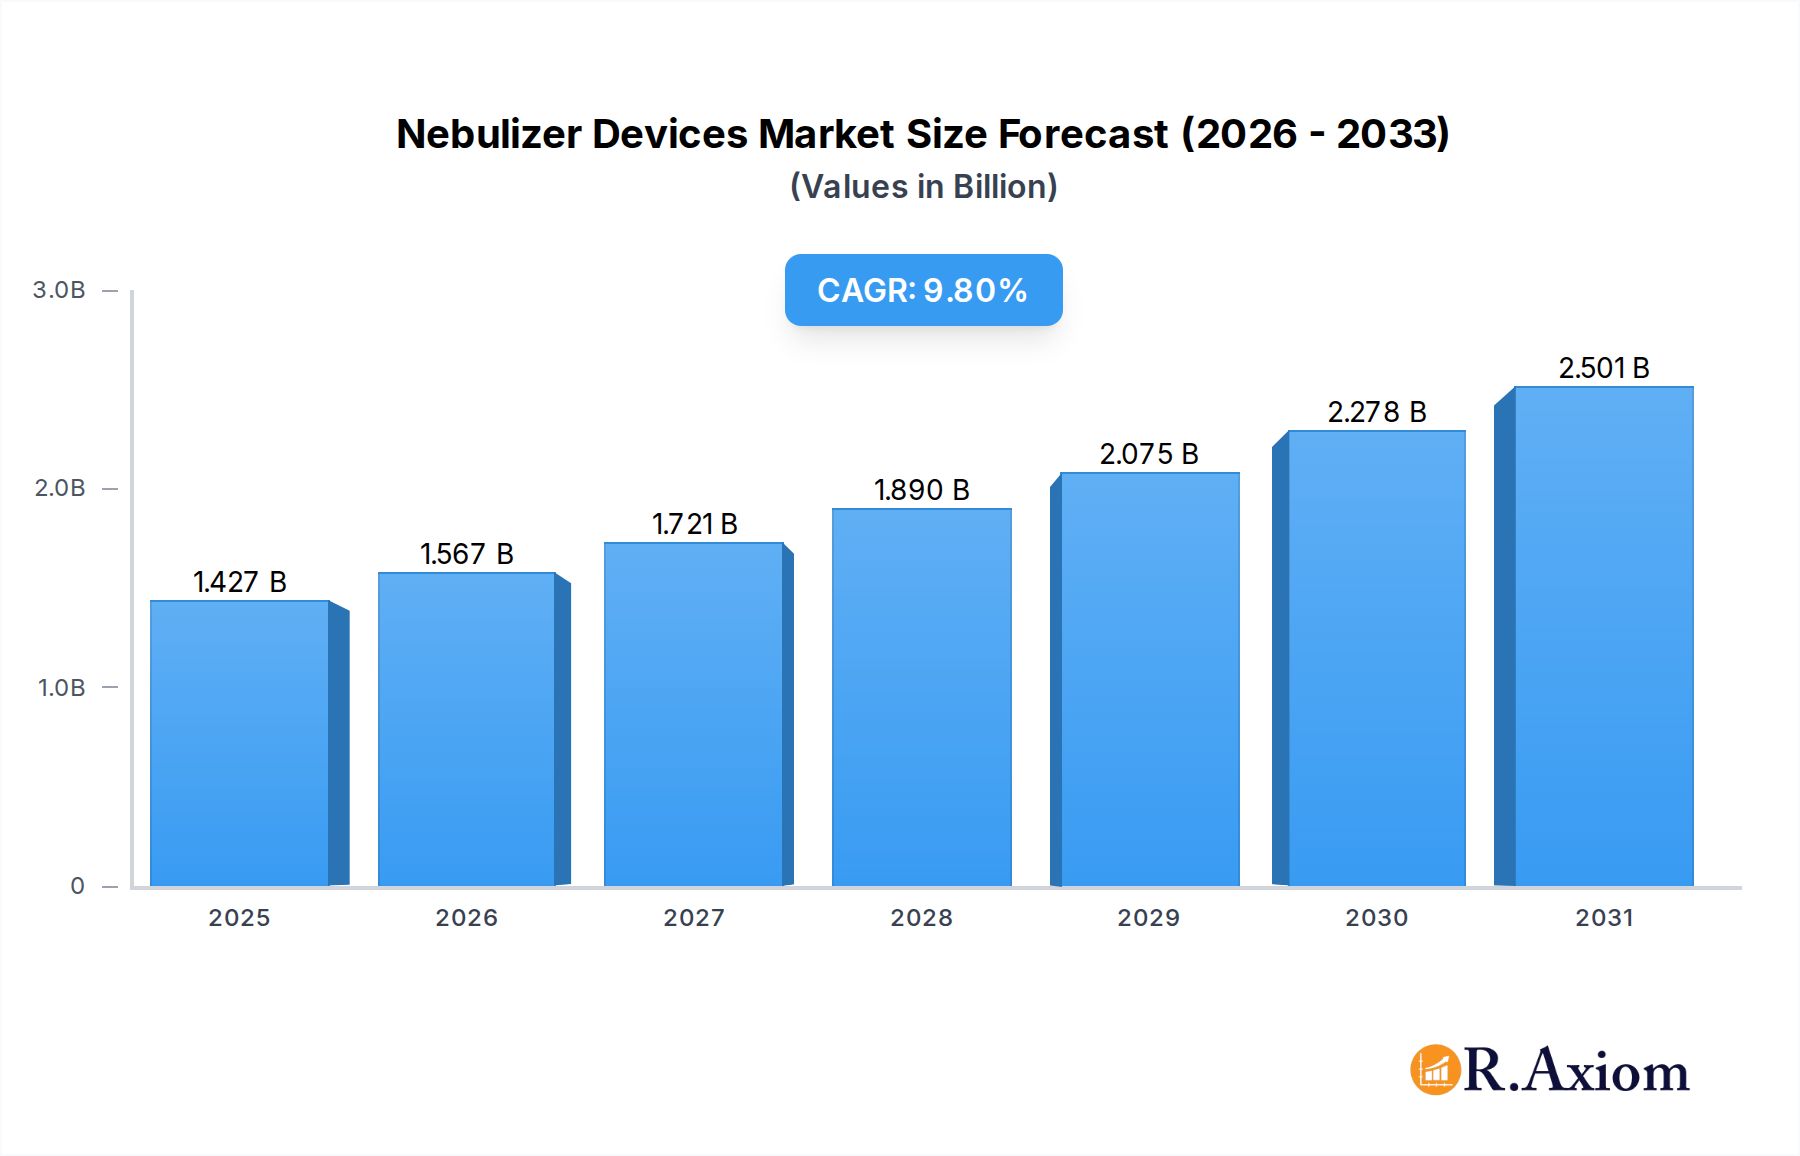
Nebulizer Devices Market Size (In Billion)

The shift towards the Home Healthcare Devices Market is a critical tailwind, with patients and healthcare providers increasingly favoring cost-effective and convenient at-home treatment options. This trend is amplified by the growing awareness of nebulizers as a safe and effective means of administering medication directly to the respiratory tract. Innovations in battery life, reduced noise levels, and user-friendly interfaces are further enhancing patient adherence and overall market penetration. The integration of smart features and potential for Medical Device Connectivity Market solutions are emerging trends that promise to improve patient monitoring and treatment adherence, especially for chronic conditions. Regulatory support for new and advanced devices, coupled with improving healthcare infrastructure in developing economies, is also fostering a conducive environment for market growth. While challenges such as high device cost and patient compliance with cleaning protocols persist, the overarching demand for effective respiratory therapy positions the Nebulizer Devices Market for sustained, strong growth over the coming decade, with a clear emphasis on innovation and accessibility.
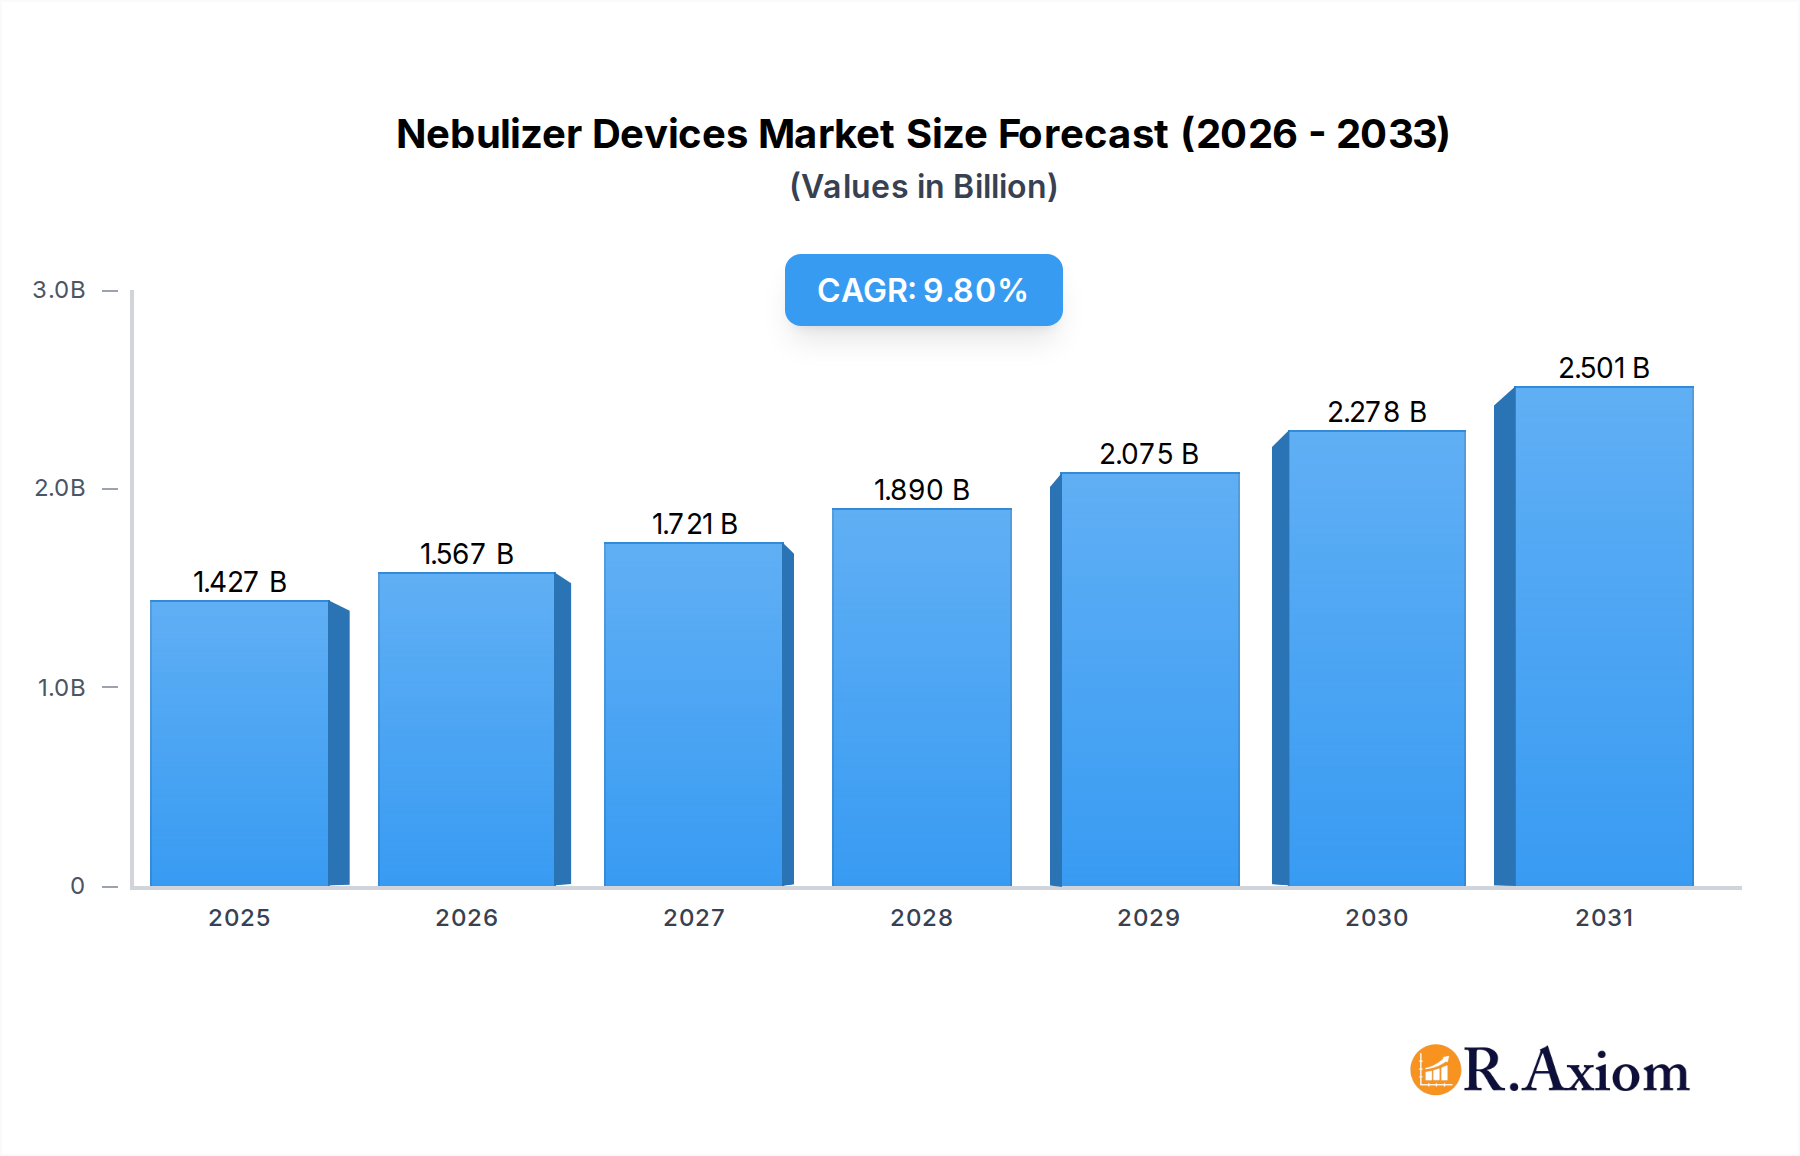
Nebulizer Devices Company Market Share
The Home Healthcare Segment Dominance in the Nebulizer Devices Market
The End-User segment for Home Healthcare currently represents the single largest revenue share within the global Nebulizer Devices Market, demonstrating a pervasive and growing influence. This dominance is fundamentally rooted in several intertwined socioeconomic and clinical trends. Firstly, the rising global prevalence of chronic respiratory diseases, including COPD, asthma, and cystic fibrosis, necessitates long-term medication management. Administering these therapies in a home setting offers significant advantages in terms of patient convenience, reduced healthcare costs associated with hospital visits, and improved quality of life. The average patient requiring nebulized therapy often prefers the comfort and familiarity of their own environment, driving the demand for user-friendly, reliable devices suitable for unsupervised operation.
Secondly, technological advancements have played a pivotal role in empowering the Home Healthcare Devices Market. Modern nebulizers, particularly advanced mesh and portable jet variants, are significantly smaller, quieter, and more efficient than their predecessors. Improved battery life, faster treatment times, and simplified cleaning procedures have made these devices highly appealing for daily use outside of clinical environments. This evolution aligns perfectly with the broader trend of decentralizing healthcare delivery, alleviating the burden on hospital systems, and promoting self-management of chronic conditions. The cost-effectiveness of home nebulization compared to frequent hospital visits or clinic-based treatments further reinforces its position as the preferred option for both patients and payors. The growing aging population globally, which disproportionately suffers from respiratory ailments, also contributes substantially to the expansion of this segment, as older adults often require continuous, accessible care solutions.
Key players in the Nebulizer Devices Market, such as OMRON Healthcare, Inc. and PARI GmbH, have strategically focused on developing and marketing devices specifically tailored for home use, emphasizing portability, ease of use, and durability. This strategic alignment ensures a steady supply of innovative products that cater directly to the needs of the Home Healthcare Devices Market. While hospitals and clinics remain vital points of initial diagnosis and severe case management, the long-term, routine application of nebulizer therapy is increasingly migrating to the home. This segment's share is not only dominant but also continues to exhibit robust growth, driven by patient preference, technological progress, and economic imperatives, indicating a consolidation of its leading position within the overall Nebulizer Devices Market.
Key Market Drivers and Constraints in the Nebulizer Devices Market
The Nebulizer Devices Market is significantly shaped by a confluence of drivers and constraints, each with measurable impacts:
Driver: Increasing Prevalence of Respiratory Diseases. The global incidence of chronic respiratory diseases, such as COPD and asthma, continues to rise. For instance, the World Health Organization estimates that COPD affects hundreds of millions globally, and asthma impacts over 300 million people, with these figures projected to increase due to factors like air pollution and smoking. This escalating disease burden directly translates into a higher demand for efficient Drug Delivery Devices Market solutions, including nebulizers, to manage symptoms and administer medication effectively.
Driver: Growing Geriatric Population. The global population aged 65 and above is expanding rapidly. This demographic segment is particularly susceptible to chronic respiratory conditions and often requires long-term, accessible respiratory care. The demographic shift ensures a continually expanding patient base for nebulizer devices, fostering growth especially within the Home Healthcare Devices Market, as older adults often prioritize ease of use and at-home treatment options.
Driver: Technological Advancements in Nebulizer Devices. Continuous innovation, particularly in Mesh Nebulizer Market technology, is a critical growth driver. These advancements have led to the development of more portable, quieter, and highly efficient devices with faster drug delivery times and reduced residual volume. For example, newer Mesh Nebulizers consume less medication and allow for discreet use, enhancing patient adherence and satisfaction, thereby increasing adoption rates across the Portable Medical Devices Market.
Constraint: High Cost of Advanced Devices. While technological advancements are a driver, the relatively higher cost associated with advanced mesh and portable nebulizers compared to traditional jet nebulizers can be a significant barrier to adoption, particularly in lower-income regions or for patients without adequate insurance coverage. This cost can limit market penetration and access for a substantial portion of the global population, slowing overall market expansion in certain segments.
Constraint: Lack of Awareness and Adherence Issues. In many developing regions, there remains a significant lack of awareness regarding the benefits and proper use of nebulizer devices. Moreover, issues related to patient adherence to regular cleaning and maintenance protocols can lead to device malfunction or ineffective therapy. This educational gap and compliance challenge can hinder sustained market growth, as the full therapeutic potential of these devices is not realized.
Competitive Ecosystem of the Nebulizer Devices Market
The global Nebulizer Devices Market is characterized by a competitive landscape featuring established multinational corporations and specialized manufacturers, all vying for market share through product innovation, distribution networks, and strategic partnerships. The competitive intensity drives continuous improvement in device efficiency, portability, and user-friendliness.
- OMRON Healthcare, Inc.: A prominent global leader in medical equipment, OMRON Healthcare is renowned for its wide range of consumer-friendly nebulizers, focusing on ease of use and reliability for home healthcare applications, particularly in the Respiratory Care Devices Market. Their strategy often involves accessible technology for a broad patient base.
- PARI GmbH: Headquartered in Germany, PARI is a specialized manufacturer known for high-quality, high-performance nebulizer systems, often favored in clinical settings and for specific respiratory conditions due to their superior drug delivery efficiency. They emphasize research and development for therapeutic efficacy.
- Drive Devilbiss International: This company offers a comprehensive portfolio of respiratory care products, including nebulizers, humidifiers, and oxygen concentrators. Their strategy focuses on providing robust and affordable solutions across various care settings, from hospitals to home care.
- Aerogen Ltd.: An Irish medical device company, Aerogen specializes in vibrating Mesh Nebulizer Market technology, providing hospital-grade aerosol drug delivery systems. Their focus is on critical care and acute respiratory treatment, offering highly efficient and precise delivery.
- BD: A global medical technology company, BD participates in the nebulizer market through its broader respiratory solutions, leveraging its extensive hospital network and sterile drug delivery expertise. Their offerings often integrate into broader hospital systems.
- Medline: As a leading healthcare manufacturer and distributor, Medline offers a variety of medical supplies, including nebulizers. Their strategy revolves around providing cost-effective and comprehensive solutions to healthcare facilities and home care providers.
- GE HealthCare: A major player in medical technology, GE HealthCare provides a range of respiratory care equipment, including nebulizer systems, primarily for hospital and clinical use, often integrated into larger monitoring and life support systems.
- Medtronic: While widely known for various medical devices, Medtronic offers respiratory solutions including nebulizers as part of its broader patient care portfolio, targeting both hospital and home care segments with a focus on patient outcomes.
- Beurer GmbH: A German manufacturer of health and well-being products, Beurer offers consumer-oriented nebulizers, emphasizing user comfort, compact design, and ease of maintenance for individual home use.
- Rossmax International Ltd.: This company provides a diverse range of healthcare products, including nebulizers, focusing on accessibility and reliability for global markets. They often aim for a balance of features and affordability.
Recent Developments & Milestones in the Nebulizer Devices Market
The Nebulizer Devices Market continues to evolve with ongoing innovations and strategic activities aimed at improving patient care and expanding market reach. These developments reflect a concerted effort by key players to enhance device performance, portability, and connectivity:
- March 2024: A leading manufacturer launched a new generation of smart portable Mesh Nebulizer Market devices featuring Bluetooth connectivity, allowing patients and caregivers to monitor treatment adherence via a dedicated mobile application, thereby enhancing outcomes in the Home Healthcare Devices Market.
- December 2023: A major medical technology firm announced a strategic partnership with a pharmaceutical company to develop nebulized formulations for a novel biologic drug, aiming to improve delivery efficiency for specific respiratory conditions, which will impact the broader Chronic Obstructive Pulmonary Disease Therapeutics Market.
- October 2023: Regulatory approval was granted in several key European markets for a high-efficiency vibrating mesh nebulizer, designed to deliver a broader range of viscous medications with faster treatment times for patients suffering from severe asthma.
- July 2023: A new compact and silent ultrasonic nebulizer was introduced, targeting the pediatric segment. This device features a child-friendly design and operates at extremely low noise levels to minimize distress during treatment.
- April 2023: Research efforts showcased the potential of integrating AI-powered analytics into nebulizer devices to predict exacerbations in COPD patients, leveraging data from usage patterns and physiological sensors, indicating future advancements in the Medical Device Connectivity Market.
- February 2023: An industry consortium published updated guidelines for the cleaning and maintenance of nebulizer devices in home settings, emphasizing best practices to prevent contamination and ensure optimal therapeutic delivery, critical for long-term use in the Respiratory Care Devices Market.
Regional Market Breakdown for the Nebulizer Devices Market
The global Nebulizer Devices Market exhibits significant regional disparities in terms of market size, growth dynamics, and underlying demand drivers. A comparison of key regions highlights diverse market maturities and growth opportunities.
North America currently holds a substantial revenue share in the Nebulizer Devices Market, driven by a high prevalence of respiratory diseases, advanced healthcare infrastructure, and robust reimbursement policies. The region benefits from early adoption of technologically advanced devices and a strong emphasis on home healthcare. The United States, in particular, contributes significantly to this share due to high healthcare expenditure and consumer awareness. The regional CAGR is estimated to be moderate, reflecting a relatively mature market with consistent demand for innovative Portable Medical Devices Market solutions.
Europe also represents a significant portion of the global market, characterized by an aging population and high standards of medical care. Countries like Germany, the UK, and France are key contributors, propelled by government initiatives to manage chronic diseases and a preference for sophisticated, high-performance nebulizers. The region is experiencing stable growth, with increasing penetration of mesh nebulizers and a growing focus on improving patient adherence through advanced Drug Delivery Devices Market technologies.
Asia Pacific is poised to be the fastest-growing region in the Nebulizer Devices Market, projected to exhibit the highest CAGR over the forecast period. This rapid growth is attributable to several factors, including a massive and expanding population base, improving healthcare infrastructure, rising disposable incomes, and increasing awareness of respiratory ailments. Countries such as China and India are witnessing a surge in the prevalence of asthma and COPD, coupled with expanding access to medical devices. This region presents substantial untapped potential and is a key focus for global manufacturers seeking market expansion, especially for the Home Healthcare Devices Market.
Latin America shows promising growth, albeit from a smaller base, driven by improving healthcare access and increasing investment in medical infrastructure across countries like Brazil and Mexico. The region is characterized by a growing middle class and a rising burden of chronic diseases, leading to increased demand for affordable and effective respiratory care solutions. While still developing, the market here is expected to see a higher-than-average CAGR as healthcare systems mature and patient access improves.
Middle East & Africa (MEA) represents a smaller but growing segment. Demand is primarily influenced by increasing healthcare spending, improving medical facilities, and a rising awareness of respiratory conditions, particularly in the GCC countries. Challenges such as economic disparities and limited access to advanced healthcare in some sub-regions temper the overall growth rate, but targeted initiatives and expanding urban healthcare networks are gradually driving the adoption of Nebulizer Devices Market solutions.
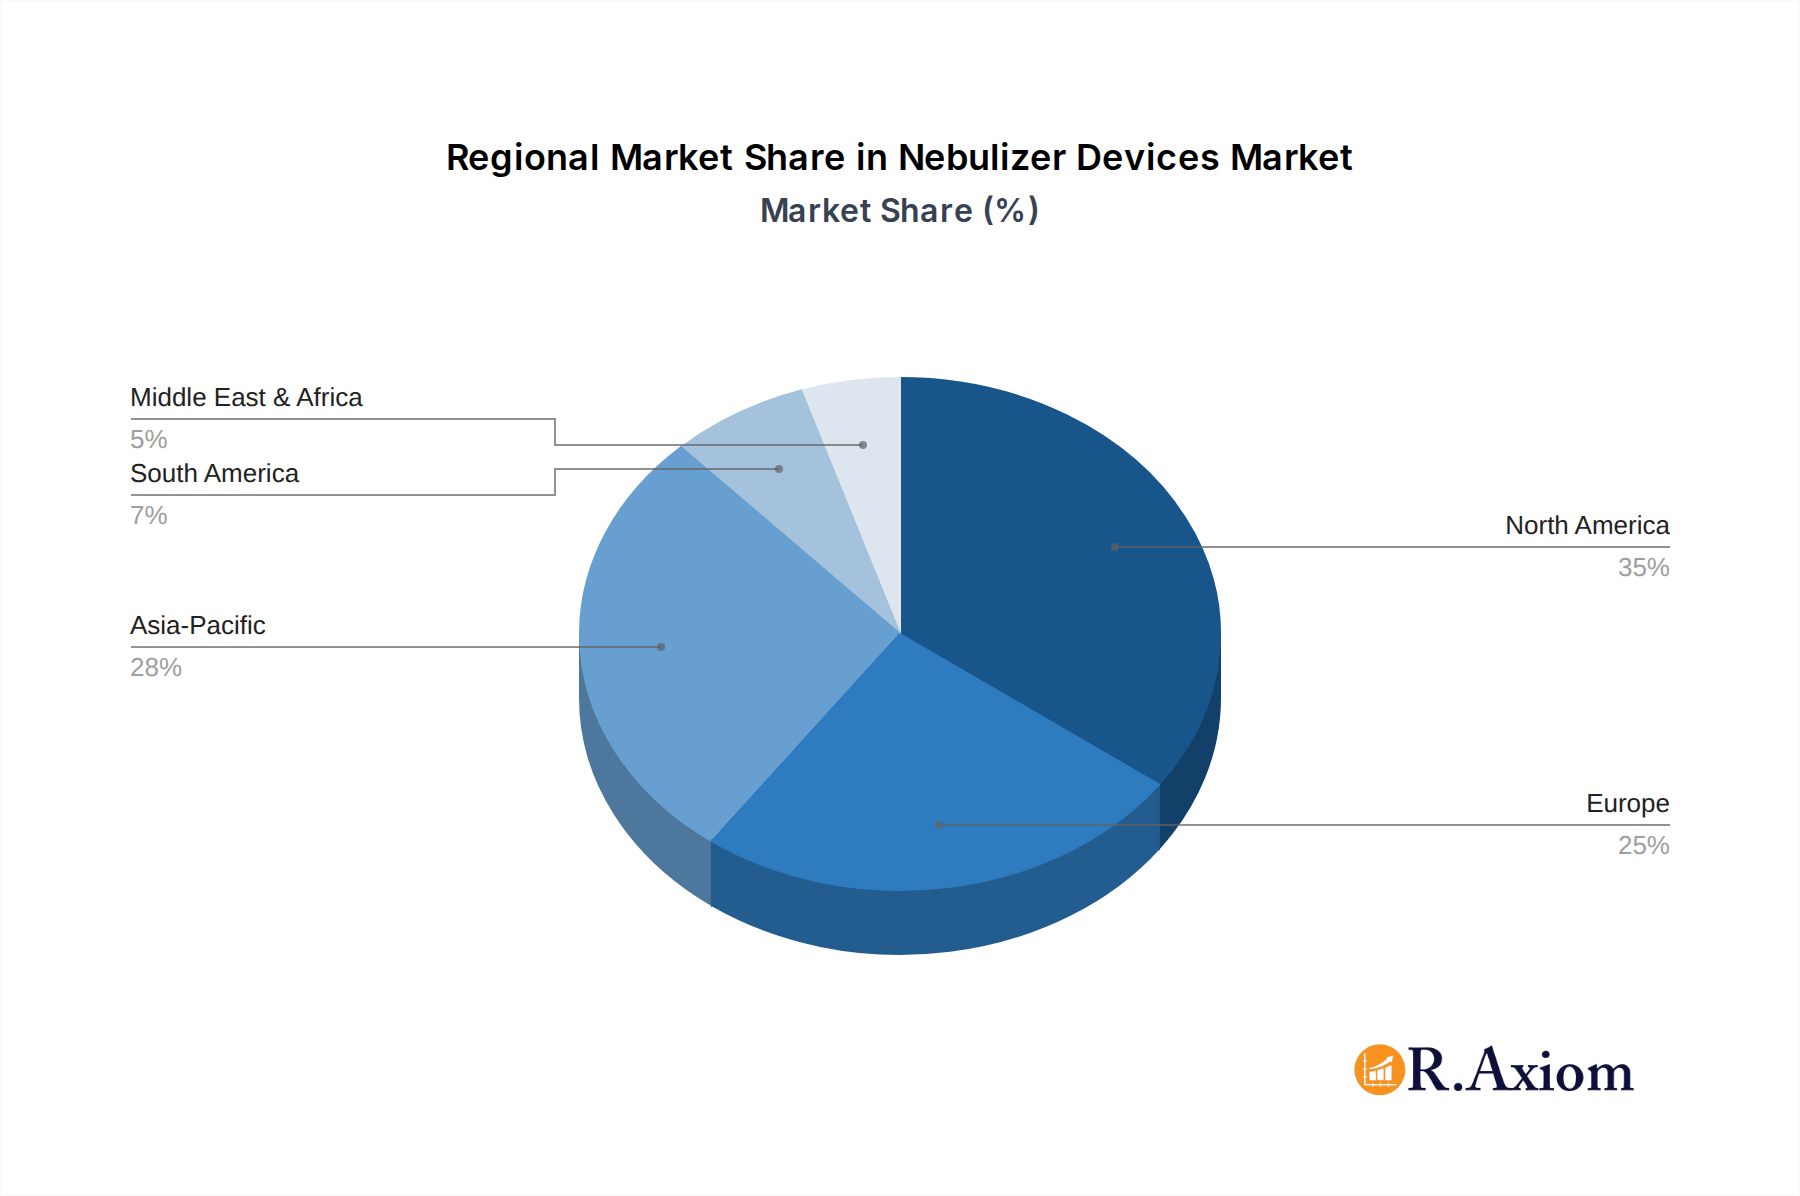
Nebulizer Devices Regional Market Share
Pricing Dynamics & Margin Pressure in the Nebulizer Devices Market
Pricing dynamics within the Nebulizer Devices Market are complex, influenced by technology, distribution channels, regional healthcare policies, and competitive intensity. Average selling prices (ASPs) vary significantly across device types. Traditional jet nebulizers often command lower ASPs, ranging from $20 to $50, appealing to budget-conscious consumers and public health programs. Ultrasonic nebulizers typically fall in a mid-range, while advanced Mesh Nebulizer Market devices, known for their efficiency, portability, and silent operation, can fetch premium prices, often $100 to $300 or more, reflecting their higher manufacturing costs and superior performance. This price segmentation allows manufacturers to cater to diverse economic segments and clinical needs within the Respiratory Care Devices Market.
Margin structures across the value chain are influenced by several factors. Manufacturers typically operate with moderate to high margins on innovative products, particularly those with patented technologies. However, intense competition, especially in the jet nebulizer segment, can exert significant margin pressure, leading to aggressive pricing strategies. Distribution channels, including hospital pharmacies, retail pharmacies, and online platforms, each add their margin. Online pharmacies, while offering convenience, often compete on price, potentially squeezing downstream margins. Reimbursement policies, particularly in developed markets, play a crucial role. Devices covered by insurance or government programs may allow for stable pricing, while out-of-pocket purchases are more sensitive to price fluctuations.
Key cost levers include raw material procurement, manufacturing scale, and R&D investment. The cost of Medical Plastics Market components, electronic parts, and specialized vibrating mesh elements directly impacts production costs. Supply chain efficiencies and large-scale manufacturing can help mitigate these costs. Commodity cycles, such as fluctuations in polymer prices, can affect the cost of goods sold. Competitive intensity forces manufacturers to continuously innovate while optimizing their cost structures. Companies that successfully differentiate through technology (e.g., smart features for Medical Device Connectivity Market), clinical efficacy, or strong brand recognition often possess greater pricing power, enabling them to maintain healthier margins despite market pressures.
Supply Chain & Raw Material Dynamics for the Nebulizer Devices Market
The supply chain for the Nebulizer Devices Market is intricate, involving a global network of raw material suppliers, component manufacturers, assembly plants, and distribution channels. Upstream dependencies are critical, with the market reliant on a steady supply of various materials and electronic components. Key raw materials include specialized Medical Plastics Market (such as polycarbonate, ABS, and polypropylene) for device housings, tubing, and medication cups; electronic components for power management, controls, and ultrasonic/mesh vibration mechanisms; and metals (e.g., stainless steel for some nozzles or chassis elements). Piezoelectric ceramics are crucial for ultrasonic and vibrating mesh nebulizers, converting electrical energy into mechanical vibrations for aerosol generation. These materials typically originate from a concentrated base of suppliers, leading to potential sourcing risks.
Price volatility of key inputs can significantly impact manufacturing costs and, consequently, the final pricing dynamics of nebulizer devices. For instance, global oil price fluctuations directly affect the cost of petroleum-derived polymers used in the Medical Plastics Market. Similarly, shortages or price increases in critical electronic components, often sourced from East Asia, can disrupt production schedules and elevate costs. The COVID-19 pandemic vividly demonstrated how global supply chain disruptions, including factory shutdowns, port congestion, and freight cost surges, could severely impact the availability and cost of components for the Portable Medical Devices Market. Manufacturers experienced delays in receiving electronic chips, plastic resins, and even packaging materials, leading to increased lead times and higher production expenses.
Moreover, the manufacturing process for nebulizers often involves precision engineering, especially for Mesh Nebulizer Market devices, which require microscopic apertures for efficient aerosolization. This adds a layer of complexity and dependency on specialized machinery and expertise. Companies frequently manage these risks through diversified sourcing strategies, long-term contracts with key suppliers, and maintaining buffer inventories. The ethical sourcing of materials and compliance with environmental regulations are also increasingly important considerations. As the demand for nebulizers, particularly in the Home Healthcare Devices Market, continues to grow, maintaining a resilient and efficient supply chain capable of adapting to geopolitical events and economic shifts remains a paramount concern for all market participants.
Nebulizer Devices Segmentation
-
1. Type
- 1.1. Jet
- 1.2. Ultrasonic
- 1.3. Mesh
-
2. Form
- 2.1. Stationary
- 2.2. Portable
-
3. Age Group
- 3.1. Pediatric
- 3.2. Adult
- 3.3. Geriatric
-
4. Power Source
- 4.1. Electricity
-
4.2. Batteries
- 4.2.1. Rechargeable
- 4.2.2. Disposable
- 4.3. Others
-
5. Application
- 5.1. Asthma
- 5.2. Chronic Obstructive Pulmonary Disease (COPD)
- 5.3. Cystic Fibrosis
- 5.4. Bronchiectasis
- 5.5. Others
-
6. Distribution Channel
- 6.1. Hospital Pharmacies
- 6.2. Retail Pharmacies
- 6.3. Online Pharmacies
-
7. End-User
- 7.1. Hospitals and Clinics
- 7.2. Home Healthcare
- 7.3. Ambulatory Care
- 7.4. Others
Nebulizer Devices Segmentation By Geography
-
1. North America
- 1.1. United States
- 1.2. Canada
- 1.3. Mexico
-
2. South America
- 2.1. Brazil
- 2.2. Argentina
- 2.3. Rest of South America
-
3. Europe
- 3.1. United Kingdom
- 3.2. Germany
- 3.3. France
- 3.4. Italy
- 3.5. Spain
- 3.6. Russia
- 3.7. Benelux
- 3.8. Nordics
- 3.9. Rest of Europe
-
4. Middle East & Africa
- 4.1. Turkey
- 4.2. Israel
- 4.3. GCC
- 4.4. North Africa
- 4.5. South Africa
- 4.6. Rest of Middle East & Africa
-
5. Asia Pacific
- 5.1. China
- 5.2. India
- 5.3. Japan
- 5.4. South Korea
- 5.5. ASEAN
- 5.6. Oceania
- 5.7. Rest of Asia Pacific
Nebulizer Devices Regional Market Share
Geographic Coverage of Nebulizer Devices
Nebulizer Devices REPORT HIGHLIGHTS
| Aspects | Details |
|---|---|
| Study Period | 2020-2034 |
| Base Year | 2025 |
| Estimated Year | 2026 |
| Forecast Period | 2026-2034 |
| Historical Period | 2020-2025 |
| Growth Rate | CAGR of 9.8% from 2020-2034 |
| Segmentation |
|
Table of Contents
- 1. Introduction
- 1.1. Research Scope
- 1.2. Market Segmentation
- 1.3. Research Objective
- 1.4. Definitions and Assumptions
- 2. Executive Summary
- 2.1. Market Snapshot
- 3. Market Dynamics
- 3.1. Market Drivers
- 3.2. Market Restrains
- 3.3. Market Trends
- 3.4. Market Opportunities
- 4. Market Factor Analysis
- 4.1. Porters Five Forces
- 4.1.1. Bargaining Power of Suppliers
- 4.1.2. Bargaining Power of Buyers
- 4.1.3. Threat of New Entrants
- 4.1.4. Threat of Substitutes
- 4.1.5. Competitive Rivalry
- 4.2. PESTEL analysis
- 4.3. BCG Analysis
- 4.3.1. Stars (High Growth, High Market Share)
- 4.3.2. Cash Cows (Low Growth, High Market Share)
- 4.3.3. Question Mark (High Growth, Low Market Share)
- 4.3.4. Dogs (Low Growth, Low Market Share)
- 4.4. Ansoff Matrix Analysis
- 4.5. Supply Chain Analysis
- 4.6. Regulatory Landscape
- 4.7. Current Market Potential and Opportunity Assessment (TAM–SAM–SOM Framework)
- 4.8. RAX Analyst Note
- 4.1. Porters Five Forces
- 5. Market Analysis, Insights and Forecast 2021-2033
- 5.1. Market Analysis, Insights and Forecast - by Type
- 5.1.1. Jet
- 5.1.2. Ultrasonic
- 5.1.3. Mesh
- 5.2. Market Analysis, Insights and Forecast - by Form
- 5.2.1. Stationary
- 5.2.2. Portable
- 5.3. Market Analysis, Insights and Forecast - by Age Group
- 5.3.1. Pediatric
- 5.3.2. Adult
- 5.3.3. Geriatric
- 5.4. Market Analysis, Insights and Forecast - by Power Source
- 5.4.1. Electricity
- 5.4.2. Batteries
- 5.4.2.1. Rechargeable
- 5.4.2.2. Disposable
- 5.4.3. Others
- 5.5. Market Analysis, Insights and Forecast - by Application
- 5.5.1. Asthma
- 5.5.2. Chronic Obstructive Pulmonary Disease (COPD)
- 5.5.3. Cystic Fibrosis
- 5.5.4. Bronchiectasis
- 5.5.5. Others
- 5.6. Market Analysis, Insights and Forecast - by Distribution Channel
- 5.6.1. Hospital Pharmacies
- 5.6.2. Retail Pharmacies
- 5.6.3. Online Pharmacies
- 5.7. Market Analysis, Insights and Forecast - by End-User
- 5.7.1. Hospitals and Clinics
- 5.7.2. Home Healthcare
- 5.7.3. Ambulatory Care
- 5.7.4. Others
- 5.8. Market Analysis, Insights and Forecast - by Region
- 5.8.1. North America
- 5.8.2. South America
- 5.8.3. Europe
- 5.8.4. Middle East & Africa
- 5.8.5. Asia Pacific
- 5.1. Market Analysis, Insights and Forecast - by Type
- 6. Global Nebulizer Devices Analysis, Insights and Forecast, 2021-2033
- 6.1. Market Analysis, Insights and Forecast - by Type
- 6.1.1. Jet
- 6.1.2. Ultrasonic
- 6.1.3. Mesh
- 6.2. Market Analysis, Insights and Forecast - by Form
- 6.2.1. Stationary
- 6.2.2. Portable
- 6.3. Market Analysis, Insights and Forecast - by Age Group
- 6.3.1. Pediatric
- 6.3.2. Adult
- 6.3.3. Geriatric
- 6.4. Market Analysis, Insights and Forecast - by Power Source
- 6.4.1. Electricity
- 6.4.2. Batteries
- 6.4.2.1. Rechargeable
- 6.4.2.2. Disposable
- 6.4.3. Others
- 6.5. Market Analysis, Insights and Forecast - by Application
- 6.5.1. Asthma
- 6.5.2. Chronic Obstructive Pulmonary Disease (COPD)
- 6.5.3. Cystic Fibrosis
- 6.5.4. Bronchiectasis
- 6.5.5. Others
- 6.6. Market Analysis, Insights and Forecast - by Distribution Channel
- 6.6.1. Hospital Pharmacies
- 6.6.2. Retail Pharmacies
- 6.6.3. Online Pharmacies
- 6.7. Market Analysis, Insights and Forecast - by End-User
- 6.7.1. Hospitals and Clinics
- 6.7.2. Home Healthcare
- 6.7.3. Ambulatory Care
- 6.7.4. Others
- 6.1. Market Analysis, Insights and Forecast - by Type
- 7. North America Nebulizer Devices Analysis, Insights and Forecast, 2020-2032
- 7.1. Market Analysis, Insights and Forecast - by Type
- 7.1.1. Jet
- 7.1.2. Ultrasonic
- 7.1.3. Mesh
- 7.2. Market Analysis, Insights and Forecast - by Form
- 7.2.1. Stationary
- 7.2.2. Portable
- 7.3. Market Analysis, Insights and Forecast - by Age Group
- 7.3.1. Pediatric
- 7.3.2. Adult
- 7.3.3. Geriatric
- 7.4. Market Analysis, Insights and Forecast - by Power Source
- 7.4.1. Electricity
- 7.4.2. Batteries
- 7.4.2.1. Rechargeable
- 7.4.2.2. Disposable
- 7.4.3. Others
- 7.5. Market Analysis, Insights and Forecast - by Application
- 7.5.1. Asthma
- 7.5.2. Chronic Obstructive Pulmonary Disease (COPD)
- 7.5.3. Cystic Fibrosis
- 7.5.4. Bronchiectasis
- 7.5.5. Others
- 7.6. Market Analysis, Insights and Forecast - by Distribution Channel
- 7.6.1. Hospital Pharmacies
- 7.6.2. Retail Pharmacies
- 7.6.3. Online Pharmacies
- 7.7. Market Analysis, Insights and Forecast - by End-User
- 7.7.1. Hospitals and Clinics
- 7.7.2. Home Healthcare
- 7.7.3. Ambulatory Care
- 7.7.4. Others
- 7.1. Market Analysis, Insights and Forecast - by Type
- 8. South America Nebulizer Devices Analysis, Insights and Forecast, 2020-2032
- 8.1. Market Analysis, Insights and Forecast - by Type
- 8.1.1. Jet
- 8.1.2. Ultrasonic
- 8.1.3. Mesh
- 8.2. Market Analysis, Insights and Forecast - by Form
- 8.2.1. Stationary
- 8.2.2. Portable
- 8.3. Market Analysis, Insights and Forecast - by Age Group
- 8.3.1. Pediatric
- 8.3.2. Adult
- 8.3.3. Geriatric
- 8.4. Market Analysis, Insights and Forecast - by Power Source
- 8.4.1. Electricity
- 8.4.2. Batteries
- 8.4.2.1. Rechargeable
- 8.4.2.2. Disposable
- 8.4.3. Others
- 8.5. Market Analysis, Insights and Forecast - by Application
- 8.5.1. Asthma
- 8.5.2. Chronic Obstructive Pulmonary Disease (COPD)
- 8.5.3. Cystic Fibrosis
- 8.5.4. Bronchiectasis
- 8.5.5. Others
- 8.6. Market Analysis, Insights and Forecast - by Distribution Channel
- 8.6.1. Hospital Pharmacies
- 8.6.2. Retail Pharmacies
- 8.6.3. Online Pharmacies
- 8.7. Market Analysis, Insights and Forecast - by End-User
- 8.7.1. Hospitals and Clinics
- 8.7.2. Home Healthcare
- 8.7.3. Ambulatory Care
- 8.7.4. Others
- 8.1. Market Analysis, Insights and Forecast - by Type
- 9. Europe Nebulizer Devices Analysis, Insights and Forecast, 2020-2032
- 9.1. Market Analysis, Insights and Forecast - by Type
- 9.1.1. Jet
- 9.1.2. Ultrasonic
- 9.1.3. Mesh
- 9.2. Market Analysis, Insights and Forecast - by Form
- 9.2.1. Stationary
- 9.2.2. Portable
- 9.3. Market Analysis, Insights and Forecast - by Age Group
- 9.3.1. Pediatric
- 9.3.2. Adult
- 9.3.3. Geriatric
- 9.4. Market Analysis, Insights and Forecast - by Power Source
- 9.4.1. Electricity
- 9.4.2. Batteries
- 9.4.2.1. Rechargeable
- 9.4.2.2. Disposable
- 9.4.3. Others
- 9.5. Market Analysis, Insights and Forecast - by Application
- 9.5.1. Asthma
- 9.5.2. Chronic Obstructive Pulmonary Disease (COPD)
- 9.5.3. Cystic Fibrosis
- 9.5.4. Bronchiectasis
- 9.5.5. Others
- 9.6. Market Analysis, Insights and Forecast - by Distribution Channel
- 9.6.1. Hospital Pharmacies
- 9.6.2. Retail Pharmacies
- 9.6.3. Online Pharmacies
- 9.7. Market Analysis, Insights and Forecast - by End-User
- 9.7.1. Hospitals and Clinics
- 9.7.2. Home Healthcare
- 9.7.3. Ambulatory Care
- 9.7.4. Others
- 9.1. Market Analysis, Insights and Forecast - by Type
- 10. Middle East & Africa Nebulizer Devices Analysis, Insights and Forecast, 2020-2032
- 10.1. Market Analysis, Insights and Forecast - by Type
- 10.1.1. Jet
- 10.1.2. Ultrasonic
- 10.1.3. Mesh
- 10.2. Market Analysis, Insights and Forecast - by Form
- 10.2.1. Stationary
- 10.2.2. Portable
- 10.3. Market Analysis, Insights and Forecast - by Age Group
- 10.3.1. Pediatric
- 10.3.2. Adult
- 10.3.3. Geriatric
- 10.4. Market Analysis, Insights and Forecast - by Power Source
- 10.4.1. Electricity
- 10.4.2. Batteries
- 10.4.2.1. Rechargeable
- 10.4.2.2. Disposable
- 10.4.3. Others
- 10.5. Market Analysis, Insights and Forecast - by Application
- 10.5.1. Asthma
- 10.5.2. Chronic Obstructive Pulmonary Disease (COPD)
- 10.5.3. Cystic Fibrosis
- 10.5.4. Bronchiectasis
- 10.5.5. Others
- 10.6. Market Analysis, Insights and Forecast - by Distribution Channel
- 10.6.1. Hospital Pharmacies
- 10.6.2. Retail Pharmacies
- 10.6.3. Online Pharmacies
- 10.7. Market Analysis, Insights and Forecast - by End-User
- 10.7.1. Hospitals and Clinics
- 10.7.2. Home Healthcare
- 10.7.3. Ambulatory Care
- 10.7.4. Others
- 10.1. Market Analysis, Insights and Forecast - by Type
- 11. Asia Pacific Nebulizer Devices Analysis, Insights and Forecast, 2020-2032
- 11.1. Market Analysis, Insights and Forecast - by Type
- 11.1.1. Jet
- 11.1.2. Ultrasonic
- 11.1.3. Mesh
- 11.2. Market Analysis, Insights and Forecast - by Form
- 11.2.1. Stationary
- 11.2.2. Portable
- 11.3. Market Analysis, Insights and Forecast - by Age Group
- 11.3.1. Pediatric
- 11.3.2. Adult
- 11.3.3. Geriatric
- 11.4. Market Analysis, Insights and Forecast - by Power Source
- 11.4.1. Electricity
- 11.4.2. Batteries
- 11.4.2.1. Rechargeable
- 11.4.2.2. Disposable
- 11.4.3. Others
- 11.5. Market Analysis, Insights and Forecast - by Application
- 11.5.1. Asthma
- 11.5.2. Chronic Obstructive Pulmonary Disease (COPD)
- 11.5.3. Cystic Fibrosis
- 11.5.4. Bronchiectasis
- 11.5.5. Others
- 11.6. Market Analysis, Insights and Forecast - by Distribution Channel
- 11.6.1. Hospital Pharmacies
- 11.6.2. Retail Pharmacies
- 11.6.3. Online Pharmacies
- 11.7. Market Analysis, Insights and Forecast - by End-User
- 11.7.1. Hospitals and Clinics
- 11.7.2. Home Healthcare
- 11.7.3. Ambulatory Care
- 11.7.4. Others
- 11.1. Market Analysis, Insights and Forecast - by Type
- 12. Competitive Analysis
- 12.1. Company Profiles
- 12.1.1 OMRON Healthcare Inc.
- 12.1.1.1. Company Overview
- 12.1.1.2. Products
- 12.1.1.3. Company Financials
- 12.1.1.4. SWOT Analysis
- 12.1.2 PARI GmbH
- 12.1.2.1. Company Overview
- 12.1.2.2. Products
- 12.1.2.3. Company Financials
- 12.1.2.4. SWOT Analysis
- 12.1.3 Drive Devilbiss International
- 12.1.3.1. Company Overview
- 12.1.3.2. Products
- 12.1.3.3. Company Financials
- 12.1.3.4. SWOT Analysis
- 12.1.4 Aerogen Ltd.
- 12.1.4.1. Company Overview
- 12.1.4.2. Products
- 12.1.4.3. Company Financials
- 12.1.4.4. SWOT Analysis
- 12.1.5 BD
- 12.1.5.1. Company Overview
- 12.1.5.2. Products
- 12.1.5.3. Company Financials
- 12.1.5.4. SWOT Analysis
- 12.1.6 Medline
- 12.1.6.1. Company Overview
- 12.1.6.2. Products
- 12.1.6.3. Company Financials
- 12.1.6.4. SWOT Analysis
- 12.1.7 GE HealthCare
- 12.1.7.1. Company Overview
- 12.1.7.2. Products
- 12.1.7.3. Company Financials
- 12.1.7.4. SWOT Analysis
- 12.1.8 Medtronic
- 12.1.8.1. Company Overview
- 12.1.8.2. Products
- 12.1.8.3. Company Financials
- 12.1.8.4. SWOT Analysis
- 12.1.9 Beurer GmbH
- 12.1.9.1. Company Overview
- 12.1.9.2. Products
- 12.1.9.3. Company Financials
- 12.1.9.4. SWOT Analysis
- 12.1.10 Rossmax International Ltd.
- 12.1.10.1. Company Overview
- 12.1.10.2. Products
- 12.1.10.3. Company Financials
- 12.1.10.4. SWOT Analysis
- 12.1.11 GF Health Products Inc.
- 12.1.11.1. Company Overview
- 12.1.11.2. Products
- 12.1.11.3. Company Financials
- 12.1.11.4. SWOT Analysis
- 12.1.12 BPL Medical Technologies
- 12.1.12.1. Company Overview
- 12.1.12.2. Products
- 12.1.12.3. Company Financials
- 12.1.12.4. SWOT Analysis
- 12.1.13 Microlife Corporation
- 12.1.13.1. Company Overview
- 12.1.13.2. Products
- 12.1.13.3. Company Financials
- 12.1.13.4. SWOT Analysis
- 12.1.14 Others
- 12.1.14.1. Company Overview
- 12.1.14.2. Products
- 12.1.14.3. Company Financials
- 12.1.14.4. SWOT Analysis
- 12.1.1 OMRON Healthcare Inc.
- 12.2. Market Entropy
- 12.2.1 Company's Key Areas Served
- 12.2.2 Recent Developments
- 12.3. Company Market Share Analysis 2025
- 12.3.1 Top 5 Companies Market Share Analysis
- 12.3.2 Top 3 Companies Market Share Analysis
- 12.4. List of Potential Customers
- 13. Research Methodology
List of Figures
- Figure 1: Global Nebulizer Devices Revenue Breakdown (billion, %) by Region 2025 & 2033
- Figure 2: Global Nebulizer Devices Volume Breakdown (K, %) by Region 2025 & 2033
- Figure 3: North America Nebulizer Devices Revenue (billion), by Type 2025 & 2033
- Figure 4: North America Nebulizer Devices Volume (K), by Type 2025 & 2033
- Figure 5: North America Nebulizer Devices Revenue Share (%), by Type 2025 & 2033
- Figure 6: North America Nebulizer Devices Volume Share (%), by Type 2025 & 2033
- Figure 7: North America Nebulizer Devices Revenue (billion), by Form 2025 & 2033
- Figure 8: North America Nebulizer Devices Volume (K), by Form 2025 & 2033
- Figure 9: North America Nebulizer Devices Revenue Share (%), by Form 2025 & 2033
- Figure 10: North America Nebulizer Devices Volume Share (%), by Form 2025 & 2033
- Figure 11: North America Nebulizer Devices Revenue (billion), by Age Group 2025 & 2033
- Figure 12: North America Nebulizer Devices Volume (K), by Age Group 2025 & 2033
- Figure 13: North America Nebulizer Devices Revenue Share (%), by Age Group 2025 & 2033
- Figure 14: North America Nebulizer Devices Volume Share (%), by Age Group 2025 & 2033
- Figure 15: North America Nebulizer Devices Revenue (billion), by Power Source 2025 & 2033
- Figure 16: North America Nebulizer Devices Volume (K), by Power Source 2025 & 2033
- Figure 17: North America Nebulizer Devices Revenue Share (%), by Power Source 2025 & 2033
- Figure 18: North America Nebulizer Devices Volume Share (%), by Power Source 2025 & 2033
- Figure 19: North America Nebulizer Devices Revenue (billion), by Application 2025 & 2033
- Figure 20: North America Nebulizer Devices Volume (K), by Application 2025 & 2033
- Figure 21: North America Nebulizer Devices Revenue Share (%), by Application 2025 & 2033
- Figure 22: North America Nebulizer Devices Volume Share (%), by Application 2025 & 2033
- Figure 23: North America Nebulizer Devices Revenue (billion), by Distribution Channel 2025 & 2033
- Figure 24: North America Nebulizer Devices Volume (K), by Distribution Channel 2025 & 2033
- Figure 25: North America Nebulizer Devices Revenue Share (%), by Distribution Channel 2025 & 2033
- Figure 26: North America Nebulizer Devices Volume Share (%), by Distribution Channel 2025 & 2033
- Figure 27: North America Nebulizer Devices Revenue (billion), by End-User 2025 & 2033
- Figure 28: North America Nebulizer Devices Volume (K), by End-User 2025 & 2033
- Figure 29: North America Nebulizer Devices Revenue Share (%), by End-User 2025 & 2033
- Figure 30: North America Nebulizer Devices Volume Share (%), by End-User 2025 & 2033
- Figure 31: North America Nebulizer Devices Revenue (billion), by Country 2025 & 2033
- Figure 32: North America Nebulizer Devices Volume (K), by Country 2025 & 2033
- Figure 33: North America Nebulizer Devices Revenue Share (%), by Country 2025 & 2033
- Figure 34: North America Nebulizer Devices Volume Share (%), by Country 2025 & 2033
- Figure 35: South America Nebulizer Devices Revenue (billion), by Type 2025 & 2033
- Figure 36: South America Nebulizer Devices Volume (K), by Type 2025 & 2033
- Figure 37: South America Nebulizer Devices Revenue Share (%), by Type 2025 & 2033
- Figure 38: South America Nebulizer Devices Volume Share (%), by Type 2025 & 2033
- Figure 39: South America Nebulizer Devices Revenue (billion), by Form 2025 & 2033
- Figure 40: South America Nebulizer Devices Volume (K), by Form 2025 & 2033
- Figure 41: South America Nebulizer Devices Revenue Share (%), by Form 2025 & 2033
- Figure 42: South America Nebulizer Devices Volume Share (%), by Form 2025 & 2033
- Figure 43: South America Nebulizer Devices Revenue (billion), by Age Group 2025 & 2033
- Figure 44: South America Nebulizer Devices Volume (K), by Age Group 2025 & 2033
- Figure 45: South America Nebulizer Devices Revenue Share (%), by Age Group 2025 & 2033
- Figure 46: South America Nebulizer Devices Volume Share (%), by Age Group 2025 & 2033
- Figure 47: South America Nebulizer Devices Revenue (billion), by Power Source 2025 & 2033
- Figure 48: South America Nebulizer Devices Volume (K), by Power Source 2025 & 2033
- Figure 49: South America Nebulizer Devices Revenue Share (%), by Power Source 2025 & 2033
- Figure 50: South America Nebulizer Devices Volume Share (%), by Power Source 2025 & 2033
- Figure 51: South America Nebulizer Devices Revenue (billion), by Application 2025 & 2033
- Figure 52: South America Nebulizer Devices Volume (K), by Application 2025 & 2033
- Figure 53: South America Nebulizer Devices Revenue Share (%), by Application 2025 & 2033
- Figure 54: South America Nebulizer Devices Volume Share (%), by Application 2025 & 2033
- Figure 55: South America Nebulizer Devices Revenue (billion), by Distribution Channel 2025 & 2033
- Figure 56: South America Nebulizer Devices Volume (K), by Distribution Channel 2025 & 2033
- Figure 57: South America Nebulizer Devices Revenue Share (%), by Distribution Channel 2025 & 2033
- Figure 58: South America Nebulizer Devices Volume Share (%), by Distribution Channel 2025 & 2033
- Figure 59: South America Nebulizer Devices Revenue (billion), by End-User 2025 & 2033
- Figure 60: South America Nebulizer Devices Volume (K), by End-User 2025 & 2033
- Figure 61: South America Nebulizer Devices Revenue Share (%), by End-User 2025 & 2033
- Figure 62: South America Nebulizer Devices Volume Share (%), by End-User 2025 & 2033
- Figure 63: South America Nebulizer Devices Revenue (billion), by Country 2025 & 2033
- Figure 64: South America Nebulizer Devices Volume (K), by Country 2025 & 2033
- Figure 65: South America Nebulizer Devices Revenue Share (%), by Country 2025 & 2033
- Figure 66: South America Nebulizer Devices Volume Share (%), by Country 2025 & 2033
- Figure 67: Europe Nebulizer Devices Revenue (billion), by Type 2025 & 2033
- Figure 68: Europe Nebulizer Devices Volume (K), by Type 2025 & 2033
- Figure 69: Europe Nebulizer Devices Revenue Share (%), by Type 2025 & 2033
- Figure 70: Europe Nebulizer Devices Volume Share (%), by Type 2025 & 2033
- Figure 71: Europe Nebulizer Devices Revenue (billion), by Form 2025 & 2033
- Figure 72: Europe Nebulizer Devices Volume (K), by Form 2025 & 2033
- Figure 73: Europe Nebulizer Devices Revenue Share (%), by Form 2025 & 2033
- Figure 74: Europe Nebulizer Devices Volume Share (%), by Form 2025 & 2033
- Figure 75: Europe Nebulizer Devices Revenue (billion), by Age Group 2025 & 2033
- Figure 76: Europe Nebulizer Devices Volume (K), by Age Group 2025 & 2033
- Figure 77: Europe Nebulizer Devices Revenue Share (%), by Age Group 2025 & 2033
- Figure 78: Europe Nebulizer Devices Volume Share (%), by Age Group 2025 & 2033
- Figure 79: Europe Nebulizer Devices Revenue (billion), by Power Source 2025 & 2033
- Figure 80: Europe Nebulizer Devices Volume (K), by Power Source 2025 & 2033
- Figure 81: Europe Nebulizer Devices Revenue Share (%), by Power Source 2025 & 2033
- Figure 82: Europe Nebulizer Devices Volume Share (%), by Power Source 2025 & 2033
- Figure 83: Europe Nebulizer Devices Revenue (billion), by Application 2025 & 2033
- Figure 84: Europe Nebulizer Devices Volume (K), by Application 2025 & 2033
- Figure 85: Europe Nebulizer Devices Revenue Share (%), by Application 2025 & 2033
- Figure 86: Europe Nebulizer Devices Volume Share (%), by Application 2025 & 2033
- Figure 87: Europe Nebulizer Devices Revenue (billion), by Distribution Channel 2025 & 2033
- Figure 88: Europe Nebulizer Devices Volume (K), by Distribution Channel 2025 & 2033
- Figure 89: Europe Nebulizer Devices Revenue Share (%), by Distribution Channel 2025 & 2033
- Figure 90: Europe Nebulizer Devices Volume Share (%), by Distribution Channel 2025 & 2033
- Figure 91: Europe Nebulizer Devices Revenue (billion), by End-User 2025 & 2033
- Figure 92: Europe Nebulizer Devices Volume (K), by End-User 2025 & 2033
- Figure 93: Europe Nebulizer Devices Revenue Share (%), by End-User 2025 & 2033
- Figure 94: Europe Nebulizer Devices Volume Share (%), by End-User 2025 & 2033
- Figure 95: Europe Nebulizer Devices Revenue (billion), by Country 2025 & 2033
- Figure 96: Europe Nebulizer Devices Volume (K), by Country 2025 & 2033
- Figure 97: Europe Nebulizer Devices Revenue Share (%), by Country 2025 & 2033
- Figure 98: Europe Nebulizer Devices Volume Share (%), by Country 2025 & 2033
- Figure 99: Middle East & Africa Nebulizer Devices Revenue (billion), by Type 2025 & 2033
- Figure 100: Middle East & Africa Nebulizer Devices Volume (K), by Type 2025 & 2033
- Figure 101: Middle East & Africa Nebulizer Devices Revenue Share (%), by Type 2025 & 2033
- Figure 102: Middle East & Africa Nebulizer Devices Volume Share (%), by Type 2025 & 2033
- Figure 103: Middle East & Africa Nebulizer Devices Revenue (billion), by Form 2025 & 2033
- Figure 104: Middle East & Africa Nebulizer Devices Volume (K), by Form 2025 & 2033
- Figure 105: Middle East & Africa Nebulizer Devices Revenue Share (%), by Form 2025 & 2033
- Figure 106: Middle East & Africa Nebulizer Devices Volume Share (%), by Form 2025 & 2033
- Figure 107: Middle East & Africa Nebulizer Devices Revenue (billion), by Age Group 2025 & 2033
- Figure 108: Middle East & Africa Nebulizer Devices Volume (K), by Age Group 2025 & 2033
- Figure 109: Middle East & Africa Nebulizer Devices Revenue Share (%), by Age Group 2025 & 2033
- Figure 110: Middle East & Africa Nebulizer Devices Volume Share (%), by Age Group 2025 & 2033
- Figure 111: Middle East & Africa Nebulizer Devices Revenue (billion), by Power Source 2025 & 2033
- Figure 112: Middle East & Africa Nebulizer Devices Volume (K), by Power Source 2025 & 2033
- Figure 113: Middle East & Africa Nebulizer Devices Revenue Share (%), by Power Source 2025 & 2033
- Figure 114: Middle East & Africa Nebulizer Devices Volume Share (%), by Power Source 2025 & 2033
- Figure 115: Middle East & Africa Nebulizer Devices Revenue (billion), by Application 2025 & 2033
- Figure 116: Middle East & Africa Nebulizer Devices Volume (K), by Application 2025 & 2033
- Figure 117: Middle East & Africa Nebulizer Devices Revenue Share (%), by Application 2025 & 2033
- Figure 118: Middle East & Africa Nebulizer Devices Volume Share (%), by Application 2025 & 2033
- Figure 119: Middle East & Africa Nebulizer Devices Revenue (billion), by Distribution Channel 2025 & 2033
- Figure 120: Middle East & Africa Nebulizer Devices Volume (K), by Distribution Channel 2025 & 2033
- Figure 121: Middle East & Africa Nebulizer Devices Revenue Share (%), by Distribution Channel 2025 & 2033
- Figure 122: Middle East & Africa Nebulizer Devices Volume Share (%), by Distribution Channel 2025 & 2033
- Figure 123: Middle East & Africa Nebulizer Devices Revenue (billion), by End-User 2025 & 2033
- Figure 124: Middle East & Africa Nebulizer Devices Volume (K), by End-User 2025 & 2033
- Figure 125: Middle East & Africa Nebulizer Devices Revenue Share (%), by End-User 2025 & 2033
- Figure 126: Middle East & Africa Nebulizer Devices Volume Share (%), by End-User 2025 & 2033
- Figure 127: Middle East & Africa Nebulizer Devices Revenue (billion), by Country 2025 & 2033
- Figure 128: Middle East & Africa Nebulizer Devices Volume (K), by Country 2025 & 2033
- Figure 129: Middle East & Africa Nebulizer Devices Revenue Share (%), by Country 2025 & 2033
- Figure 130: Middle East & Africa Nebulizer Devices Volume Share (%), by Country 2025 & 2033
- Figure 131: Asia Pacific Nebulizer Devices Revenue (billion), by Type 2025 & 2033
- Figure 132: Asia Pacific Nebulizer Devices Volume (K), by Type 2025 & 2033
- Figure 133: Asia Pacific Nebulizer Devices Revenue Share (%), by Type 2025 & 2033
- Figure 134: Asia Pacific Nebulizer Devices Volume Share (%), by Type 2025 & 2033
- Figure 135: Asia Pacific Nebulizer Devices Revenue (billion), by Form 2025 & 2033
- Figure 136: Asia Pacific Nebulizer Devices Volume (K), by Form 2025 & 2033
- Figure 137: Asia Pacific Nebulizer Devices Revenue Share (%), by Form 2025 & 2033
- Figure 138: Asia Pacific Nebulizer Devices Volume Share (%), by Form 2025 & 2033
- Figure 139: Asia Pacific Nebulizer Devices Revenue (billion), by Age Group 2025 & 2033
- Figure 140: Asia Pacific Nebulizer Devices Volume (K), by Age Group 2025 & 2033
- Figure 141: Asia Pacific Nebulizer Devices Revenue Share (%), by Age Group 2025 & 2033
- Figure 142: Asia Pacific Nebulizer Devices Volume Share (%), by Age Group 2025 & 2033
- Figure 143: Asia Pacific Nebulizer Devices Revenue (billion), by Power Source 2025 & 2033
- Figure 144: Asia Pacific Nebulizer Devices Volume (K), by Power Source 2025 & 2033
- Figure 145: Asia Pacific Nebulizer Devices Revenue Share (%), by Power Source 2025 & 2033
- Figure 146: Asia Pacific Nebulizer Devices Volume Share (%), by Power Source 2025 & 2033
- Figure 147: Asia Pacific Nebulizer Devices Revenue (billion), by Application 2025 & 2033
- Figure 148: Asia Pacific Nebulizer Devices Volume (K), by Application 2025 & 2033
- Figure 149: Asia Pacific Nebulizer Devices Revenue Share (%), by Application 2025 & 2033
- Figure 150: Asia Pacific Nebulizer Devices Volume Share (%), by Application 2025 & 2033
- Figure 151: Asia Pacific Nebulizer Devices Revenue (billion), by Distribution Channel 2025 & 2033
- Figure 152: Asia Pacific Nebulizer Devices Volume (K), by Distribution Channel 2025 & 2033
- Figure 153: Asia Pacific Nebulizer Devices Revenue Share (%), by Distribution Channel 2025 & 2033
- Figure 154: Asia Pacific Nebulizer Devices Volume Share (%), by Distribution Channel 2025 & 2033
- Figure 155: Asia Pacific Nebulizer Devices Revenue (billion), by End-User 2025 & 2033
- Figure 156: Asia Pacific Nebulizer Devices Volume (K), by End-User 2025 & 2033
- Figure 157: Asia Pacific Nebulizer Devices Revenue Share (%), by End-User 2025 & 2033
- Figure 158: Asia Pacific Nebulizer Devices Volume Share (%), by End-User 2025 & 2033
- Figure 159: Asia Pacific Nebulizer Devices Revenue (billion), by Country 2025 & 2033
- Figure 160: Asia Pacific Nebulizer Devices Volume (K), by Country 2025 & 2033
- Figure 161: Asia Pacific Nebulizer Devices Revenue Share (%), by Country 2025 & 2033
- Figure 162: Asia Pacific Nebulizer Devices Volume Share (%), by Country 2025 & 2033
List of Tables
- Table 1: Global Nebulizer Devices Revenue billion Forecast, by Type 2020 & 2033
- Table 2: Global Nebulizer Devices Volume K Forecast, by Type 2020 & 2033
- Table 3: Global Nebulizer Devices Revenue billion Forecast, by Form 2020 & 2033
- Table 4: Global Nebulizer Devices Volume K Forecast, by Form 2020 & 2033
- Table 5: Global Nebulizer Devices Revenue billion Forecast, by Age Group 2020 & 2033
- Table 6: Global Nebulizer Devices Volume K Forecast, by Age Group 2020 & 2033
- Table 7: Global Nebulizer Devices Revenue billion Forecast, by Power Source 2020 & 2033
- Table 8: Global Nebulizer Devices Volume K Forecast, by Power Source 2020 & 2033
- Table 9: Global Nebulizer Devices Revenue billion Forecast, by Application 2020 & 2033
- Table 10: Global Nebulizer Devices Volume K Forecast, by Application 2020 & 2033
- Table 11: Global Nebulizer Devices Revenue billion Forecast, by Distribution Channel 2020 & 2033
- Table 12: Global Nebulizer Devices Volume K Forecast, by Distribution Channel 2020 & 2033
- Table 13: Global Nebulizer Devices Revenue billion Forecast, by End-User 2020 & 2033
- Table 14: Global Nebulizer Devices Volume K Forecast, by End-User 2020 & 2033
- Table 15: Global Nebulizer Devices Revenue billion Forecast, by Region 2020 & 2033
- Table 16: Global Nebulizer Devices Volume K Forecast, by Region 2020 & 2033
- Table 17: Global Nebulizer Devices Revenue billion Forecast, by Type 2020 & 2033
- Table 18: Global Nebulizer Devices Volume K Forecast, by Type 2020 & 2033
- Table 19: Global Nebulizer Devices Revenue billion Forecast, by Form 2020 & 2033
- Table 20: Global Nebulizer Devices Volume K Forecast, by Form 2020 & 2033
- Table 21: Global Nebulizer Devices Revenue billion Forecast, by Age Group 2020 & 2033
- Table 22: Global Nebulizer Devices Volume K Forecast, by Age Group 2020 & 2033
- Table 23: Global Nebulizer Devices Revenue billion Forecast, by Power Source 2020 & 2033
- Table 24: Global Nebulizer Devices Volume K Forecast, by Power Source 2020 & 2033
- Table 25: Global Nebulizer Devices Revenue billion Forecast, by Application 2020 & 2033
- Table 26: Global Nebulizer Devices Volume K Forecast, by Application 2020 & 2033
- Table 27: Global Nebulizer Devices Revenue billion Forecast, by Distribution Channel 2020 & 2033
- Table 28: Global Nebulizer Devices Volume K Forecast, by Distribution Channel 2020 & 2033
- Table 29: Global Nebulizer Devices Revenue billion Forecast, by End-User 2020 & 2033
- Table 30: Global Nebulizer Devices Volume K Forecast, by End-User 2020 & 2033
- Table 31: Global Nebulizer Devices Revenue billion Forecast, by Country 2020 & 2033
- Table 32: Global Nebulizer Devices Volume K Forecast, by Country 2020 & 2033
- Table 33: United States Nebulizer Devices Revenue (billion) Forecast, by Application 2020 & 2033
- Table 34: United States Nebulizer Devices Volume (K) Forecast, by Application 2020 & 2033
- Table 35: Canada Nebulizer Devices Revenue (billion) Forecast, by Application 2020 & 2033
- Table 36: Canada Nebulizer Devices Volume (K) Forecast, by Application 2020 & 2033
- Table 37: Mexico Nebulizer Devices Revenue (billion) Forecast, by Application 2020 & 2033
- Table 38: Mexico Nebulizer Devices Volume (K) Forecast, by Application 2020 & 2033
- Table 39: Global Nebulizer Devices Revenue billion Forecast, by Type 2020 & 2033
- Table 40: Global Nebulizer Devices Volume K Forecast, by Type 2020 & 2033
- Table 41: Global Nebulizer Devices Revenue billion Forecast, by Form 2020 & 2033
- Table 42: Global Nebulizer Devices Volume K Forecast, by Form 2020 & 2033
- Table 43: Global Nebulizer Devices Revenue billion Forecast, by Age Group 2020 & 2033
- Table 44: Global Nebulizer Devices Volume K Forecast, by Age Group 2020 & 2033
- Table 45: Global Nebulizer Devices Revenue billion Forecast, by Power Source 2020 & 2033
- Table 46: Global Nebulizer Devices Volume K Forecast, by Power Source 2020 & 2033
- Table 47: Global Nebulizer Devices Revenue billion Forecast, by Application 2020 & 2033
- Table 48: Global Nebulizer Devices Volume K Forecast, by Application 2020 & 2033
- Table 49: Global Nebulizer Devices Revenue billion Forecast, by Distribution Channel 2020 & 2033
- Table 50: Global Nebulizer Devices Volume K Forecast, by Distribution Channel 2020 & 2033
- Table 51: Global Nebulizer Devices Revenue billion Forecast, by End-User 2020 & 2033
- Table 52: Global Nebulizer Devices Volume K Forecast, by End-User 2020 & 2033
- Table 53: Global Nebulizer Devices Revenue billion Forecast, by Country 2020 & 2033
- Table 54: Global Nebulizer Devices Volume K Forecast, by Country 2020 & 2033
- Table 55: Brazil Nebulizer Devices Revenue (billion) Forecast, by Application 2020 & 2033
- Table 56: Brazil Nebulizer Devices Volume (K) Forecast, by Application 2020 & 2033
- Table 57: Argentina Nebulizer Devices Revenue (billion) Forecast, by Application 2020 & 2033
- Table 58: Argentina Nebulizer Devices Volume (K) Forecast, by Application 2020 & 2033
- Table 59: Rest of South America Nebulizer Devices Revenue (billion) Forecast, by Application 2020 & 2033
- Table 60: Rest of South America Nebulizer Devices Volume (K) Forecast, by Application 2020 & 2033
- Table 61: Global Nebulizer Devices Revenue billion Forecast, by Type 2020 & 2033
- Table 62: Global Nebulizer Devices Volume K Forecast, by Type 2020 & 2033
- Table 63: Global Nebulizer Devices Revenue billion Forecast, by Form 2020 & 2033
- Table 64: Global Nebulizer Devices Volume K Forecast, by Form 2020 & 2033
- Table 65: Global Nebulizer Devices Revenue billion Forecast, by Age Group 2020 & 2033
- Table 66: Global Nebulizer Devices Volume K Forecast, by Age Group 2020 & 2033
- Table 67: Global Nebulizer Devices Revenue billion Forecast, by Power Source 2020 & 2033
- Table 68: Global Nebulizer Devices Volume K Forecast, by Power Source 2020 & 2033
- Table 69: Global Nebulizer Devices Revenue billion Forecast, by Application 2020 & 2033
- Table 70: Global Nebulizer Devices Volume K Forecast, by Application 2020 & 2033
- Table 71: Global Nebulizer Devices Revenue billion Forecast, by Distribution Channel 2020 & 2033
- Table 72: Global Nebulizer Devices Volume K Forecast, by Distribution Channel 2020 & 2033
- Table 73: Global Nebulizer Devices Revenue billion Forecast, by End-User 2020 & 2033
- Table 74: Global Nebulizer Devices Volume K Forecast, by End-User 2020 & 2033
- Table 75: Global Nebulizer Devices Revenue billion Forecast, by Country 2020 & 2033
- Table 76: Global Nebulizer Devices Volume K Forecast, by Country 2020 & 2033
- Table 77: United Kingdom Nebulizer Devices Revenue (billion) Forecast, by Application 2020 & 2033
- Table 78: United Kingdom Nebulizer Devices Volume (K) Forecast, by Application 2020 & 2033
- Table 79: Germany Nebulizer Devices Revenue (billion) Forecast, by Application 2020 & 2033
- Table 80: Germany Nebulizer Devices Volume (K) Forecast, by Application 2020 & 2033
- Table 81: France Nebulizer Devices Revenue (billion) Forecast, by Application 2020 & 2033
- Table 82: France Nebulizer Devices Volume (K) Forecast, by Application 2020 & 2033
- Table 83: Italy Nebulizer Devices Revenue (billion) Forecast, by Application 2020 & 2033
- Table 84: Italy Nebulizer Devices Volume (K) Forecast, by Application 2020 & 2033
- Table 85: Spain Nebulizer Devices Revenue (billion) Forecast, by Application 2020 & 2033
- Table 86: Spain Nebulizer Devices Volume (K) Forecast, by Application 2020 & 2033
- Table 87: Russia Nebulizer Devices Revenue (billion) Forecast, by Application 2020 & 2033
- Table 88: Russia Nebulizer Devices Volume (K) Forecast, by Application 2020 & 2033
- Table 89: Benelux Nebulizer Devices Revenue (billion) Forecast, by Application 2020 & 2033
- Table 90: Benelux Nebulizer Devices Volume (K) Forecast, by Application 2020 & 2033
- Table 91: Nordics Nebulizer Devices Revenue (billion) Forecast, by Application 2020 & 2033
- Table 92: Nordics Nebulizer Devices Volume (K) Forecast, by Application 2020 & 2033
- Table 93: Rest of Europe Nebulizer Devices Revenue (billion) Forecast, by Application 2020 & 2033
- Table 94: Rest of Europe Nebulizer Devices Volume (K) Forecast, by Application 2020 & 2033
- Table 95: Global Nebulizer Devices Revenue billion Forecast, by Type 2020 & 2033
- Table 96: Global Nebulizer Devices Volume K Forecast, by Type 2020 & 2033
- Table 97: Global Nebulizer Devices Revenue billion Forecast, by Form 2020 & 2033
- Table 98: Global Nebulizer Devices Volume K Forecast, by Form 2020 & 2033
- Table 99: Global Nebulizer Devices Revenue billion Forecast, by Age Group 2020 & 2033
- Table 100: Global Nebulizer Devices Volume K Forecast, by Age Group 2020 & 2033
- Table 101: Global Nebulizer Devices Revenue billion Forecast, by Power Source 2020 & 2033
- Table 102: Global Nebulizer Devices Volume K Forecast, by Power Source 2020 & 2033
- Table 103: Global Nebulizer Devices Revenue billion Forecast, by Application 2020 & 2033
- Table 104: Global Nebulizer Devices Volume K Forecast, by Application 2020 & 2033
- Table 105: Global Nebulizer Devices Revenue billion Forecast, by Distribution Channel 2020 & 2033
- Table 106: Global Nebulizer Devices Volume K Forecast, by Distribution Channel 2020 & 2033
- Table 107: Global Nebulizer Devices Revenue billion Forecast, by End-User 2020 & 2033
- Table 108: Global Nebulizer Devices Volume K Forecast, by End-User 2020 & 2033
- Table 109: Global Nebulizer Devices Revenue billion Forecast, by Country 2020 & 2033
- Table 110: Global Nebulizer Devices Volume K Forecast, by Country 2020 & 2033
- Table 111: Turkey Nebulizer Devices Revenue (billion) Forecast, by Application 2020 & 2033
- Table 112: Turkey Nebulizer Devices Volume (K) Forecast, by Application 2020 & 2033
- Table 113: Israel Nebulizer Devices Revenue (billion) Forecast, by Application 2020 & 2033
- Table 114: Israel Nebulizer Devices Volume (K) Forecast, by Application 2020 & 2033
- Table 115: GCC Nebulizer Devices Revenue (billion) Forecast, by Application 2020 & 2033
- Table 116: GCC Nebulizer Devices Volume (K) Forecast, by Application 2020 & 2033
- Table 117: North Africa Nebulizer Devices Revenue (billion) Forecast, by Application 2020 & 2033
- Table 118: North Africa Nebulizer Devices Volume (K) Forecast, by Application 2020 & 2033
- Table 119: South Africa Nebulizer Devices Revenue (billion) Forecast, by Application 2020 & 2033
- Table 120: South Africa Nebulizer Devices Volume (K) Forecast, by Application 2020 & 2033
- Table 121: Rest of Middle East & Africa Nebulizer Devices Revenue (billion) Forecast, by Application 2020 & 2033
- Table 122: Rest of Middle East & Africa Nebulizer Devices Volume (K) Forecast, by Application 2020 & 2033
- Table 123: Global Nebulizer Devices Revenue billion Forecast, by Type 2020 & 2033
- Table 124: Global Nebulizer Devices Volume K Forecast, by Type 2020 & 2033
- Table 125: Global Nebulizer Devices Revenue billion Forecast, by Form 2020 & 2033
- Table 126: Global Nebulizer Devices Volume K Forecast, by Form 2020 & 2033
- Table 127: Global Nebulizer Devices Revenue billion Forecast, by Age Group 2020 & 2033
- Table 128: Global Nebulizer Devices Volume K Forecast, by Age Group 2020 & 2033
- Table 129: Global Nebulizer Devices Revenue billion Forecast, by Power Source 2020 & 2033
- Table 130: Global Nebulizer Devices Volume K Forecast, by Power Source 2020 & 2033
- Table 131: Global Nebulizer Devices Revenue billion Forecast, by Application 2020 & 2033
- Table 132: Global Nebulizer Devices Volume K Forecast, by Application 2020 & 2033
- Table 133: Global Nebulizer Devices Revenue billion Forecast, by Distribution Channel 2020 & 2033
- Table 134: Global Nebulizer Devices Volume K Forecast, by Distribution Channel 2020 & 2033
- Table 135: Global Nebulizer Devices Revenue billion Forecast, by End-User 2020 & 2033
- Table 136: Global Nebulizer Devices Volume K Forecast, by End-User 2020 & 2033
- Table 137: Global Nebulizer Devices Revenue billion Forecast, by Country 2020 & 2033
- Table 138: Global Nebulizer Devices Volume K Forecast, by Country 2020 & 2033
- Table 139: China Nebulizer Devices Revenue (billion) Forecast, by Application 2020 & 2033
- Table 140: China Nebulizer Devices Volume (K) Forecast, by Application 2020 & 2033
- Table 141: India Nebulizer Devices Revenue (billion) Forecast, by Application 2020 & 2033
- Table 142: India Nebulizer Devices Volume (K) Forecast, by Application 2020 & 2033
- Table 143: Japan Nebulizer Devices Revenue (billion) Forecast, by Application 2020 & 2033
- Table 144: Japan Nebulizer Devices Volume (K) Forecast, by Application 2020 & 2033
- Table 145: South Korea Nebulizer Devices Revenue (billion) Forecast, by Application 2020 & 2033
- Table 146: South Korea Nebulizer Devices Volume (K) Forecast, by Application 2020 & 2033
- Table 147: ASEAN Nebulizer Devices Revenue (billion) Forecast, by Application 2020 & 2033
- Table 148: ASEAN Nebulizer Devices Volume (K) Forecast, by Application 2020 & 2033
- Table 149: Oceania Nebulizer Devices Revenue (billion) Forecast, by Application 2020 & 2033
- Table 150: Oceania Nebulizer Devices Volume (K) Forecast, by Application 2020 & 2033
- Table 151: Rest of Asia Pacific Nebulizer Devices Revenue (billion) Forecast, by Application 2020 & 2033
- Table 152: Rest of Asia Pacific Nebulizer Devices Volume (K) Forecast, by Application 2020 & 2033
Frequently Asked Questions
1. What is the projected Compound Annual Growth Rate (CAGR) of the Nebulizer Devices?
The projected CAGR is approximately 9.8%.
2. Which companies are prominent players in the Nebulizer Devices?
Key companies in the market include OMRON Healthcare, Inc. , PARI GmbH, Drive Devilbiss International, Aerogen Ltd. , BD, Medline, GE HealthCare, Medtronic, Beurer GmbH, Rossmax International Ltd. , GF Health Products, Inc., BPL Medical Technologies, Microlife Corporation, Others.
3. What are the main segments of the Nebulizer Devices?
The market segments include Type, Form, Age Group, Power Source, Application, Distribution Channel, End-User.
4. Can you provide details about the market size?
The market size is estimated to be USD 1.3 billion as of 2022.
5. What are some drivers contributing to market growth?
N/A
6. What are the notable trends driving market growth?
N/A
7. Are there any restraints impacting market growth?
N/A
8. Can you provide examples of recent developments in the market?
N/A
9. What pricing options are available for accessing the report?
Pricing options include single-user, multi-user, and enterprise licenses priced at USD 3950.00, USD 5925.00, and USD 7900.00 respectively.
10. Is the market size provided in terms of value or volume?
The market size is provided in terms of value, measured in billion and volume, measured in K.
11. Are there any specific market keywords associated with the report?
Yes, the market keyword associated with the report is "Nebulizer Devices," which aids in identifying and referencing the specific market segment covered.
12. How do I determine which pricing option suits my needs best?
The pricing options vary based on user requirements and access needs. Individual users may opt for single-user licenses, while businesses requiring broader access may choose multi-user or enterprise licenses for cost-effective access to the report.
13. Are there any additional resources or data provided in the Nebulizer Devices report?
While the report offers comprehensive insights, it's advisable to review the specific contents or supplementary materials provided to ascertain if additional resources or data are available.
14. How can I stay updated on further developments or reports in the Nebulizer Devices?
To stay informed about further developments, trends, and reports in the Nebulizer Devices, consider subscribing to industry newsletters, following relevant companies and organizations, or regularly checking reputable industry news sources and publications.
Methodology
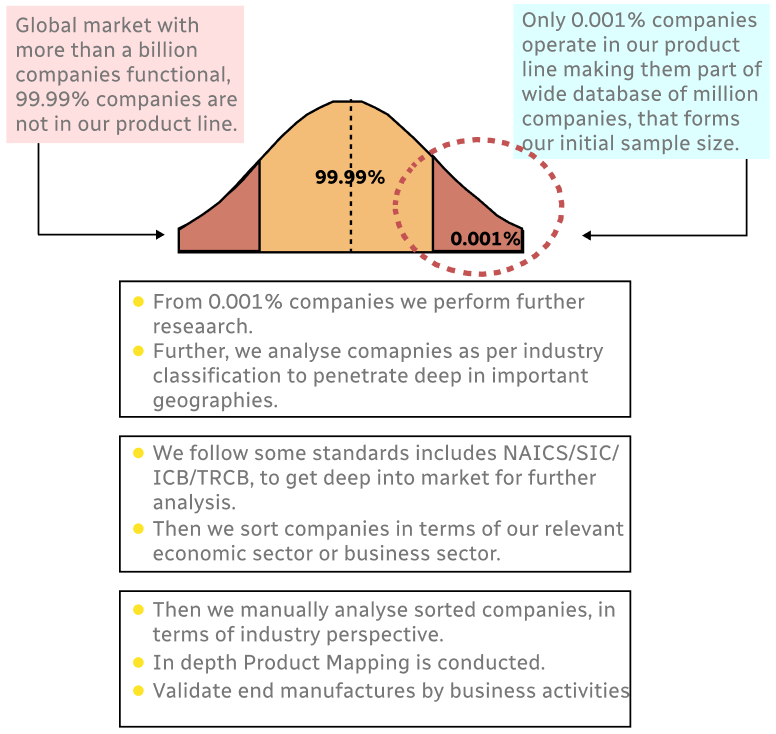
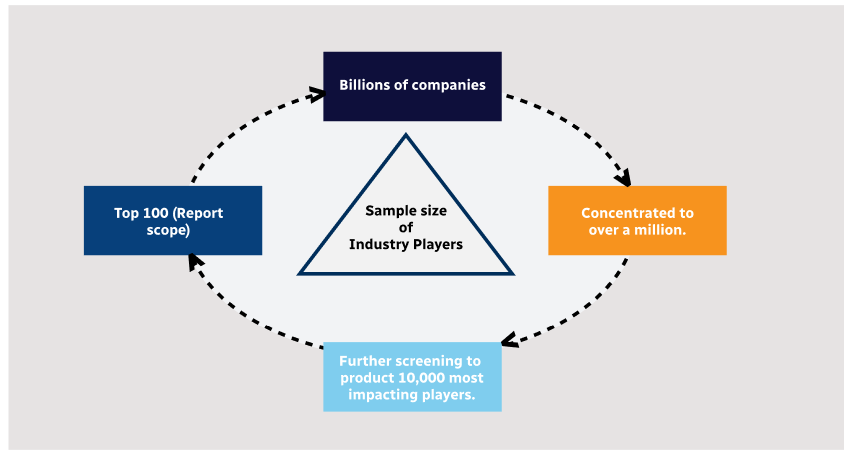
Step 1 - Identification of Relevant Samples Size from Population Database
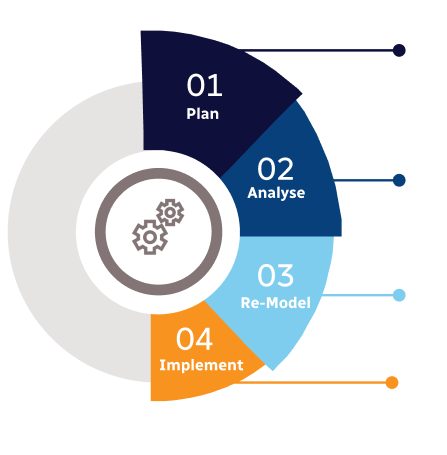
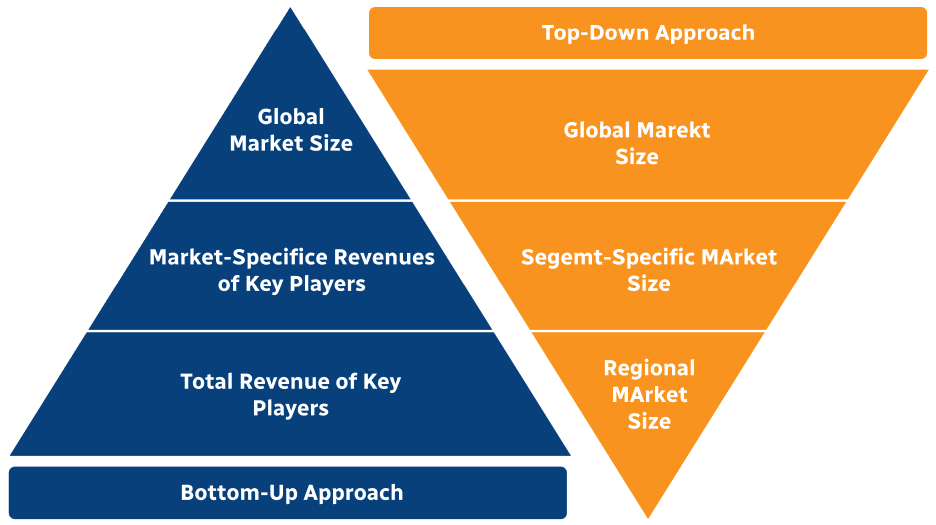
Step 2 - Approaches for Defining Global Market Size (Value, Volume* & Price*)
Note*: In applicable scenarios
Step 3 - Data Sources
Primary Research
- Web Analytics
- Survey Reports
- Research Institute
- Latest Research Reports
- Opinion Leaders
Secondary Research
- Annual Reports
- White Paper
- Latest Press Release
- Industry Association
- Paid Database
- Investor Presentations
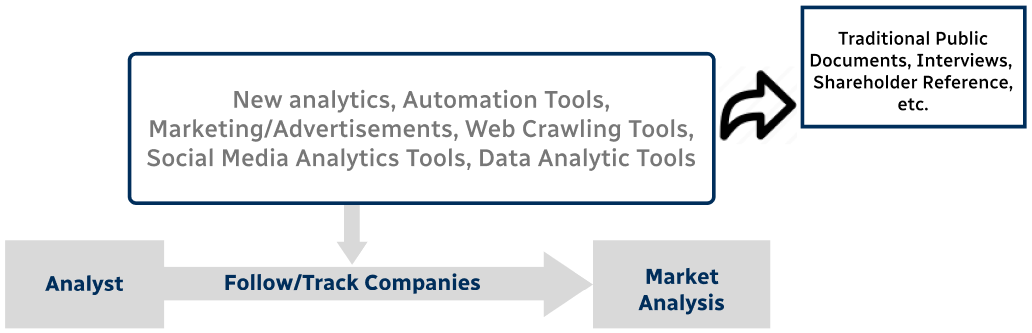
Step 4 - Data Triangulation
Involves using different sources of information in order to increase the validity of a study
These sources are likely to be stakeholders in a program - participants, other researchers, program staff, other community members, and so on.
Then we put all data in single framework & apply various statistical tools to find out the dynamic on the market.
During the analysis stage, feedback from the stakeholder groups would be compared to determine areas of agreement as well as areas of divergence