
Key Insights
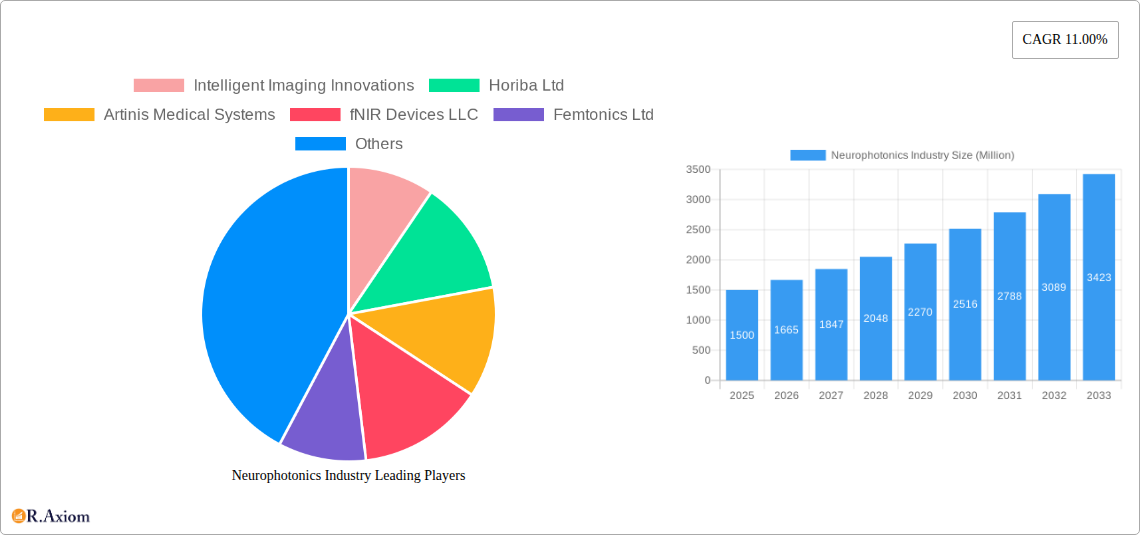
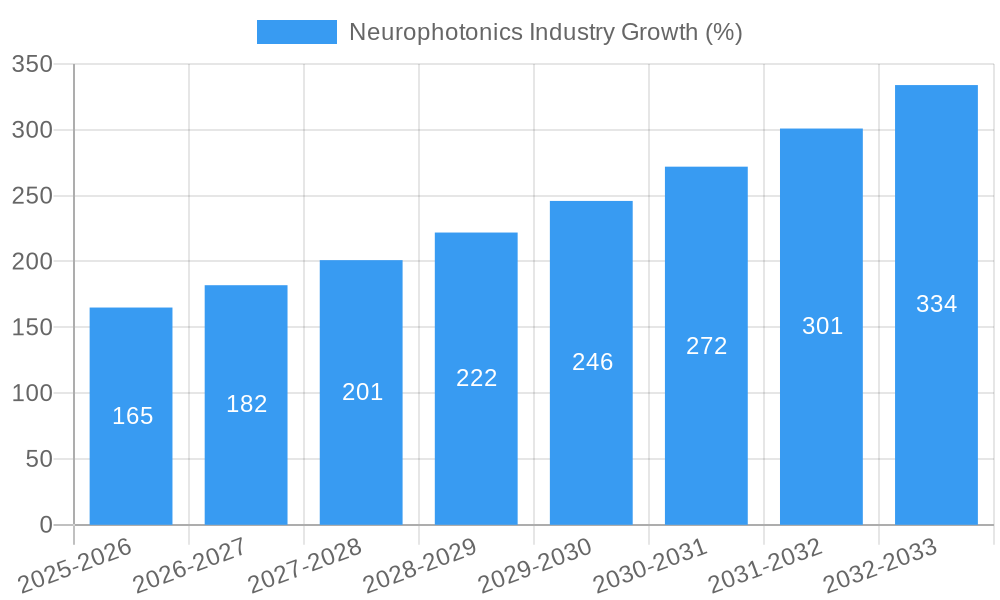
The neurophotonics market, valued at approximately $1.5 billion in 2025, is experiencing robust growth, projected to reach over $4 billion by 2033, exhibiting a compound annual growth rate (CAGR) of 11%. This expansion is driven by several key factors. Firstly, advancements in imaging technologies, particularly microscopy and spectroscopy techniques, are enabling deeper understanding of neural processes and diseases. Multimodal imaging, combining the strengths of different modalities, is further accelerating research and clinical applications. Secondly, the rising prevalence of neurological disorders like Alzheimer's disease, Parkinson's disease, and traumatic brain injury fuels the demand for advanced diagnostic and therapeutic tools. The development of novel therapies targeting specific neural circuits, coupled with improved imaging capabilities for monitoring treatment efficacy, is a significant growth driver. Finally, increasing research funding, both public and private, dedicated to neuroscience research is boosting innovation and commercialization within the neurophotonics sector.
Despite the positive outlook, market growth faces some challenges. The high cost of neurophotonics equipment and the specialized expertise required for operation and interpretation can hinder wider adoption, especially in resource-constrained settings. Furthermore, regulatory hurdles associated with the approval of novel neurophotonics-based therapies may slow down market penetration. However, ongoing efforts to miniaturize and simplify neurophotonics devices, along with the development of user-friendly software and analysis tools, are mitigating some of these challenges. The market segmentation, with research applications currently dominating, is likely to see a gradual shift toward diagnostic and therapeutic applications as technologies mature and regulatory pathways are streamlined. Key players like Intelligent Imaging Innovations, Horiba Ltd., and Carl Zeiss AG are leading the innovation drive, with strategic collaborations and acquisitions further shaping the competitive landscape.
Neurophotonics Industry Market Report: 2019-2033
This comprehensive report provides an in-depth analysis of the Neurophotonics industry, covering market size, growth projections, leading players, technological advancements, and future opportunities. The study period spans from 2019 to 2033, with a base year of 2025 and a forecast period from 2025 to 2033. The report utilizes data from the historical period of 2019-2024 to project future market trends. This detailed analysis is crucial for stakeholders including investors, researchers, industry professionals, and businesses operating in or considering entry into the Neurophotonics sector. The global Neurophotonics market is estimated to reach xx Million by 2033, exhibiting a CAGR of xx% during the forecast period.
Neurophotonics Industry Market Concentration & Innovation
The Neurophotonics market is characterized by a moderate level of concentration, with several key players holding significant market share. Intelligent Imaging Innovations, Horiba Ltd, Artinis Medical Systems, and others have established strong positions. However, the market also features numerous smaller companies and startups driving innovation. The market share of the top 5 companies is estimated at xx% in 2025. Innovation is driven by advancements in optical imaging techniques, miniaturization of devices, and the development of novel contrast agents. Regulatory frameworks, such as those governing medical device approvals, significantly impact market growth. The prevalence of substitute technologies, primarily in specific applications, presents a challenge, but the unique capabilities of neurophotonics continue to drive adoption. End-user trends, particularly in research and diagnostics, are critical in shaping market demands. M&A activity has been moderate, with deal values ranging from xx Million to xx Million in recent years, reflecting consolidation and strategic partnerships within the industry.
- Market Share (2025): Top 5 companies - xx%
- M&A Deal Values (Recent Years): xx Million - xx Million
- Key Innovation Drivers: Advancements in optical imaging, miniaturization, novel contrast agents
Neurophotonics Industry Industry Trends & Insights
The Neurophotonics market is experiencing robust growth, fueled by several key trends. The increasing prevalence of neurological disorders globally is driving demand for advanced diagnostic and therapeutic tools. Technological advancements, such as the development of more sensitive and versatile imaging systems, are enhancing the capabilities of neurophotonics. Consumer preferences are shifting towards minimally invasive and non-invasive techniques, making neurophotonics increasingly attractive. The competitive landscape is dynamic, with ongoing innovation and product development. The market is witnessing a strong push towards multimodal systems that combine different imaging modalities for a more comprehensive understanding of the nervous system. Market penetration of neurophotonics technologies in clinical settings remains relatively low but is expected to increase significantly over the next decade. The Compound Annual Growth Rate (CAGR) is projected to be xx% during the forecast period (2025-2033), primarily driven by increased research funding and the development of new clinical applications.
Dominant Markets & Segments in Neurophotonics Industry
The North American region currently dominates the Neurophotonics market due to high research funding, advanced healthcare infrastructure, and the presence of major industry players. Within the system types, Microscopy and Spectroscopy segments are currently leading, while the Multimodal segment demonstrates high growth potential. In terms of applications, the Research segment accounts for a significant portion of the market, with the Diagnostics segment expected to witness substantial growth in the coming years.
- Leading Region: North America
- Dominant System Type: Microscopy, Spectroscopy
- Fastest-Growing Segment: Multimodal
- Key Application Driver (Diagnostics): Growing prevalence of neurological disorders, demand for advanced diagnostic tools.
- Key Drivers (North America): High research funding, advanced healthcare infrastructure, strong regulatory support
Neurophotonics Industry Product Developments
Recent product innovations include high-resolution microscopy systems, compact spectroscopy devices, and integrated multimodal imaging platforms. These advancements offer improved sensitivity, speed, and image quality, expanding the range of applications in research, diagnostics, and therapeutics. The integration of artificial intelligence (AI) and machine learning algorithms is enhancing data analysis and image interpretation, ultimately improving the accuracy and efficiency of neurophotonics-based tools. These developments are driving market penetration by offering improved diagnostic capabilities and more effective therapeutic interventions.
Report Scope & Segmentation Analysis
This report comprehensively segments the Neurophotonics market by system type (Microscopy, Spectroscopy, Multimodal, Other) and application (Research, Diagnostics, Therapeutics). Each segment is analyzed in detail, providing market size, growth projections, and competitive dynamics. The Microscopy segment offers high resolution, while Spectroscopy provides functional information, and Multimodal systems combine both. The “Other” category encompasses emerging technologies and niche applications. The Research segment is currently the largest due to extensive use in neuroscientific studies, while Diagnostics and Therapeutics segments exhibit significant growth potential with increasing clinical applications.
Key Drivers of Neurophotonics Industry Growth
The growth of the Neurophotonics industry is propelled by several key factors. These include increasing prevalence of neurological disorders, substantial investments in research and development, ongoing technological advancements resulting in improved imaging techniques and instrumentation, supportive regulatory environments encouraging innovation, and a rising demand for minimally invasive diagnostic and therapeutic procedures. The development of sophisticated AI-driven analytical tools also contributes to enhanced capabilities and widespread adoption.
Challenges in the Neurophotonics Industry Sector
The Neurophotonics industry faces challenges including the high cost of equipment and procedures which limits accessibility, the complexity of data analysis which necessitates specialized expertise, the need for stringent regulatory approvals which introduces delays and complexity, potential limitations in terms of tissue penetration depth and image resolution for certain modalities, and competition from alternative neuroimaging technologies which require competitive pricing and superior performance.
Emerging Opportunities in Neurophotonics Industry
Emerging opportunities lie in the development of next-generation multimodal systems integrating advanced imaging techniques, the integration of artificial intelligence and machine learning for advanced data analysis, the expansion into new therapeutic applications, and the development of novel contrast agents enhancing image quality and specificity. The adoption of neurophotonics technologies in personalized medicine and the exploration of new clinical applications in emerging markets also represent significant growth avenues.
Leading Players in the Neurophotonics Industry Market
- Intelligent Imaging Innovations
- Horiba Ltd
- Artinis Medical Systems
- fNIR Devices LLC
- Femtonics Ltd
- Cairn Research
- Hitachi Ltd
- Carl Zeiss AG
- Leica Microsystems
- HemoPhotonics
Key Developments in Neurophotonics Industry Industry
- 2022 Q4: Launch of a new high-resolution microscopy system by Intelligent Imaging Innovations.
- 2023 Q1: Horiba Ltd announces a strategic partnership to develop advanced spectroscopy technologies.
- 2023 Q3: Artinis Medical Systems secures FDA approval for a new diagnostic device. (Further details on other key developments would be included in the full report.)
Strategic Outlook for Neurophotonics Industry Market
The Neurophotonics market is poised for significant growth in the coming years, driven by technological advancements, increasing prevalence of neurological disorders, and expanding applications in research, diagnostics, and therapeutics. The integration of AI and multimodal imaging will enhance diagnostic capabilities and lead to the development of more personalized treatment strategies. Expanding into new markets and exploring novel clinical applications will further contribute to market growth and create lucrative opportunities for industry players.
Neurophotonics Industry Segmentation
-
1. System Type
- 1.1. Microscopy
- 1.2. Spectroscopy
- 1.3. Multimodal
- 1.4. Other System Type
-
2. Application
- 2.1. Research
- 2.2. Diagnostics
- 2.3. Therapeutics
Neurophotonics Industry Segmentation By Geography
- 1. North America
- 2. Europe
- 3. Asia Pacific
- 4. Rest of World
Neurophotonics Industry REPORT HIGHLIGHTS
| Aspects | Details |
|---|---|
| Study Period | 2019-2033 |
| Base Year | 2024 |
| Estimated Year | 2025 |
| Forecast Period | 2025-2033 |
| Historical Period | 2019-2024 |
| Growth Rate | CAGR of 11.00% from 2019-2033 |
| Segmentation |
|
Table of Contents
- 1. Introduction
- 1.1. Research Scope
- 1.2. Market Segmentation
- 1.3. Research Methodology
- 1.4. Definitions and Assumptions
- 2. Executive Summary
- 2.1. Introduction
- 3. Market Dynamics
- 3.1. Introduction
- 3.2. Market Drivers
- 3.2.1. ; Increasing Government Initiative for Research and Development; Technological Advancement in Pain Detection Technology
- 3.3. Market Restrains
- 3.3.1. ; Accessing the Human Brain in Live Individuals is Difficult
- 3.4. Market Trends
- 3.4.1. Increasing Research Activities Offers Potential Growth
- 4. Market Factor Analysis
- 4.1. Porters Five Forces
- 4.2. Supply/Value Chain
- 4.3. PESTEL analysis
- 4.4. Market Entropy
- 4.5. Patent/Trademark Analysis
- 5. Global Neurophotonics Industry Analysis, Insights and Forecast, 2019-2031
- 5.1. Market Analysis, Insights and Forecast - by System Type
- 5.1.1. Microscopy
- 5.1.2. Spectroscopy
- 5.1.3. Multimodal
- 5.1.4. Other System Type
- 5.2. Market Analysis, Insights and Forecast - by Application
- 5.2.1. Research
- 5.2.2. Diagnostics
- 5.2.3. Therapeutics
- 5.3. Market Analysis, Insights and Forecast - by Region
- 5.3.1. North America
- 5.3.2. Europe
- 5.3.3. Asia Pacific
- 5.3.4. Rest of World
- 5.1. Market Analysis, Insights and Forecast - by System Type
- 6. North America Neurophotonics Industry Analysis, Insights and Forecast, 2019-2031
- 6.1. Market Analysis, Insights and Forecast - by System Type
- 6.1.1. Microscopy
- 6.1.2. Spectroscopy
- 6.1.3. Multimodal
- 6.1.4. Other System Type
- 6.2. Market Analysis, Insights and Forecast - by Application
- 6.2.1. Research
- 6.2.2. Diagnostics
- 6.2.3. Therapeutics
- 6.1. Market Analysis, Insights and Forecast - by System Type
- 7. Europe Neurophotonics Industry Analysis, Insights and Forecast, 2019-2031
- 7.1. Market Analysis, Insights and Forecast - by System Type
- 7.1.1. Microscopy
- 7.1.2. Spectroscopy
- 7.1.3. Multimodal
- 7.1.4. Other System Type
- 7.2. Market Analysis, Insights and Forecast - by Application
- 7.2.1. Research
- 7.2.2. Diagnostics
- 7.2.3. Therapeutics
- 7.1. Market Analysis, Insights and Forecast - by System Type
- 8. Asia Pacific Neurophotonics Industry Analysis, Insights and Forecast, 2019-2031
- 8.1. Market Analysis, Insights and Forecast - by System Type
- 8.1.1. Microscopy
- 8.1.2. Spectroscopy
- 8.1.3. Multimodal
- 8.1.4. Other System Type
- 8.2. Market Analysis, Insights and Forecast - by Application
- 8.2.1. Research
- 8.2.2. Diagnostics
- 8.2.3. Therapeutics
- 8.1. Market Analysis, Insights and Forecast - by System Type
- 9. Rest of World Neurophotonics Industry Analysis, Insights and Forecast, 2019-2031
- 9.1. Market Analysis, Insights and Forecast - by System Type
- 9.1.1. Microscopy
- 9.1.2. Spectroscopy
- 9.1.3. Multimodal
- 9.1.4. Other System Type
- 9.2. Market Analysis, Insights and Forecast - by Application
- 9.2.1. Research
- 9.2.2. Diagnostics
- 9.2.3. Therapeutics
- 9.1. Market Analysis, Insights and Forecast - by System Type
- 10. North America Neurophotonics Industry Analysis, Insights and Forecast, 2019-2031
- 10.1. Market Analysis, Insights and Forecast - By Country/Sub-region
- 10.1.1. undefined
- 11. Europe Neurophotonics Industry Analysis, Insights and Forecast, 2019-2031
- 11.1. Market Analysis, Insights and Forecast - By Country/Sub-region
- 11.1.1. undefined
- 12. Asia Pacific Neurophotonics Industry Analysis, Insights and Forecast, 2019-2031
- 12.1. Market Analysis, Insights and Forecast - By Country/Sub-region
- 12.1.1. undefined
- 13. South America Neurophotonics Industry Analysis, Insights and Forecast, 2019-2031
- 13.1. Market Analysis, Insights and Forecast - By Country/Sub-region
- 13.1.1. undefined
- 14. North America Neurophotonics Industry Analysis, Insights and Forecast, 2019-2031
- 14.1. Market Analysis, Insights and Forecast - By Country/Sub-region
- 14.1.1. undefined
- 15. MEA Neurophotonics Industry Analysis, Insights and Forecast, 2019-2031
- 15.1. Market Analysis, Insights and Forecast - By Country/Sub-region
- 15.1.1. undefined
- 16. Competitive Analysis
- 16.1. Global Market Share Analysis 2024
- 16.2. Company Profiles
- 16.2.1 Intelligent Imaging Innovations
- 16.2.1.1. Overview
- 16.2.1.2. Products
- 16.2.1.3. SWOT Analysis
- 16.2.1.4. Recent Developments
- 16.2.1.5. Financials (Based on Availability)
- 16.2.2 Horiba Ltd
- 16.2.2.1. Overview
- 16.2.2.2. Products
- 16.2.2.3. SWOT Analysis
- 16.2.2.4. Recent Developments
- 16.2.2.5. Financials (Based on Availability)
- 16.2.3 Artinis Medical Systems
- 16.2.3.1. Overview
- 16.2.3.2. Products
- 16.2.3.3. SWOT Analysis
- 16.2.3.4. Recent Developments
- 16.2.3.5. Financials (Based on Availability)
- 16.2.4 fNIR Devices LLC
- 16.2.4.1. Overview
- 16.2.4.2. Products
- 16.2.4.3. SWOT Analysis
- 16.2.4.4. Recent Developments
- 16.2.4.5. Financials (Based on Availability)
- 16.2.5 Femtonics Ltd
- 16.2.5.1. Overview
- 16.2.5.2. Products
- 16.2.5.3. SWOT Analysis
- 16.2.5.4. Recent Developments
- 16.2.5.5. Financials (Based on Availability)
- 16.2.6 Cairn Research
- 16.2.6.1. Overview
- 16.2.6.2. Products
- 16.2.6.3. SWOT Analysis
- 16.2.6.4. Recent Developments
- 16.2.6.5. Financials (Based on Availability)
- 16.2.7 Hitachi Ltd
- 16.2.7.1. Overview
- 16.2.7.2. Products
- 16.2.7.3. SWOT Analysis
- 16.2.7.4. Recent Developments
- 16.2.7.5. Financials (Based on Availability)
- 16.2.8 Carl Zeiss AG
- 16.2.8.1. Overview
- 16.2.8.2. Products
- 16.2.8.3. SWOT Analysis
- 16.2.8.4. Recent Developments
- 16.2.8.5. Financials (Based on Availability)
- 16.2.9 Leica Microsystems
- 16.2.9.1. Overview
- 16.2.9.2. Products
- 16.2.9.3. SWOT Analysis
- 16.2.9.4. Recent Developments
- 16.2.9.5. Financials (Based on Availability)
- 16.2.10 HemoPhotonics
- 16.2.10.1. Overview
- 16.2.10.2. Products
- 16.2.10.3. SWOT Analysis
- 16.2.10.4. Recent Developments
- 16.2.10.5. Financials (Based on Availability)
- 16.2.1 Intelligent Imaging Innovations
List of Figures
- Figure 1: Global Neurophotonics Industry Revenue Breakdown (Million, %) by Region 2024 & 2032
- Figure 2: Global Neurophotonics Industry Volume Breakdown (K Unit, %) by Region 2024 & 2032
- Figure 3: North America Neurophotonics Industry Revenue (Million), by Country 2024 & 2032
- Figure 4: North America Neurophotonics Industry Volume (K Unit), by Country 2024 & 2032
- Figure 5: North America Neurophotonics Industry Revenue Share (%), by Country 2024 & 2032
- Figure 6: North America Neurophotonics Industry Volume Share (%), by Country 2024 & 2032
- Figure 7: Europe Neurophotonics Industry Revenue (Million), by Country 2024 & 2032
- Figure 8: Europe Neurophotonics Industry Volume (K Unit), by Country 2024 & 2032
- Figure 9: Europe Neurophotonics Industry Revenue Share (%), by Country 2024 & 2032
- Figure 10: Europe Neurophotonics Industry Volume Share (%), by Country 2024 & 2032
- Figure 11: Asia Pacific Neurophotonics Industry Revenue (Million), by Country 2024 & 2032
- Figure 12: Asia Pacific Neurophotonics Industry Volume (K Unit), by Country 2024 & 2032
- Figure 13: Asia Pacific Neurophotonics Industry Revenue Share (%), by Country 2024 & 2032
- Figure 14: Asia Pacific Neurophotonics Industry Volume Share (%), by Country 2024 & 2032
- Figure 15: South America Neurophotonics Industry Revenue (Million), by Country 2024 & 2032
- Figure 16: South America Neurophotonics Industry Volume (K Unit), by Country 2024 & 2032
- Figure 17: South America Neurophotonics Industry Revenue Share (%), by Country 2024 & 2032
- Figure 18: South America Neurophotonics Industry Volume Share (%), by Country 2024 & 2032
- Figure 19: North America Neurophotonics Industry Revenue (Million), by Country 2024 & 2032
- Figure 20: North America Neurophotonics Industry Volume (K Unit), by Country 2024 & 2032
- Figure 21: North America Neurophotonics Industry Revenue Share (%), by Country 2024 & 2032
- Figure 22: North America Neurophotonics Industry Volume Share (%), by Country 2024 & 2032
- Figure 23: MEA Neurophotonics Industry Revenue (Million), by Country 2024 & 2032
- Figure 24: MEA Neurophotonics Industry Volume (K Unit), by Country 2024 & 2032
- Figure 25: MEA Neurophotonics Industry Revenue Share (%), by Country 2024 & 2032
- Figure 26: MEA Neurophotonics Industry Volume Share (%), by Country 2024 & 2032
- Figure 27: North America Neurophotonics Industry Revenue (Million), by System Type 2024 & 2032
- Figure 28: North America Neurophotonics Industry Volume (K Unit), by System Type 2024 & 2032
- Figure 29: North America Neurophotonics Industry Revenue Share (%), by System Type 2024 & 2032
- Figure 30: North America Neurophotonics Industry Volume Share (%), by System Type 2024 & 2032
- Figure 31: North America Neurophotonics Industry Revenue (Million), by Application 2024 & 2032
- Figure 32: North America Neurophotonics Industry Volume (K Unit), by Application 2024 & 2032
- Figure 33: North America Neurophotonics Industry Revenue Share (%), by Application 2024 & 2032
- Figure 34: North America Neurophotonics Industry Volume Share (%), by Application 2024 & 2032
- Figure 35: North America Neurophotonics Industry Revenue (Million), by Country 2024 & 2032
- Figure 36: North America Neurophotonics Industry Volume (K Unit), by Country 2024 & 2032
- Figure 37: North America Neurophotonics Industry Revenue Share (%), by Country 2024 & 2032
- Figure 38: North America Neurophotonics Industry Volume Share (%), by Country 2024 & 2032
- Figure 39: Europe Neurophotonics Industry Revenue (Million), by System Type 2024 & 2032
- Figure 40: Europe Neurophotonics Industry Volume (K Unit), by System Type 2024 & 2032
- Figure 41: Europe Neurophotonics Industry Revenue Share (%), by System Type 2024 & 2032
- Figure 42: Europe Neurophotonics Industry Volume Share (%), by System Type 2024 & 2032
- Figure 43: Europe Neurophotonics Industry Revenue (Million), by Application 2024 & 2032
- Figure 44: Europe Neurophotonics Industry Volume (K Unit), by Application 2024 & 2032
- Figure 45: Europe Neurophotonics Industry Revenue Share (%), by Application 2024 & 2032
- Figure 46: Europe Neurophotonics Industry Volume Share (%), by Application 2024 & 2032
- Figure 47: Europe Neurophotonics Industry Revenue (Million), by Country 2024 & 2032
- Figure 48: Europe Neurophotonics Industry Volume (K Unit), by Country 2024 & 2032
- Figure 49: Europe Neurophotonics Industry Revenue Share (%), by Country 2024 & 2032
- Figure 50: Europe Neurophotonics Industry Volume Share (%), by Country 2024 & 2032
- Figure 51: Asia Pacific Neurophotonics Industry Revenue (Million), by System Type 2024 & 2032
- Figure 52: Asia Pacific Neurophotonics Industry Volume (K Unit), by System Type 2024 & 2032
- Figure 53: Asia Pacific Neurophotonics Industry Revenue Share (%), by System Type 2024 & 2032
- Figure 54: Asia Pacific Neurophotonics Industry Volume Share (%), by System Type 2024 & 2032
- Figure 55: Asia Pacific Neurophotonics Industry Revenue (Million), by Application 2024 & 2032
- Figure 56: Asia Pacific Neurophotonics Industry Volume (K Unit), by Application 2024 & 2032
- Figure 57: Asia Pacific Neurophotonics Industry Revenue Share (%), by Application 2024 & 2032
- Figure 58: Asia Pacific Neurophotonics Industry Volume Share (%), by Application 2024 & 2032
- Figure 59: Asia Pacific Neurophotonics Industry Revenue (Million), by Country 2024 & 2032
- Figure 60: Asia Pacific Neurophotonics Industry Volume (K Unit), by Country 2024 & 2032
- Figure 61: Asia Pacific Neurophotonics Industry Revenue Share (%), by Country 2024 & 2032
- Figure 62: Asia Pacific Neurophotonics Industry Volume Share (%), by Country 2024 & 2032
- Figure 63: Rest of World Neurophotonics Industry Revenue (Million), by System Type 2024 & 2032
- Figure 64: Rest of World Neurophotonics Industry Volume (K Unit), by System Type 2024 & 2032
- Figure 65: Rest of World Neurophotonics Industry Revenue Share (%), by System Type 2024 & 2032
- Figure 66: Rest of World Neurophotonics Industry Volume Share (%), by System Type 2024 & 2032
- Figure 67: Rest of World Neurophotonics Industry Revenue (Million), by Application 2024 & 2032
- Figure 68: Rest of World Neurophotonics Industry Volume (K Unit), by Application 2024 & 2032
- Figure 69: Rest of World Neurophotonics Industry Revenue Share (%), by Application 2024 & 2032
- Figure 70: Rest of World Neurophotonics Industry Volume Share (%), by Application 2024 & 2032
- Figure 71: Rest of World Neurophotonics Industry Revenue (Million), by Country 2024 & 2032
- Figure 72: Rest of World Neurophotonics Industry Volume (K Unit), by Country 2024 & 2032
- Figure 73: Rest of World Neurophotonics Industry Revenue Share (%), by Country 2024 & 2032
- Figure 74: Rest of World Neurophotonics Industry Volume Share (%), by Country 2024 & 2032
List of Tables
- Table 1: Global Neurophotonics Industry Revenue Million Forecast, by Region 2019 & 2032
- Table 2: Global Neurophotonics Industry Volume K Unit Forecast, by Region 2019 & 2032
- Table 3: Global Neurophotonics Industry Revenue Million Forecast, by System Type 2019 & 2032
- Table 4: Global Neurophotonics Industry Volume K Unit Forecast, by System Type 2019 & 2032
- Table 5: Global Neurophotonics Industry Revenue Million Forecast, by Application 2019 & 2032
- Table 6: Global Neurophotonics Industry Volume K Unit Forecast, by Application 2019 & 2032
- Table 7: Global Neurophotonics Industry Revenue Million Forecast, by Region 2019 & 2032
- Table 8: Global Neurophotonics Industry Volume K Unit Forecast, by Region 2019 & 2032
- Table 9: Global Neurophotonics Industry Revenue Million Forecast, by Country 2019 & 2032
- Table 10: Global Neurophotonics Industry Volume K Unit Forecast, by Country 2019 & 2032
- Table 11: Global Neurophotonics Industry Revenue Million Forecast, by Country 2019 & 2032
- Table 12: Global Neurophotonics Industry Volume K Unit Forecast, by Country 2019 & 2032
- Table 13: Global Neurophotonics Industry Revenue Million Forecast, by Country 2019 & 2032
- Table 14: Global Neurophotonics Industry Volume K Unit Forecast, by Country 2019 & 2032
- Table 15: Global Neurophotonics Industry Revenue Million Forecast, by Country 2019 & 2032
- Table 16: Global Neurophotonics Industry Volume K Unit Forecast, by Country 2019 & 2032
- Table 17: Global Neurophotonics Industry Revenue Million Forecast, by Country 2019 & 2032
- Table 18: Global Neurophotonics Industry Volume K Unit Forecast, by Country 2019 & 2032
- Table 19: Global Neurophotonics Industry Revenue Million Forecast, by Country 2019 & 2032
- Table 20: Global Neurophotonics Industry Volume K Unit Forecast, by Country 2019 & 2032
- Table 21: Global Neurophotonics Industry Revenue Million Forecast, by System Type 2019 & 2032
- Table 22: Global Neurophotonics Industry Volume K Unit Forecast, by System Type 2019 & 2032
- Table 23: Global Neurophotonics Industry Revenue Million Forecast, by Application 2019 & 2032
- Table 24: Global Neurophotonics Industry Volume K Unit Forecast, by Application 2019 & 2032
- Table 25: Global Neurophotonics Industry Revenue Million Forecast, by Country 2019 & 2032
- Table 26: Global Neurophotonics Industry Volume K Unit Forecast, by Country 2019 & 2032
- Table 27: Global Neurophotonics Industry Revenue Million Forecast, by System Type 2019 & 2032
- Table 28: Global Neurophotonics Industry Volume K Unit Forecast, by System Type 2019 & 2032
- Table 29: Global Neurophotonics Industry Revenue Million Forecast, by Application 2019 & 2032
- Table 30: Global Neurophotonics Industry Volume K Unit Forecast, by Application 2019 & 2032
- Table 31: Global Neurophotonics Industry Revenue Million Forecast, by Country 2019 & 2032
- Table 32: Global Neurophotonics Industry Volume K Unit Forecast, by Country 2019 & 2032
- Table 33: Global Neurophotonics Industry Revenue Million Forecast, by System Type 2019 & 2032
- Table 34: Global Neurophotonics Industry Volume K Unit Forecast, by System Type 2019 & 2032
- Table 35: Global Neurophotonics Industry Revenue Million Forecast, by Application 2019 & 2032
- Table 36: Global Neurophotonics Industry Volume K Unit Forecast, by Application 2019 & 2032
- Table 37: Global Neurophotonics Industry Revenue Million Forecast, by Country 2019 & 2032
- Table 38: Global Neurophotonics Industry Volume K Unit Forecast, by Country 2019 & 2032
- Table 39: Global Neurophotonics Industry Revenue Million Forecast, by System Type 2019 & 2032
- Table 40: Global Neurophotonics Industry Volume K Unit Forecast, by System Type 2019 & 2032
- Table 41: Global Neurophotonics Industry Revenue Million Forecast, by Application 2019 & 2032
- Table 42: Global Neurophotonics Industry Volume K Unit Forecast, by Application 2019 & 2032
- Table 43: Global Neurophotonics Industry Revenue Million Forecast, by Country 2019 & 2032
- Table 44: Global Neurophotonics Industry Volume K Unit Forecast, by Country 2019 & 2032
Frequently Asked Questions
1. What is the projected Compound Annual Growth Rate (CAGR) of the Neurophotonics Industry?
The projected CAGR is approximately 11.00%.
2. Which companies are prominent players in the Neurophotonics Industry?
Key companies in the market include Intelligent Imaging Innovations, Horiba Ltd, Artinis Medical Systems, fNIR Devices LLC, Femtonics Ltd, Cairn Research, Hitachi Ltd , Carl Zeiss AG, Leica Microsystems, HemoPhotonics.
3. What are the main segments of the Neurophotonics Industry?
The market segments include System Type, Application.
4. Can you provide details about the market size?
The market size is estimated to be USD XX Million as of 2022.
5. What are some drivers contributing to market growth?
; Increasing Government Initiative for Research and Development; Technological Advancement in Pain Detection Technology.
6. What are the notable trends driving market growth?
Increasing Research Activities Offers Potential Growth.
7. Are there any restraints impacting market growth?
; Accessing the Human Brain in Live Individuals is Difficult.
8. Can you provide examples of recent developments in the market?
N/A
9. What pricing options are available for accessing the report?
Pricing options include single-user, multi-user, and enterprise licenses priced at USD 4750, USD 5250, and USD 8750 respectively.
10. Is the market size provided in terms of value or volume?
The market size is provided in terms of value, measured in Million and volume, measured in K Unit.
11. Are there any specific market keywords associated with the report?
Yes, the market keyword associated with the report is "Neurophotonics Industry," which aids in identifying and referencing the specific market segment covered.
12. How do I determine which pricing option suits my needs best?
The pricing options vary based on user requirements and access needs. Individual users may opt for single-user licenses, while businesses requiring broader access may choose multi-user or enterprise licenses for cost-effective access to the report.
13. Are there any additional resources or data provided in the Neurophotonics Industry report?
While the report offers comprehensive insights, it's advisable to review the specific contents or supplementary materials provided to ascertain if additional resources or data are available.
14. How can I stay updated on further developments or reports in the Neurophotonics Industry?
To stay informed about further developments, trends, and reports in the Neurophotonics Industry, consider subscribing to industry newsletters, following relevant companies and organizations, or regularly checking reputable industry news sources and publications.
Methodology
Step 1 - Identification of Relevant Samples Size from Population Database


Step 2 - Approaches for Defining Global Market Size (Value, Volume* & Price*)

Note*: In applicable scenarios
Step 3 - Data Sources
Primary Research
- Web Analytics
- Survey Reports
- Research Institute
- Latest Research Reports
- Opinion Leaders
Secondary Research
- Annual Reports
- White Paper
- Latest Press Release
- Industry Association
- Paid Database
- Investor Presentations

Step 4 - Data Triangulation
Involves using different sources of information in order to increase the validity of a study
These sources are likely to be stakeholders in a program - participants, other researchers, program staff, other community members, and so on.
Then we put all data in single framework & apply various statistical tools to find out the dynamic on the market.
During the analysis stage, feedback from the stakeholder groups would be compared to determine areas of agreement as well as areas of divergence


