
Key Insights
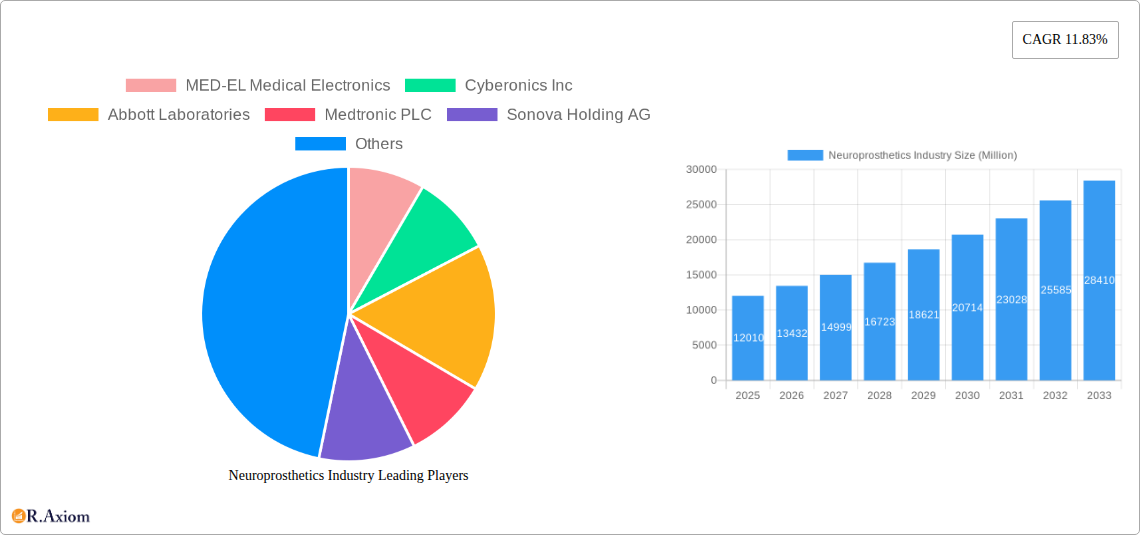
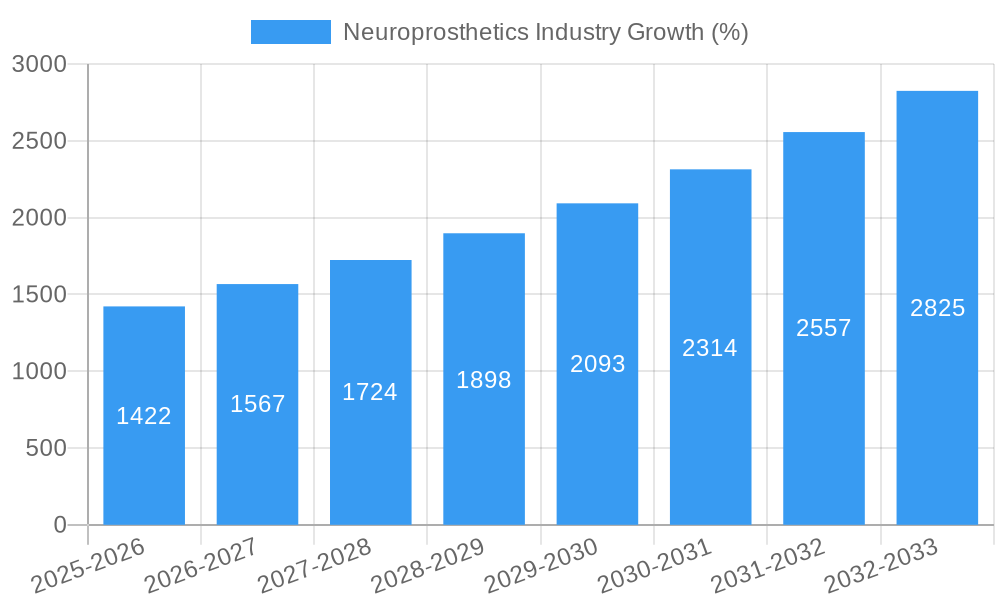
The global neuroprosthetics market, valued at $12.01 billion in 2025, is projected to experience robust growth, driven by a compound annual growth rate (CAGR) of 11.83% from 2025 to 2033. This expansion is fueled by several key factors. The increasing prevalence of neurological disorders like Parkinson's disease, Alzheimer's disease, and epilepsy is a significant driver, creating a substantial demand for effective treatment options. Advancements in neurosurgical techniques, such as deep brain stimulation and spinal cord stimulation, coupled with technological innovations in neural interface design, are enhancing the efficacy and safety of neuroprosthetics, further stimulating market growth. Moreover, rising investments in research and development by both public and private entities are accelerating the introduction of novel neuroprosthetics with improved functionalities and reduced side effects. The market is segmented by type (input and output neural prosthetics), technique (spinal cord stimulation, deep brain stimulation, vagus nerve stimulation, and others), and application (Parkinson's disease, Alzheimer's disease, epilepsy, auditory processing disorders, ophthalmic disorders, and others). Each segment presents unique growth opportunities, with deep brain stimulation and Parkinson's disease applications currently leading the market.
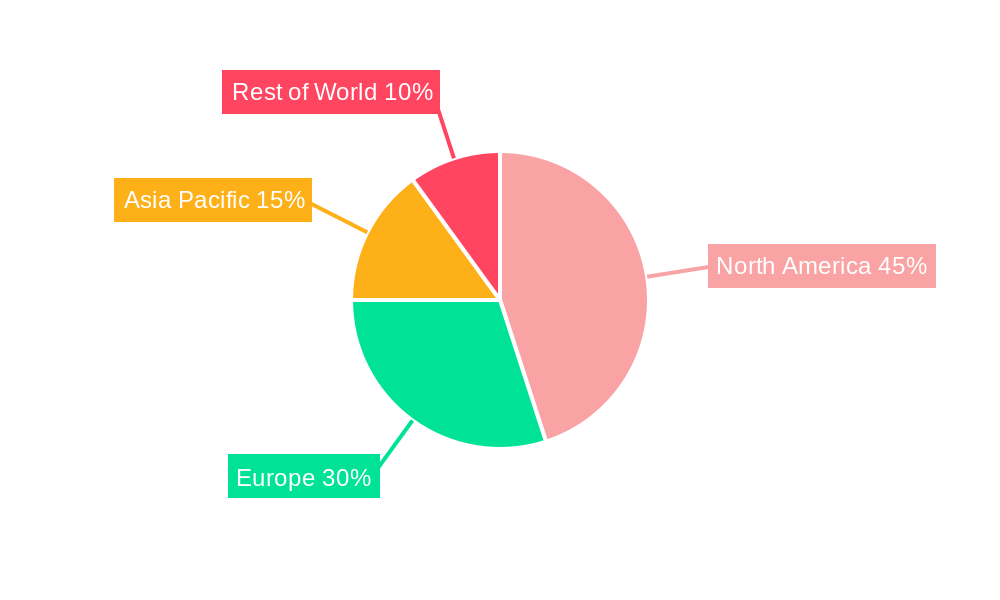
Competition within the neuroprosthetics industry is intense, with major players including Medtronic PLC, Abbott Laboratories, Boston Scientific Corporation, and Cochlear Limited vying for market share. These companies are actively engaged in strategic collaborations, mergers, and acquisitions to expand their product portfolios and geographical reach. The market is geographically diverse, with North America currently holding a significant share, attributable to advanced healthcare infrastructure and high adoption rates. However, Asia-Pacific is expected to witness substantial growth in the coming years, driven by increasing healthcare expenditure and rising awareness of neuroprosthetics. Regulatory approvals and reimbursement policies play a crucial role in determining market accessibility and influencing adoption rates in different regions. The market's future trajectory is significantly influenced by ongoing research into brain-computer interfaces, advanced materials for implantable devices, and minimally invasive surgical techniques. These advancements promise to enhance the capabilities and broaden the therapeutic applications of neuroprosthetics in the years to come.
Neuroprosthetics Industry Market Report: 2019-2033
This comprehensive report provides a detailed analysis of the Neuroprosthetics industry, encompassing market size, segmentation, key players, technological advancements, and future growth projections from 2019 to 2033. The study period covers 2019-2033, with 2025 as the base and estimated year. The forecast period is 2025-2033, and the historical period is 2019-2024. This report is crucial for stakeholders seeking actionable insights into this rapidly evolving market.
Neuroprosthetics Industry Market Concentration & Innovation
The neuroprosthetics market is characterized by a moderately concentrated landscape, with a few large players holding significant market share. Companies like Medtronic PLC, Abbott Laboratories, and Cochlear Limited dominate the market, leveraging their established brand recognition, extensive distribution networks, and robust R&D capabilities. However, smaller, specialized companies are also making significant contributions through innovation. The market share of the top five players is estimated to be around xx% in 2025.
Innovation is a key driver, fueled by advancements in materials science, miniaturization technologies, and improved surgical techniques. Regulatory frameworks, particularly those related to medical device approvals, significantly influence market dynamics. Stringent regulations ensure product safety and efficacy, but can also impede faster market entry for new innovations. The market witnesses continuous product development, leading to increased competition. Mergers and acquisitions (M&A) are also prevalent, with larger companies acquiring smaller firms to expand their product portfolios and market reach. Total M&A deal value in the neuroprosthetics sector between 2019 and 2024 was approximately xx Million.
- Market Concentration: Top 5 players hold approximately xx% market share in 2025.
- Innovation Drivers: Advancements in materials science, miniaturization, improved surgical techniques.
- Regulatory Frameworks: Stringent regulations impact market entry and product development.
- M&A Activity: Total deal value between 2019-2024 estimated at xx Million.
- Substitutes: Limited direct substitutes, but alternative treatments for neurological disorders exist.
- End-User Trends: Increasing demand driven by aging population and rising prevalence of neurological disorders.
Neuroprosthetics Industry Trends & Insights
The neuroprosthetics market is experiencing robust growth, driven by several factors. The aging global population and the increasing prevalence of neurological disorders such as Parkinson's disease, Alzheimer's disease, and epilepsy are major contributors to market expansion. Technological advancements, including the development of more sophisticated and minimally invasive implants, are also fueling market growth. Consumer preferences are shifting towards less invasive procedures with improved functionality and longevity of implants. The competitive landscape is dynamic, with companies focusing on product differentiation through technological advancements and enhanced clinical outcomes. The market is expected to witness a Compound Annual Growth Rate (CAGR) of xx% during the forecast period (2025-2033). Market penetration remains relatively low in several regions, indicating substantial growth potential.
Dominant Markets & Segments in Neuroprosthetics Industry
North America currently holds the largest market share in the neuroprosthetics industry due to high healthcare expenditure, advanced medical infrastructure, and a significant patient pool suffering from neurological disorders. Within this region, the United States is the dominant market.
- Leading Region: North America
- Leading Country: United States
- Dominant Segments:
- Type: Output neural prosthetics currently hold a larger market share compared to input neural prosthetics due to wider adoption in auditory and visual applications.
- Technique: Spinal cord stimulation (SCS) holds a significant market share due to its established use in managing chronic pain.
- Application: Auditory processing disorders (Cochlear Implants) dominate due to high prevalence and established treatment methods. Parkinson's disease treatment is another major application.
Key Drivers for North American Dominance:
- Advanced healthcare infrastructure and high healthcare expenditure.
- High prevalence of neurological disorders.
- Strong regulatory support for medical device innovation.
- Presence of major industry players with established R&D capabilities.
Neuroprosthetics Industry Product Developments
Recent advancements in neuroprosthetics focus on miniaturization, improved biocompatibility, and enhanced functionality. Wireless and implantable devices are gaining traction, offering patients greater freedom and improved quality of life. There's an increasing focus on personalized medicine, tailoring implants to individual patient needs. These advancements are improving market fit, increasing patient acceptance, and driving market expansion.
Report Scope & Segmentation Analysis
This report segments the neuroprosthetics market based on type (Output Neural Prosthetics, Input Neural Prosthetics), technique (Spinal Cord Stimulation, Deep Brain Stimulation, Vagus Nerve Stimulation, Other Techniques), and application (Parkinson's Disease, Alzheimer's Disease, Epilepsy, Auditory Processing Disorders, Ophthalmic Disorders, Other Applications). Each segment's growth projections, market size (in Millions), and competitive dynamics are detailed within the full report. For example, the Output Neural Prosthetics segment is projected to grow at a CAGR of xx% during the forecast period due to high demand for cochlear implants and retinal implants.
Key Drivers of Neuroprosthetics Industry Growth
The neuroprosthetics market is driven by technological advancements, the rising prevalence of neurological disorders across the globe, and increasing healthcare expenditure. Government initiatives and favorable regulatory environments also stimulate market growth. Technological innovations, such as advancements in brain-computer interfaces and minimally invasive surgical techniques, significantly contribute to the market expansion.
Challenges in the Neuroprosthetics Industry Sector
Challenges include high R&D costs, stringent regulatory approval processes, and the potential for device malfunction or rejection. The high cost of treatment poses a barrier for many patients, particularly in developing countries. Supply chain disruptions can also impact market availability. The overall impact of these factors is estimated to affect market growth by approximately xx% in the next five years.
Emerging Opportunities in Neuroprosthetics Industry
Emerging opportunities include advancements in brain-computer interfaces (BCIs) for restoring motor function and treating cognitive impairments, and the development of next-generation implantable devices with improved biocompatibility and functionality. Expansion into emerging markets and unmet medical needs presents significant opportunities for growth.
Leading Players in the Neuroprosthetics Industry Market
- MED-EL Medical Electronics
- Cyberonics Inc
- Abbott Laboratories
- Medtronic PLC
- Sonova Holding AG
- LivaNova PLC
- Demant AS
- Boston Scientific Corporation
- Second Sight
- Cochlear Limited
- BrainGate
Key Developments in Neuroprosthetics Industry Industry
- December 2022: The Government of Saskatchewan implemented an expanded Cochlear Implant Program, increasing accessibility and market demand.
- October 2022: Axoft launched its brain-machine interface (BMI), securing USD 8 Million in funding, demonstrating the growing interest in advanced neurotechnology.
Strategic Outlook for Neuroprosthetics Industry Market
The neuroprosthetics market is poised for significant growth, driven by technological advancements, unmet medical needs, and an aging global population. Focus on innovation, strategic partnerships, and expansion into emerging markets will be crucial for success in this dynamic and rapidly evolving sector. The market is expected to reach xx Million by 2033.
Neuroprosthetics Industry Segmentation
-
1. Type
- 1.1. Output Neural Prosthetics
- 1.2. Input Neural Prosthetics
-
2. Technique
- 2.1. Spinal Cord Stimulation
- 2.2. Deep Brain Stimulation
- 2.3. Vagus Nerve Stimulation
- 2.4. Other Techniques
-
3. Application
- 3.1. Parkinson's Disease
- 3.2. Alzheimer's Disease
- 3.3. Epilepsy
- 3.4. Auditory Processing Disorders
- 3.5. Ophthalmic Disorders
- 3.6. Other Applications
Neuroprosthetics Industry Segmentation By Geography
-
1. North America
- 1.1. United States
- 1.2. Canada
- 1.3. Mexico
-
2. Europe
- 2.1. Germany
- 2.2. United Kingdom
- 2.3. France
- 2.4. Italy
- 2.5. Spain
- 2.6. Rest of Europe
-
3. Asia Pacific
- 3.1. China
- 3.2. Japan
- 3.3. India
- 3.4. Australia
- 3.5. South Korea
- 3.6. Rest of Asia Pacific
-
4. Middle East and Africa
- 4.1. GCC
- 4.2. South Africa
- 4.3. Rest of Middle East and Africa
-
5. South America
- 5.1. Brazil
- 5.2. Argentina
- 5.3. Rest of South America
Neuroprosthetics Industry REPORT HIGHLIGHTS
| Aspects | Details |
|---|---|
| Study Period | 2019-2033 |
| Base Year | 2024 |
| Estimated Year | 2025 |
| Forecast Period | 2025-2033 |
| Historical Period | 2019-2024 |
| Growth Rate | CAGR of 11.83% from 2019-2033 |
| Segmentation |
|
Table of Contents
- 1. Introduction
- 1.1. Research Scope
- 1.2. Market Segmentation
- 1.3. Research Methodology
- 1.4. Definitions and Assumptions
- 2. Executive Summary
- 2.1. Introduction
- 3. Market Dynamics
- 3.1. Introduction
- 3.2. Market Drivers
- 3.2.1. Increasing Number of Patients Suffering from Neurological Disorders and Nerve Injury; Growing Burden of Hearing Loss and Related Defects
- 3.3. Market Restrains
- 3.3.1. Availability of Alternative Treatment Options; High Cost of Neuroprosthetics
- 3.4. Market Trends
- 3.4.1. The Input Neural Prosthetics Segment is Expected to Show a Significant Growth Over the Forecast Period
- 4. Market Factor Analysis
- 4.1. Porters Five Forces
- 4.2. Supply/Value Chain
- 4.3. PESTEL analysis
- 4.4. Market Entropy
- 4.5. Patent/Trademark Analysis
- 5. Global Neuroprosthetics Industry Analysis, Insights and Forecast, 2019-2031
- 5.1. Market Analysis, Insights and Forecast - by Type
- 5.1.1. Output Neural Prosthetics
- 5.1.2. Input Neural Prosthetics
- 5.2. Market Analysis, Insights and Forecast - by Technique
- 5.2.1. Spinal Cord Stimulation
- 5.2.2. Deep Brain Stimulation
- 5.2.3. Vagus Nerve Stimulation
- 5.2.4. Other Techniques
- 5.3. Market Analysis, Insights and Forecast - by Application
- 5.3.1. Parkinson's Disease
- 5.3.2. Alzheimer's Disease
- 5.3.3. Epilepsy
- 5.3.4. Auditory Processing Disorders
- 5.3.5. Ophthalmic Disorders
- 5.3.6. Other Applications
- 5.4. Market Analysis, Insights and Forecast - by Region
- 5.4.1. North America
- 5.4.2. Europe
- 5.4.3. Asia Pacific
- 5.4.4. Middle East and Africa
- 5.4.5. South America
- 5.1. Market Analysis, Insights and Forecast - by Type
- 6. North America Neuroprosthetics Industry Analysis, Insights and Forecast, 2019-2031
- 6.1. Market Analysis, Insights and Forecast - by Type
- 6.1.1. Output Neural Prosthetics
- 6.1.2. Input Neural Prosthetics
- 6.2. Market Analysis, Insights and Forecast - by Technique
- 6.2.1. Spinal Cord Stimulation
- 6.2.2. Deep Brain Stimulation
- 6.2.3. Vagus Nerve Stimulation
- 6.2.4. Other Techniques
- 6.3. Market Analysis, Insights and Forecast - by Application
- 6.3.1. Parkinson's Disease
- 6.3.2. Alzheimer's Disease
- 6.3.3. Epilepsy
- 6.3.4. Auditory Processing Disorders
- 6.3.5. Ophthalmic Disorders
- 6.3.6. Other Applications
- 6.1. Market Analysis, Insights and Forecast - by Type
- 7. Europe Neuroprosthetics Industry Analysis, Insights and Forecast, 2019-2031
- 7.1. Market Analysis, Insights and Forecast - by Type
- 7.1.1. Output Neural Prosthetics
- 7.1.2. Input Neural Prosthetics
- 7.2. Market Analysis, Insights and Forecast - by Technique
- 7.2.1. Spinal Cord Stimulation
- 7.2.2. Deep Brain Stimulation
- 7.2.3. Vagus Nerve Stimulation
- 7.2.4. Other Techniques
- 7.3. Market Analysis, Insights and Forecast - by Application
- 7.3.1. Parkinson's Disease
- 7.3.2. Alzheimer's Disease
- 7.3.3. Epilepsy
- 7.3.4. Auditory Processing Disorders
- 7.3.5. Ophthalmic Disorders
- 7.3.6. Other Applications
- 7.1. Market Analysis, Insights and Forecast - by Type
- 8. Asia Pacific Neuroprosthetics Industry Analysis, Insights and Forecast, 2019-2031
- 8.1. Market Analysis, Insights and Forecast - by Type
- 8.1.1. Output Neural Prosthetics
- 8.1.2. Input Neural Prosthetics
- 8.2. Market Analysis, Insights and Forecast - by Technique
- 8.2.1. Spinal Cord Stimulation
- 8.2.2. Deep Brain Stimulation
- 8.2.3. Vagus Nerve Stimulation
- 8.2.4. Other Techniques
- 8.3. Market Analysis, Insights and Forecast - by Application
- 8.3.1. Parkinson's Disease
- 8.3.2. Alzheimer's Disease
- 8.3.3. Epilepsy
- 8.3.4. Auditory Processing Disorders
- 8.3.5. Ophthalmic Disorders
- 8.3.6. Other Applications
- 8.1. Market Analysis, Insights and Forecast - by Type
- 9. Middle East and Africa Neuroprosthetics Industry Analysis, Insights and Forecast, 2019-2031
- 9.1. Market Analysis, Insights and Forecast - by Type
- 9.1.1. Output Neural Prosthetics
- 9.1.2. Input Neural Prosthetics
- 9.2. Market Analysis, Insights and Forecast - by Technique
- 9.2.1. Spinal Cord Stimulation
- 9.2.2. Deep Brain Stimulation
- 9.2.3. Vagus Nerve Stimulation
- 9.2.4. Other Techniques
- 9.3. Market Analysis, Insights and Forecast - by Application
- 9.3.1. Parkinson's Disease
- 9.3.2. Alzheimer's Disease
- 9.3.3. Epilepsy
- 9.3.4. Auditory Processing Disorders
- 9.3.5. Ophthalmic Disorders
- 9.3.6. Other Applications
- 9.1. Market Analysis, Insights and Forecast - by Type
- 10. South America Neuroprosthetics Industry Analysis, Insights and Forecast, 2019-2031
- 10.1. Market Analysis, Insights and Forecast - by Type
- 10.1.1. Output Neural Prosthetics
- 10.1.2. Input Neural Prosthetics
- 10.2. Market Analysis, Insights and Forecast - by Technique
- 10.2.1. Spinal Cord Stimulation
- 10.2.2. Deep Brain Stimulation
- 10.2.3. Vagus Nerve Stimulation
- 10.2.4. Other Techniques
- 10.3. Market Analysis, Insights and Forecast - by Application
- 10.3.1. Parkinson's Disease
- 10.3.2. Alzheimer's Disease
- 10.3.3. Epilepsy
- 10.3.4. Auditory Processing Disorders
- 10.3.5. Ophthalmic Disorders
- 10.3.6. Other Applications
- 10.1. Market Analysis, Insights and Forecast - by Type
- 11. North Americ Neuroprosthetics Industry Analysis, Insights and Forecast, 2019-2031
- 11.1. Market Analysis, Insights and Forecast - By Country/Sub-region
- 11.1.1 United States
- 11.1.2 Canada
- 11.1.3 Mexico
- 12. South America Neuroprosthetics Industry Analysis, Insights and Forecast, 2019-2031
- 12.1. Market Analysis, Insights and Forecast - By Country/Sub-region
- 12.1.1 Brazil
- 12.1.2 Mexico
- 12.1.3 Rest of South America
- 13. Europe Neuroprosthetics Industry Analysis, Insights and Forecast, 2019-2031
- 13.1. Market Analysis, Insights and Forecast - By Country/Sub-region
- 13.1.1 Germany
- 13.1.2 United Kingdom
- 13.1.3 France
- 13.1.4 Italy
- 13.1.5 Spain
- 13.1.6 Rest of Europe
- 14. Asia Pacific Neuroprosthetics Industry Analysis, Insights and Forecast, 2019-2031
- 14.1. Market Analysis, Insights and Forecast - By Country/Sub-region
- 14.1.1 China
- 14.1.2 Japan
- 14.1.3 India
- 14.1.4 South Korea
- 14.1.5 Taiwan
- 14.1.6 Australia
- 14.1.7 Rest of Asia-Pacific
- 15. MEA Neuroprosthetics Industry Analysis, Insights and Forecast, 2019-2031
- 15.1. Market Analysis, Insights and Forecast - By Country/Sub-region
- 15.1.1 Middle East
- 15.1.2 Africa
- 16. Competitive Analysis
- 16.1. Global Market Share Analysis 2024
- 16.2. Company Profiles
- 16.2.1 MED-EL Medical Electronics
- 16.2.1.1. Overview
- 16.2.1.2. Products
- 16.2.1.3. SWOT Analysis
- 16.2.1.4. Recent Developments
- 16.2.1.5. Financials (Based on Availability)
- 16.2.2 Cyberonics Inc
- 16.2.2.1. Overview
- 16.2.2.2. Products
- 16.2.2.3. SWOT Analysis
- 16.2.2.4. Recent Developments
- 16.2.2.5. Financials (Based on Availability)
- 16.2.3 Abbott Laboratories
- 16.2.3.1. Overview
- 16.2.3.2. Products
- 16.2.3.3. SWOT Analysis
- 16.2.3.4. Recent Developments
- 16.2.3.5. Financials (Based on Availability)
- 16.2.4 Medtronic PLC
- 16.2.4.1. Overview
- 16.2.4.2. Products
- 16.2.4.3. SWOT Analysis
- 16.2.4.4. Recent Developments
- 16.2.4.5. Financials (Based on Availability)
- 16.2.5 Sonova Holding AG
- 16.2.5.1. Overview
- 16.2.5.2. Products
- 16.2.5.3. SWOT Analysis
- 16.2.5.4. Recent Developments
- 16.2.5.5. Financials (Based on Availability)
- 16.2.6 LivaNova PLC
- 16.2.6.1. Overview
- 16.2.6.2. Products
- 16.2.6.3. SWOT Analysis
- 16.2.6.4. Recent Developments
- 16.2.6.5. Financials (Based on Availability)
- 16.2.7 Demant AS
- 16.2.7.1. Overview
- 16.2.7.2. Products
- 16.2.7.3. SWOT Analysis
- 16.2.7.4. Recent Developments
- 16.2.7.5. Financials (Based on Availability)
- 16.2.8 Boston Scientific Corporation
- 16.2.8.1. Overview
- 16.2.8.2. Products
- 16.2.8.3. SWOT Analysis
- 16.2.8.4. Recent Developments
- 16.2.8.5. Financials (Based on Availability)
- 16.2.9 Second Sight
- 16.2.9.1. Overview
- 16.2.9.2. Products
- 16.2.9.3. SWOT Analysis
- 16.2.9.4. Recent Developments
- 16.2.9.5. Financials (Based on Availability)
- 16.2.10 Cochlear Limited
- 16.2.10.1. Overview
- 16.2.10.2. Products
- 16.2.10.3. SWOT Analysis
- 16.2.10.4. Recent Developments
- 16.2.10.5. Financials (Based on Availability)
- 16.2.11 BrainGate
- 16.2.11.1. Overview
- 16.2.11.2. Products
- 16.2.11.3. SWOT Analysis
- 16.2.11.4. Recent Developments
- 16.2.11.5. Financials (Based on Availability)
- 16.2.1 MED-EL Medical Electronics
List of Figures
- Figure 1: Global Neuroprosthetics Industry Revenue Breakdown (Million, %) by Region 2024 & 2032
- Figure 2: Global Neuroprosthetics Industry Volume Breakdown (K Unit, %) by Region 2024 & 2032
- Figure 3: North Americ Neuroprosthetics Industry Revenue (Million), by Country 2024 & 2032
- Figure 4: North Americ Neuroprosthetics Industry Volume (K Unit), by Country 2024 & 2032
- Figure 5: North Americ Neuroprosthetics Industry Revenue Share (%), by Country 2024 & 2032
- Figure 6: North Americ Neuroprosthetics Industry Volume Share (%), by Country 2024 & 2032
- Figure 7: South America Neuroprosthetics Industry Revenue (Million), by Country 2024 & 2032
- Figure 8: South America Neuroprosthetics Industry Volume (K Unit), by Country 2024 & 2032
- Figure 9: South America Neuroprosthetics Industry Revenue Share (%), by Country 2024 & 2032
- Figure 10: South America Neuroprosthetics Industry Volume Share (%), by Country 2024 & 2032
- Figure 11: Europe Neuroprosthetics Industry Revenue (Million), by Country 2024 & 2032
- Figure 12: Europe Neuroprosthetics Industry Volume (K Unit), by Country 2024 & 2032
- Figure 13: Europe Neuroprosthetics Industry Revenue Share (%), by Country 2024 & 2032
- Figure 14: Europe Neuroprosthetics Industry Volume Share (%), by Country 2024 & 2032
- Figure 15: Asia Pacific Neuroprosthetics Industry Revenue (Million), by Country 2024 & 2032
- Figure 16: Asia Pacific Neuroprosthetics Industry Volume (K Unit), by Country 2024 & 2032
- Figure 17: Asia Pacific Neuroprosthetics Industry Revenue Share (%), by Country 2024 & 2032
- Figure 18: Asia Pacific Neuroprosthetics Industry Volume Share (%), by Country 2024 & 2032
- Figure 19: MEA Neuroprosthetics Industry Revenue (Million), by Country 2024 & 2032
- Figure 20: MEA Neuroprosthetics Industry Volume (K Unit), by Country 2024 & 2032
- Figure 21: MEA Neuroprosthetics Industry Revenue Share (%), by Country 2024 & 2032
- Figure 22: MEA Neuroprosthetics Industry Volume Share (%), by Country 2024 & 2032
- Figure 23: North America Neuroprosthetics Industry Revenue (Million), by Type 2024 & 2032
- Figure 24: North America Neuroprosthetics Industry Volume (K Unit), by Type 2024 & 2032
- Figure 25: North America Neuroprosthetics Industry Revenue Share (%), by Type 2024 & 2032
- Figure 26: North America Neuroprosthetics Industry Volume Share (%), by Type 2024 & 2032
- Figure 27: North America Neuroprosthetics Industry Revenue (Million), by Technique 2024 & 2032
- Figure 28: North America Neuroprosthetics Industry Volume (K Unit), by Technique 2024 & 2032
- Figure 29: North America Neuroprosthetics Industry Revenue Share (%), by Technique 2024 & 2032
- Figure 30: North America Neuroprosthetics Industry Volume Share (%), by Technique 2024 & 2032
- Figure 31: North America Neuroprosthetics Industry Revenue (Million), by Application 2024 & 2032
- Figure 32: North America Neuroprosthetics Industry Volume (K Unit), by Application 2024 & 2032
- Figure 33: North America Neuroprosthetics Industry Revenue Share (%), by Application 2024 & 2032
- Figure 34: North America Neuroprosthetics Industry Volume Share (%), by Application 2024 & 2032
- Figure 35: North America Neuroprosthetics Industry Revenue (Million), by Country 2024 & 2032
- Figure 36: North America Neuroprosthetics Industry Volume (K Unit), by Country 2024 & 2032
- Figure 37: North America Neuroprosthetics Industry Revenue Share (%), by Country 2024 & 2032
- Figure 38: North America Neuroprosthetics Industry Volume Share (%), by Country 2024 & 2032
- Figure 39: Europe Neuroprosthetics Industry Revenue (Million), by Type 2024 & 2032
- Figure 40: Europe Neuroprosthetics Industry Volume (K Unit), by Type 2024 & 2032
- Figure 41: Europe Neuroprosthetics Industry Revenue Share (%), by Type 2024 & 2032
- Figure 42: Europe Neuroprosthetics Industry Volume Share (%), by Type 2024 & 2032
- Figure 43: Europe Neuroprosthetics Industry Revenue (Million), by Technique 2024 & 2032
- Figure 44: Europe Neuroprosthetics Industry Volume (K Unit), by Technique 2024 & 2032
- Figure 45: Europe Neuroprosthetics Industry Revenue Share (%), by Technique 2024 & 2032
- Figure 46: Europe Neuroprosthetics Industry Volume Share (%), by Technique 2024 & 2032
- Figure 47: Europe Neuroprosthetics Industry Revenue (Million), by Application 2024 & 2032
- Figure 48: Europe Neuroprosthetics Industry Volume (K Unit), by Application 2024 & 2032
- Figure 49: Europe Neuroprosthetics Industry Revenue Share (%), by Application 2024 & 2032
- Figure 50: Europe Neuroprosthetics Industry Volume Share (%), by Application 2024 & 2032
- Figure 51: Europe Neuroprosthetics Industry Revenue (Million), by Country 2024 & 2032
- Figure 52: Europe Neuroprosthetics Industry Volume (K Unit), by Country 2024 & 2032
- Figure 53: Europe Neuroprosthetics Industry Revenue Share (%), by Country 2024 & 2032
- Figure 54: Europe Neuroprosthetics Industry Volume Share (%), by Country 2024 & 2032
- Figure 55: Asia Pacific Neuroprosthetics Industry Revenue (Million), by Type 2024 & 2032
- Figure 56: Asia Pacific Neuroprosthetics Industry Volume (K Unit), by Type 2024 & 2032
- Figure 57: Asia Pacific Neuroprosthetics Industry Revenue Share (%), by Type 2024 & 2032
- Figure 58: Asia Pacific Neuroprosthetics Industry Volume Share (%), by Type 2024 & 2032
- Figure 59: Asia Pacific Neuroprosthetics Industry Revenue (Million), by Technique 2024 & 2032
- Figure 60: Asia Pacific Neuroprosthetics Industry Volume (K Unit), by Technique 2024 & 2032
- Figure 61: Asia Pacific Neuroprosthetics Industry Revenue Share (%), by Technique 2024 & 2032
- Figure 62: Asia Pacific Neuroprosthetics Industry Volume Share (%), by Technique 2024 & 2032
- Figure 63: Asia Pacific Neuroprosthetics Industry Revenue (Million), by Application 2024 & 2032
- Figure 64: Asia Pacific Neuroprosthetics Industry Volume (K Unit), by Application 2024 & 2032
- Figure 65: Asia Pacific Neuroprosthetics Industry Revenue Share (%), by Application 2024 & 2032
- Figure 66: Asia Pacific Neuroprosthetics Industry Volume Share (%), by Application 2024 & 2032
- Figure 67: Asia Pacific Neuroprosthetics Industry Revenue (Million), by Country 2024 & 2032
- Figure 68: Asia Pacific Neuroprosthetics Industry Volume (K Unit), by Country 2024 & 2032
- Figure 69: Asia Pacific Neuroprosthetics Industry Revenue Share (%), by Country 2024 & 2032
- Figure 70: Asia Pacific Neuroprosthetics Industry Volume Share (%), by Country 2024 & 2032
- Figure 71: Middle East and Africa Neuroprosthetics Industry Revenue (Million), by Type 2024 & 2032
- Figure 72: Middle East and Africa Neuroprosthetics Industry Volume (K Unit), by Type 2024 & 2032
- Figure 73: Middle East and Africa Neuroprosthetics Industry Revenue Share (%), by Type 2024 & 2032
- Figure 74: Middle East and Africa Neuroprosthetics Industry Volume Share (%), by Type 2024 & 2032
- Figure 75: Middle East and Africa Neuroprosthetics Industry Revenue (Million), by Technique 2024 & 2032
- Figure 76: Middle East and Africa Neuroprosthetics Industry Volume (K Unit), by Technique 2024 & 2032
- Figure 77: Middle East and Africa Neuroprosthetics Industry Revenue Share (%), by Technique 2024 & 2032
- Figure 78: Middle East and Africa Neuroprosthetics Industry Volume Share (%), by Technique 2024 & 2032
- Figure 79: Middle East and Africa Neuroprosthetics Industry Revenue (Million), by Application 2024 & 2032
- Figure 80: Middle East and Africa Neuroprosthetics Industry Volume (K Unit), by Application 2024 & 2032
- Figure 81: Middle East and Africa Neuroprosthetics Industry Revenue Share (%), by Application 2024 & 2032
- Figure 82: Middle East and Africa Neuroprosthetics Industry Volume Share (%), by Application 2024 & 2032
- Figure 83: Middle East and Africa Neuroprosthetics Industry Revenue (Million), by Country 2024 & 2032
- Figure 84: Middle East and Africa Neuroprosthetics Industry Volume (K Unit), by Country 2024 & 2032
- Figure 85: Middle East and Africa Neuroprosthetics Industry Revenue Share (%), by Country 2024 & 2032
- Figure 86: Middle East and Africa Neuroprosthetics Industry Volume Share (%), by Country 2024 & 2032
- Figure 87: South America Neuroprosthetics Industry Revenue (Million), by Type 2024 & 2032
- Figure 88: South America Neuroprosthetics Industry Volume (K Unit), by Type 2024 & 2032
- Figure 89: South America Neuroprosthetics Industry Revenue Share (%), by Type 2024 & 2032
- Figure 90: South America Neuroprosthetics Industry Volume Share (%), by Type 2024 & 2032
- Figure 91: South America Neuroprosthetics Industry Revenue (Million), by Technique 2024 & 2032
- Figure 92: South America Neuroprosthetics Industry Volume (K Unit), by Technique 2024 & 2032
- Figure 93: South America Neuroprosthetics Industry Revenue Share (%), by Technique 2024 & 2032
- Figure 94: South America Neuroprosthetics Industry Volume Share (%), by Technique 2024 & 2032
- Figure 95: South America Neuroprosthetics Industry Revenue (Million), by Application 2024 & 2032
- Figure 96: South America Neuroprosthetics Industry Volume (K Unit), by Application 2024 & 2032
- Figure 97: South America Neuroprosthetics Industry Revenue Share (%), by Application 2024 & 2032
- Figure 98: South America Neuroprosthetics Industry Volume Share (%), by Application 2024 & 2032
- Figure 99: South America Neuroprosthetics Industry Revenue (Million), by Country 2024 & 2032
- Figure 100: South America Neuroprosthetics Industry Volume (K Unit), by Country 2024 & 2032
- Figure 101: South America Neuroprosthetics Industry Revenue Share (%), by Country 2024 & 2032
- Figure 102: South America Neuroprosthetics Industry Volume Share (%), by Country 2024 & 2032
List of Tables
- Table 1: Global Neuroprosthetics Industry Revenue Million Forecast, by Region 2019 & 2032
- Table 2: Global Neuroprosthetics Industry Volume K Unit Forecast, by Region 2019 & 2032
- Table 3: Global Neuroprosthetics Industry Revenue Million Forecast, by Type 2019 & 2032
- Table 4: Global Neuroprosthetics Industry Volume K Unit Forecast, by Type 2019 & 2032
- Table 5: Global Neuroprosthetics Industry Revenue Million Forecast, by Technique 2019 & 2032
- Table 6: Global Neuroprosthetics Industry Volume K Unit Forecast, by Technique 2019 & 2032
- Table 7: Global Neuroprosthetics Industry Revenue Million Forecast, by Application 2019 & 2032
- Table 8: Global Neuroprosthetics Industry Volume K Unit Forecast, by Application 2019 & 2032
- Table 9: Global Neuroprosthetics Industry Revenue Million Forecast, by Region 2019 & 2032
- Table 10: Global Neuroprosthetics Industry Volume K Unit Forecast, by Region 2019 & 2032
- Table 11: Global Neuroprosthetics Industry Revenue Million Forecast, by Country 2019 & 2032
- Table 12: Global Neuroprosthetics Industry Volume K Unit Forecast, by Country 2019 & 2032
- Table 13: United States Neuroprosthetics Industry Revenue (Million) Forecast, by Application 2019 & 2032
- Table 14: United States Neuroprosthetics Industry Volume (K Unit) Forecast, by Application 2019 & 2032
- Table 15: Canada Neuroprosthetics Industry Revenue (Million) Forecast, by Application 2019 & 2032
- Table 16: Canada Neuroprosthetics Industry Volume (K Unit) Forecast, by Application 2019 & 2032
- Table 17: Mexico Neuroprosthetics Industry Revenue (Million) Forecast, by Application 2019 & 2032
- Table 18: Mexico Neuroprosthetics Industry Volume (K Unit) Forecast, by Application 2019 & 2032
- Table 19: Global Neuroprosthetics Industry Revenue Million Forecast, by Country 2019 & 2032
- Table 20: Global Neuroprosthetics Industry Volume K Unit Forecast, by Country 2019 & 2032
- Table 21: Brazil Neuroprosthetics Industry Revenue (Million) Forecast, by Application 2019 & 2032
- Table 22: Brazil Neuroprosthetics Industry Volume (K Unit) Forecast, by Application 2019 & 2032
- Table 23: Mexico Neuroprosthetics Industry Revenue (Million) Forecast, by Application 2019 & 2032
- Table 24: Mexico Neuroprosthetics Industry Volume (K Unit) Forecast, by Application 2019 & 2032
- Table 25: Rest of South America Neuroprosthetics Industry Revenue (Million) Forecast, by Application 2019 & 2032
- Table 26: Rest of South America Neuroprosthetics Industry Volume (K Unit) Forecast, by Application 2019 & 2032
- Table 27: Global Neuroprosthetics Industry Revenue Million Forecast, by Country 2019 & 2032
- Table 28: Global Neuroprosthetics Industry Volume K Unit Forecast, by Country 2019 & 2032
- Table 29: Germany Neuroprosthetics Industry Revenue (Million) Forecast, by Application 2019 & 2032
- Table 30: Germany Neuroprosthetics Industry Volume (K Unit) Forecast, by Application 2019 & 2032
- Table 31: United Kingdom Neuroprosthetics Industry Revenue (Million) Forecast, by Application 2019 & 2032
- Table 32: United Kingdom Neuroprosthetics Industry Volume (K Unit) Forecast, by Application 2019 & 2032
- Table 33: France Neuroprosthetics Industry Revenue (Million) Forecast, by Application 2019 & 2032
- Table 34: France Neuroprosthetics Industry Volume (K Unit) Forecast, by Application 2019 & 2032
- Table 35: Italy Neuroprosthetics Industry Revenue (Million) Forecast, by Application 2019 & 2032
- Table 36: Italy Neuroprosthetics Industry Volume (K Unit) Forecast, by Application 2019 & 2032
- Table 37: Spain Neuroprosthetics Industry Revenue (Million) Forecast, by Application 2019 & 2032
- Table 38: Spain Neuroprosthetics Industry Volume (K Unit) Forecast, by Application 2019 & 2032
- Table 39: Rest of Europe Neuroprosthetics Industry Revenue (Million) Forecast, by Application 2019 & 2032
- Table 40: Rest of Europe Neuroprosthetics Industry Volume (K Unit) Forecast, by Application 2019 & 2032
- Table 41: Global Neuroprosthetics Industry Revenue Million Forecast, by Country 2019 & 2032
- Table 42: Global Neuroprosthetics Industry Volume K Unit Forecast, by Country 2019 & 2032
- Table 43: China Neuroprosthetics Industry Revenue (Million) Forecast, by Application 2019 & 2032
- Table 44: China Neuroprosthetics Industry Volume (K Unit) Forecast, by Application 2019 & 2032
- Table 45: Japan Neuroprosthetics Industry Revenue (Million) Forecast, by Application 2019 & 2032
- Table 46: Japan Neuroprosthetics Industry Volume (K Unit) Forecast, by Application 2019 & 2032
- Table 47: India Neuroprosthetics Industry Revenue (Million) Forecast, by Application 2019 & 2032
- Table 48: India Neuroprosthetics Industry Volume (K Unit) Forecast, by Application 2019 & 2032
- Table 49: South Korea Neuroprosthetics Industry Revenue (Million) Forecast, by Application 2019 & 2032
- Table 50: South Korea Neuroprosthetics Industry Volume (K Unit) Forecast, by Application 2019 & 2032
- Table 51: Taiwan Neuroprosthetics Industry Revenue (Million) Forecast, by Application 2019 & 2032
- Table 52: Taiwan Neuroprosthetics Industry Volume (K Unit) Forecast, by Application 2019 & 2032
- Table 53: Australia Neuroprosthetics Industry Revenue (Million) Forecast, by Application 2019 & 2032
- Table 54: Australia Neuroprosthetics Industry Volume (K Unit) Forecast, by Application 2019 & 2032
- Table 55: Rest of Asia-Pacific Neuroprosthetics Industry Revenue (Million) Forecast, by Application 2019 & 2032
- Table 56: Rest of Asia-Pacific Neuroprosthetics Industry Volume (K Unit) Forecast, by Application 2019 & 2032
- Table 57: Global Neuroprosthetics Industry Revenue Million Forecast, by Country 2019 & 2032
- Table 58: Global Neuroprosthetics Industry Volume K Unit Forecast, by Country 2019 & 2032
- Table 59: Middle East Neuroprosthetics Industry Revenue (Million) Forecast, by Application 2019 & 2032
- Table 60: Middle East Neuroprosthetics Industry Volume (K Unit) Forecast, by Application 2019 & 2032
- Table 61: Africa Neuroprosthetics Industry Revenue (Million) Forecast, by Application 2019 & 2032
- Table 62: Africa Neuroprosthetics Industry Volume (K Unit) Forecast, by Application 2019 & 2032
- Table 63: Global Neuroprosthetics Industry Revenue Million Forecast, by Type 2019 & 2032
- Table 64: Global Neuroprosthetics Industry Volume K Unit Forecast, by Type 2019 & 2032
- Table 65: Global Neuroprosthetics Industry Revenue Million Forecast, by Technique 2019 & 2032
- Table 66: Global Neuroprosthetics Industry Volume K Unit Forecast, by Technique 2019 & 2032
- Table 67: Global Neuroprosthetics Industry Revenue Million Forecast, by Application 2019 & 2032
- Table 68: Global Neuroprosthetics Industry Volume K Unit Forecast, by Application 2019 & 2032
- Table 69: Global Neuroprosthetics Industry Revenue Million Forecast, by Country 2019 & 2032
- Table 70: Global Neuroprosthetics Industry Volume K Unit Forecast, by Country 2019 & 2032
- Table 71: United States Neuroprosthetics Industry Revenue (Million) Forecast, by Application 2019 & 2032
- Table 72: United States Neuroprosthetics Industry Volume (K Unit) Forecast, by Application 2019 & 2032
- Table 73: Canada Neuroprosthetics Industry Revenue (Million) Forecast, by Application 2019 & 2032
- Table 74: Canada Neuroprosthetics Industry Volume (K Unit) Forecast, by Application 2019 & 2032
- Table 75: Mexico Neuroprosthetics Industry Revenue (Million) Forecast, by Application 2019 & 2032
- Table 76: Mexico Neuroprosthetics Industry Volume (K Unit) Forecast, by Application 2019 & 2032
- Table 77: Global Neuroprosthetics Industry Revenue Million Forecast, by Type 2019 & 2032
- Table 78: Global Neuroprosthetics Industry Volume K Unit Forecast, by Type 2019 & 2032
- Table 79: Global Neuroprosthetics Industry Revenue Million Forecast, by Technique 2019 & 2032
- Table 80: Global Neuroprosthetics Industry Volume K Unit Forecast, by Technique 2019 & 2032
- Table 81: Global Neuroprosthetics Industry Revenue Million Forecast, by Application 2019 & 2032
- Table 82: Global Neuroprosthetics Industry Volume K Unit Forecast, by Application 2019 & 2032
- Table 83: Global Neuroprosthetics Industry Revenue Million Forecast, by Country 2019 & 2032
- Table 84: Global Neuroprosthetics Industry Volume K Unit Forecast, by Country 2019 & 2032
- Table 85: Germany Neuroprosthetics Industry Revenue (Million) Forecast, by Application 2019 & 2032
- Table 86: Germany Neuroprosthetics Industry Volume (K Unit) Forecast, by Application 2019 & 2032
- Table 87: United Kingdom Neuroprosthetics Industry Revenue (Million) Forecast, by Application 2019 & 2032
- Table 88: United Kingdom Neuroprosthetics Industry Volume (K Unit) Forecast, by Application 2019 & 2032
- Table 89: France Neuroprosthetics Industry Revenue (Million) Forecast, by Application 2019 & 2032
- Table 90: France Neuroprosthetics Industry Volume (K Unit) Forecast, by Application 2019 & 2032
- Table 91: Italy Neuroprosthetics Industry Revenue (Million) Forecast, by Application 2019 & 2032
- Table 92: Italy Neuroprosthetics Industry Volume (K Unit) Forecast, by Application 2019 & 2032
- Table 93: Spain Neuroprosthetics Industry Revenue (Million) Forecast, by Application 2019 & 2032
- Table 94: Spain Neuroprosthetics Industry Volume (K Unit) Forecast, by Application 2019 & 2032
- Table 95: Rest of Europe Neuroprosthetics Industry Revenue (Million) Forecast, by Application 2019 & 2032
- Table 96: Rest of Europe Neuroprosthetics Industry Volume (K Unit) Forecast, by Application 2019 & 2032
- Table 97: Global Neuroprosthetics Industry Revenue Million Forecast, by Type 2019 & 2032
- Table 98: Global Neuroprosthetics Industry Volume K Unit Forecast, by Type 2019 & 2032
- Table 99: Global Neuroprosthetics Industry Revenue Million Forecast, by Technique 2019 & 2032
- Table 100: Global Neuroprosthetics Industry Volume K Unit Forecast, by Technique 2019 & 2032
- Table 101: Global Neuroprosthetics Industry Revenue Million Forecast, by Application 2019 & 2032
- Table 102: Global Neuroprosthetics Industry Volume K Unit Forecast, by Application 2019 & 2032
- Table 103: Global Neuroprosthetics Industry Revenue Million Forecast, by Country 2019 & 2032
- Table 104: Global Neuroprosthetics Industry Volume K Unit Forecast, by Country 2019 & 2032
- Table 105: China Neuroprosthetics Industry Revenue (Million) Forecast, by Application 2019 & 2032
- Table 106: China Neuroprosthetics Industry Volume (K Unit) Forecast, by Application 2019 & 2032
- Table 107: Japan Neuroprosthetics Industry Revenue (Million) Forecast, by Application 2019 & 2032
- Table 108: Japan Neuroprosthetics Industry Volume (K Unit) Forecast, by Application 2019 & 2032
- Table 109: India Neuroprosthetics Industry Revenue (Million) Forecast, by Application 2019 & 2032
- Table 110: India Neuroprosthetics Industry Volume (K Unit) Forecast, by Application 2019 & 2032
- Table 111: Australia Neuroprosthetics Industry Revenue (Million) Forecast, by Application 2019 & 2032
- Table 112: Australia Neuroprosthetics Industry Volume (K Unit) Forecast, by Application 2019 & 2032
- Table 113: South Korea Neuroprosthetics Industry Revenue (Million) Forecast, by Application 2019 & 2032
- Table 114: South Korea Neuroprosthetics Industry Volume (K Unit) Forecast, by Application 2019 & 2032
- Table 115: Rest of Asia Pacific Neuroprosthetics Industry Revenue (Million) Forecast, by Application 2019 & 2032
- Table 116: Rest of Asia Pacific Neuroprosthetics Industry Volume (K Unit) Forecast, by Application 2019 & 2032
- Table 117: Global Neuroprosthetics Industry Revenue Million Forecast, by Type 2019 & 2032
- Table 118: Global Neuroprosthetics Industry Volume K Unit Forecast, by Type 2019 & 2032
- Table 119: Global Neuroprosthetics Industry Revenue Million Forecast, by Technique 2019 & 2032
- Table 120: Global Neuroprosthetics Industry Volume K Unit Forecast, by Technique 2019 & 2032
- Table 121: Global Neuroprosthetics Industry Revenue Million Forecast, by Application 2019 & 2032
- Table 122: Global Neuroprosthetics Industry Volume K Unit Forecast, by Application 2019 & 2032
- Table 123: Global Neuroprosthetics Industry Revenue Million Forecast, by Country 2019 & 2032
- Table 124: Global Neuroprosthetics Industry Volume K Unit Forecast, by Country 2019 & 2032
- Table 125: GCC Neuroprosthetics Industry Revenue (Million) Forecast, by Application 2019 & 2032
- Table 126: GCC Neuroprosthetics Industry Volume (K Unit) Forecast, by Application 2019 & 2032
- Table 127: South Africa Neuroprosthetics Industry Revenue (Million) Forecast, by Application 2019 & 2032
- Table 128: South Africa Neuroprosthetics Industry Volume (K Unit) Forecast, by Application 2019 & 2032
- Table 129: Rest of Middle East and Africa Neuroprosthetics Industry Revenue (Million) Forecast, by Application 2019 & 2032
- Table 130: Rest of Middle East and Africa Neuroprosthetics Industry Volume (K Unit) Forecast, by Application 2019 & 2032
- Table 131: Global Neuroprosthetics Industry Revenue Million Forecast, by Type 2019 & 2032
- Table 132: Global Neuroprosthetics Industry Volume K Unit Forecast, by Type 2019 & 2032
- Table 133: Global Neuroprosthetics Industry Revenue Million Forecast, by Technique 2019 & 2032
- Table 134: Global Neuroprosthetics Industry Volume K Unit Forecast, by Technique 2019 & 2032
- Table 135: Global Neuroprosthetics Industry Revenue Million Forecast, by Application 2019 & 2032
- Table 136: Global Neuroprosthetics Industry Volume K Unit Forecast, by Application 2019 & 2032
- Table 137: Global Neuroprosthetics Industry Revenue Million Forecast, by Country 2019 & 2032
- Table 138: Global Neuroprosthetics Industry Volume K Unit Forecast, by Country 2019 & 2032
- Table 139: Brazil Neuroprosthetics Industry Revenue (Million) Forecast, by Application 2019 & 2032
- Table 140: Brazil Neuroprosthetics Industry Volume (K Unit) Forecast, by Application 2019 & 2032
- Table 141: Argentina Neuroprosthetics Industry Revenue (Million) Forecast, by Application 2019 & 2032
- Table 142: Argentina Neuroprosthetics Industry Volume (K Unit) Forecast, by Application 2019 & 2032
- Table 143: Rest of South America Neuroprosthetics Industry Revenue (Million) Forecast, by Application 2019 & 2032
- Table 144: Rest of South America Neuroprosthetics Industry Volume (K Unit) Forecast, by Application 2019 & 2032
Frequently Asked Questions
1. What is the projected Compound Annual Growth Rate (CAGR) of the Neuroprosthetics Industry?
The projected CAGR is approximately 11.83%.
2. Which companies are prominent players in the Neuroprosthetics Industry?
Key companies in the market include MED-EL Medical Electronics, Cyberonics Inc, Abbott Laboratories, Medtronic PLC, Sonova Holding AG, LivaNova PLC, Demant AS, Boston Scientific Corporation, Second Sight, Cochlear Limited, BrainGate.
3. What are the main segments of the Neuroprosthetics Industry?
The market segments include Type, Technique, Application.
4. Can you provide details about the market size?
The market size is estimated to be USD 12.01 Million as of 2022.
5. What are some drivers contributing to market growth?
Increasing Number of Patients Suffering from Neurological Disorders and Nerve Injury; Growing Burden of Hearing Loss and Related Defects.
6. What are the notable trends driving market growth?
The Input Neural Prosthetics Segment is Expected to Show a Significant Growth Over the Forecast Period.
7. Are there any restraints impacting market growth?
Availability of Alternative Treatment Options; High Cost of Neuroprosthetics.
8. Can you provide examples of recent developments in the market?
In December 2022, the Government of Saskatchewan through the Ministry of Health and the Saskatchewan Health Authority (SHA), implemented the expanded Cochlear Implant Program to help those who need their external sound processor replaced. Under the new program, individuals will co-pay USD 840 per implant with the Ministry of Health covering the remainder of the cost, which is often USD 8,000 to USD 12,000.
9. What pricing options are available for accessing the report?
Pricing options include single-user, multi-user, and enterprise licenses priced at USD 4750, USD 5250, and USD 8750 respectively.
10. Is the market size provided in terms of value or volume?
The market size is provided in terms of value, measured in Million and volume, measured in K Unit.
11. Are there any specific market keywords associated with the report?
Yes, the market keyword associated with the report is "Neuroprosthetics Industry," which aids in identifying and referencing the specific market segment covered.
12. How do I determine which pricing option suits my needs best?
The pricing options vary based on user requirements and access needs. Individual users may opt for single-user licenses, while businesses requiring broader access may choose multi-user or enterprise licenses for cost-effective access to the report.
13. Are there any additional resources or data provided in the Neuroprosthetics Industry report?
While the report offers comprehensive insights, it's advisable to review the specific contents or supplementary materials provided to ascertain if additional resources or data are available.
14. How can I stay updated on further developments or reports in the Neuroprosthetics Industry?
To stay informed about further developments, trends, and reports in the Neuroprosthetics Industry, consider subscribing to industry newsletters, following relevant companies and organizations, or regularly checking reputable industry news sources and publications.
Methodology
Step 1 - Identification of Relevant Samples Size from Population Database


Step 2 - Approaches for Defining Global Market Size (Value, Volume* & Price*)

Note*: In applicable scenarios
Step 3 - Data Sources
Primary Research
- Web Analytics
- Survey Reports
- Research Institute
- Latest Research Reports
- Opinion Leaders
Secondary Research
- Annual Reports
- White Paper
- Latest Press Release
- Industry Association
- Paid Database
- Investor Presentations

Step 4 - Data Triangulation
Involves using different sources of information in order to increase the validity of a study
These sources are likely to be stakeholders in a program - participants, other researchers, program staff, other community members, and so on.
Then we put all data in single framework & apply various statistical tools to find out the dynamic on the market.
During the analysis stage, feedback from the stakeholder groups would be compared to determine areas of agreement as well as areas of divergence


