

Key Insights
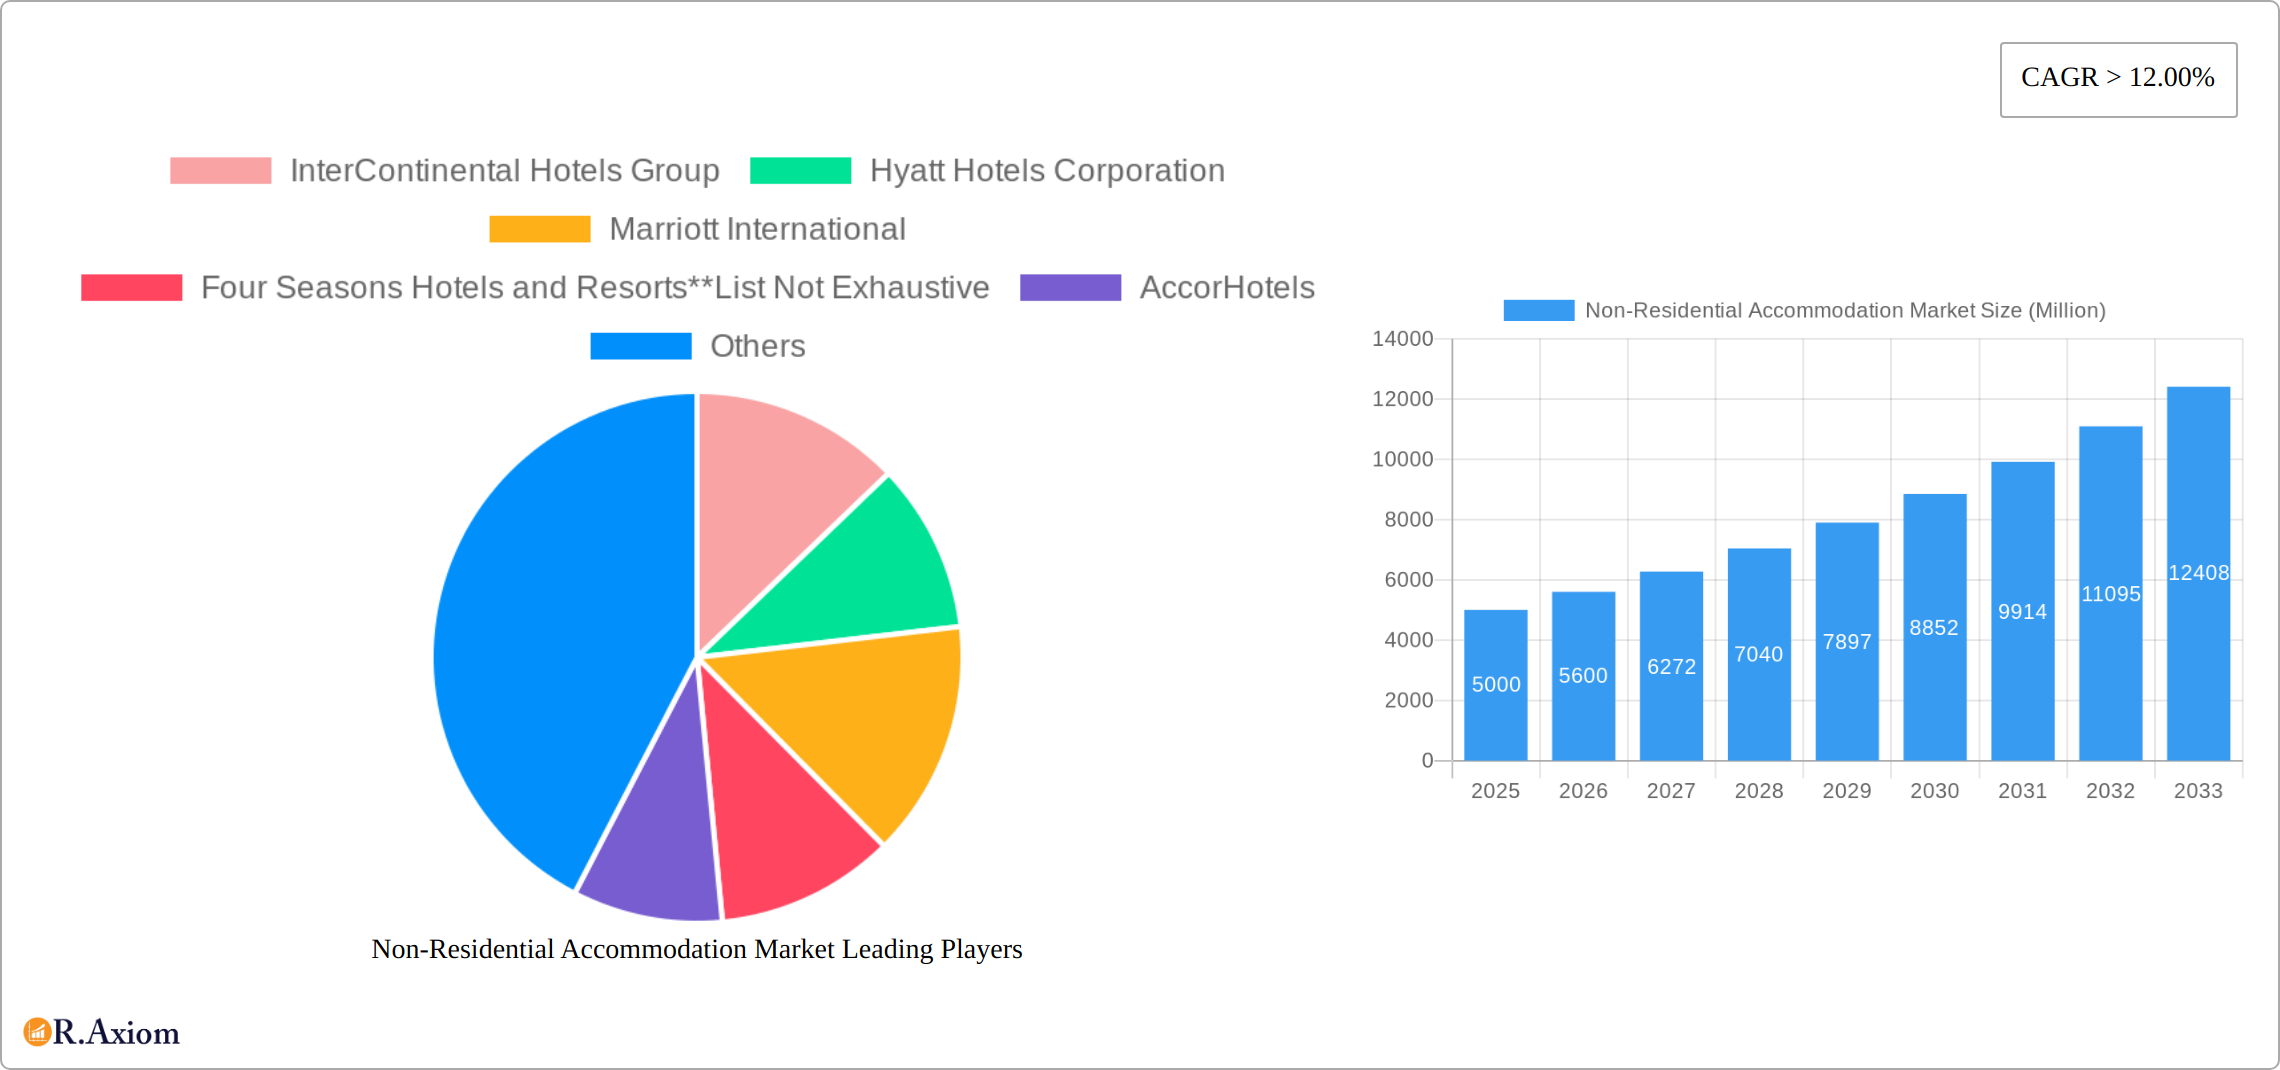
The global non-residential accommodation market, encompassing hotels, motels, resorts, and vacation rentals, is experiencing robust growth, projected to maintain a Compound Annual Growth Rate (CAGR) exceeding 12% from 2025 to 2033. This expansion is fueled by several key drivers. The burgeoning leisure travel sector, particularly among millennials and Gen Z prioritizing unique experiences, significantly contributes to market demand. Business travel, while impacted by remote work trends, remains a substantial segment, especially in sectors like technology and finance requiring in-person collaboration. The rise of online travel agencies (OTAs) and the increasing sophistication of hotel booking platforms have streamlined the booking process, attracting a wider customer base. Further expansion is driven by the increasing popularity of alternative accommodation types like vacation rentals, offering travelers more personalized and cost-effective options. However, the market also faces restraints, including fluctuating fuel prices impacting travel costs and economic downturns potentially reducing discretionary spending on leisure travel. Regional variations exist, with North America and Europe currently dominating the market share due to established tourism infrastructure and a large disposable income population. However, the Asia-Pacific region displays substantial growth potential, driven by rising middle-class incomes and increased domestic and international tourism. The market segmentation, categorized by end-user (leisure, business, group), distribution channel (hotel websites, OTAs, TMCs), and accommodation type (hotels, motels, resorts, vacation rentals), allows for targeted strategies based on specific consumer preferences and market dynamics. Key players like Marriott, Hilton, and IHG are constantly innovating to cater to evolving consumer needs, incorporating sustainable practices and technological advancements to maintain their market position.
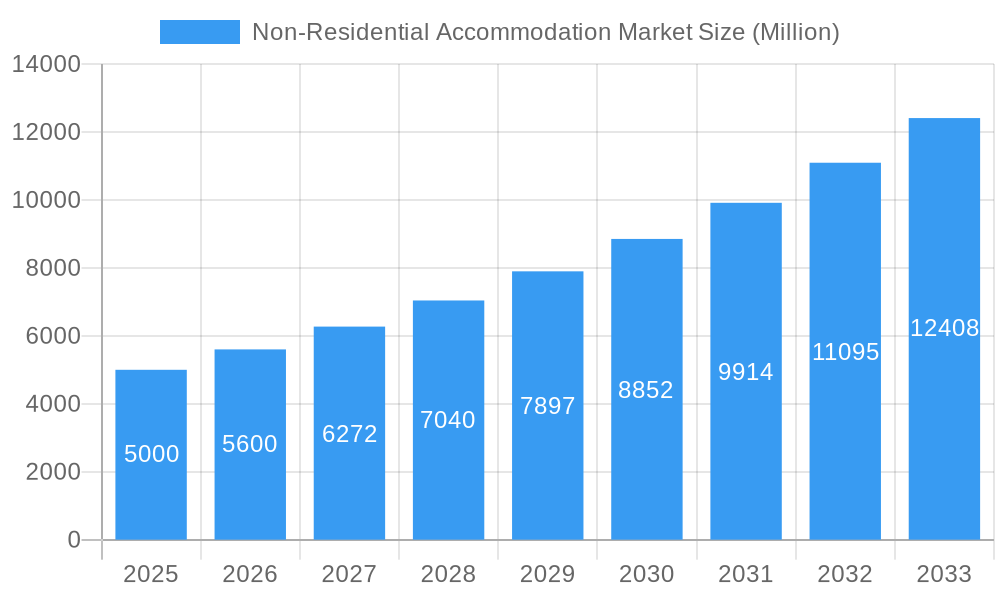
Non-Residential Accommodation Market Market Size (In Billion)
The competitive landscape is characterized by both established global chains and smaller, localized operators. Strategic mergers and acquisitions are anticipated to reshape the market in the coming years, particularly within the vacation rental segment. Continued technological advancements, such as AI-powered booking systems and personalized travel recommendations, will transform the customer experience, enhancing efficiency and personalization. The market's trajectory suggests a sustained period of growth, although macroeconomic factors will continue to play a crucial role in shaping the market's trajectory. Companies are adapting by focusing on diverse offerings, loyalty programs, and strategic partnerships to navigate the evolving market dynamics and cater to changing travel patterns. The focus on sustainability and responsible tourism will further influence investment and business strategies within the sector, creating new opportunities for environmentally conscious accommodations.
Non-Residential Accommodation Market Company Market Share
Non-Residential Accommodation Market: A Comprehensive Analysis (2019-2033)
This comprehensive report provides an in-depth analysis of the Non-Residential Accommodation Market, covering the period 2019-2033. It delves into market concentration, innovation, industry trends, dominant segments, product developments, and key players, offering actionable insights for stakeholders across the hospitality sector. The report leverages extensive data analysis to forecast market growth and identify lucrative opportunities for investment and expansion. The base year for this analysis is 2025, with estimations for 2025 and forecasts spanning 2025-2033, building on historical data from 2019-2024. The total market size in 2025 is estimated at xx Million.
Non-Residential Accommodation Market Concentration & Innovation
The Non-Residential Accommodation Market exhibits a moderately concentrated landscape, dominated by global players like Marriott International, Hilton Worldwide Holdings, and InterContinental Hotels Group. These giants command significant market share, driven by their extensive brand portfolios, global reach, and robust loyalty programs. However, the market also accommodates numerous smaller independent hotels and boutique chains, as well as the rapidly growing vacation rental sector. The market share of the top three players is estimated at xx%, indicating considerable consolidation but leaving room for competition and niche players.
Innovation Drivers: Technological advancements, such as online booking platforms, revenue management systems, and personalized guest experiences, are key innovation drivers. Sustainable practices, including energy efficiency and waste reduction initiatives, are gaining traction, shaping consumer preferences and influencing investment decisions.
Regulatory Frameworks: Local regulations pertaining to zoning, building codes, and environmental protection significantly impact market dynamics. Variations in these regulations across different regions create complexities for international chains and influence the expansion strategies of companies.
M&A Activity: The sector witnesses consistent merger and acquisition activity, with recent deals like Marriott International’s acquisition of a city express brand (October 2022) aiming to strengthen market position in specific segments. The total value of M&A deals in the past five years is estimated at xx Million, reflecting considerable consolidation and expansion strategies within the sector.
Product Substitutes: Alternative accommodation options, including vacation rentals (Airbnb, Vrbo) and shared lodging platforms, pose a competitive challenge to traditional hotels and motels. This competitive pressure necessitates continuous innovation and diversification within the industry to maintain market share.
Non-Residential Accommodation Market Industry Trends & Insights
The Non-Residential Accommodation Market demonstrates robust growth, driven by several factors. Increased disposable incomes, rising travel and tourism spending, and the burgeoning middle class in emerging economies fuel demand for accommodation services. The Compound Annual Growth Rate (CAGR) from 2025 to 2033 is projected to be xx%, with a market size exceeding xx Million by 2033.
Technological disruptions are reshaping the market, with online travel agencies (OTAs) and hotel booking platforms becoming central to the booking process. Mobile booking, personalized recommendations, and smart hotel technologies enhance the guest experience and influence booking patterns. Consumer preferences are shifting towards personalized experiences, sustainable options, and unique accommodation choices, demanding adaptation from established players. The competitive landscape remains dynamic, with ongoing consolidation, diversification, and the emergence of niche players. Market penetration of online booking platforms is currently at approximately xx%, projected to rise to xx% by 2033.
Dominant Markets & Segments in Non-Residential Accommodation Market
By End User: Business travel remains a significant revenue driver, particularly in major business hubs. However, leisure travel and group travel segments are showing strong growth potential, especially in emerging markets and popular tourist destinations.
By Distribution Channels: Online Travel Agencies (OTAs) dominate the booking landscape, showcasing the importance of digital marketing and online presence for success in this industry. Direct bookings through hotel websites are also important.
By Type: Hotels continue to represent the largest segment, followed by resorts and vacation rentals. Motels cater to a budget-conscious market, while the "others" category encompasses a diverse range of accommodation options including hostels, serviced apartments and other lodging choices.
Dominance Analysis: North America and Europe remain dominant regions, benefiting from established tourism infrastructure and high spending power. However, Asia-Pacific is experiencing rapid growth, driven by expanding middle classes and increasing outbound tourism. Key growth drivers in these regions include supportive economic policies, robust infrastructure development, and investments in tourism promotion.
Non-Residential Accommodation Market Product Developments
The non-residential accommodation market is experiencing a wave of innovation driven by a heightened focus on guest experience and sustainability. Technological advancements are at the forefront, with smart room technology, seamless contactless check-in/check-out systems, and AI-powered concierge services rapidly gaining traction. Beyond technology, providers are increasingly differentiating themselves through unique brand identities, loyalty programs meticulously crafted to reward repeat guests, and highly tailored experiences catering to the diverse needs and preferences of modern travelers. This trend is further underscored by a growing emphasis on environmentally sustainable practices and amenities, reflecting a strong consumer demand and aligning with global efforts towards responsible tourism. This includes initiatives such as energy-efficient building designs, water conservation programs, and the sourcing of locally-produced, sustainable food and amenities.
Report Scope & Segmentation Analysis
This report provides a comprehensive overview of the non-residential accommodation market, segmented by:
End User: Leisure Travelers, Business Travelers, Group Travelers. Each segment exhibits unique growth patterns and market characteristics.
Distribution Channels: Hotel Websites, Online Travel Agencies (OTAs), Travel Management Companies (TMCs), Corporate Travel Agents. The report analyzes the changing dynamics of these channels and their impact on market share.
Type: Hotels, Motels, Resorts, Vacation Rentals, Others. This segmentation captures the diversity of accommodation options available to consumers. The report details the growth potential and competitive landscape within each segment.
Growth projections vary across segments, reflecting differing market dynamics. Overall, the market is projected to witness robust expansion over the forecast period. Competitive dynamics within each segment differ depending on the specific niche.
Key Drivers of Non-Residential Accommodation Market Growth
Several interconnected factors are fueling the robust growth of the non-residential accommodation market:
- Rising Disposable Incomes and Increased Travel Budgets: A global rise in disposable incomes, coupled with a greater allocation of funds towards travel and leisure activities, significantly boosts demand for high-quality accommodation options.
- Unprecedented Growth of the Tourism Sector: The continued expansion of the global tourism industry directly translates into increased demand for a diverse range of accommodation choices, from budget-friendly options to luxury retreats.
- Technological Advancements Streamlining the Booking Process and Enhancing the Guest Experience: User-friendly online booking platforms, innovative mobile applications, and advanced technologies that personalize guest experiences are driving bookings and fostering customer loyalty.
- Supportive Government Policies and Infrastructure Investments: Government initiatives aimed at promoting tourism, coupled with strategic investments in tourism infrastructure, create a favorable environment for market expansion.
- The Rise of the "Bleisure" Traveler: The growing trend of combining business trips with leisure activities creates a significant opportunity for hotels to cater to this segment with tailored packages and amenities.
Challenges in the Non-Residential Accommodation Market Sector
The sector faces several challenges:
- Economic Fluctuations: Recessions or economic downturns can significantly reduce travel and accommodation spending.
- Supply Chain Disruptions: Global events can affect the availability of resources, impacting construction and operational costs.
- Intense Competition: The presence of numerous players, including OTAs and alternative accommodation providers, creates a highly competitive environment. The total estimated impact of these challenges on the market is approximately xx Million in lost revenue annually.
Emerging Opportunities in Non-Residential Accommodation Market
The non-residential accommodation market presents a multitude of exciting emerging opportunities for forward-thinking businesses:
- Sustainable and Eco-Conscious Travel: The increasing awareness of environmental concerns amongst travelers presents a significant opportunity for hotels and other accommodation providers to capitalize on the growing demand for eco-friendly options. This includes certifications, partnerships with environmental organizations, and showcasing sustainable practices.
- Hyper-Personalization and Bespoke Experiences: Catering to individual traveler preferences through customized experiences, tailored amenities, and personalized service is key to standing out in a competitive market.
- Experiential Travel and Unique Packages: Offering unique and memorable experiences, such as curated local tours, wellness retreats, or themed packages, enhances guest satisfaction and generates positive word-of-mouth marketing.
- Expansion into Underserved Markets and Niche Segments: Identifying and targeting underserved market segments, such as adventure travelers, wellness enthusiasts, or families, opens up significant growth potential.
Leading Players in the Non-Residential Accommodation Market Market
Key Developments in Non-Residential Accommodation Market Industry
- October 2022: Marriott International to acquire a city express brand to fuel growth in the affordable midscale segment. This acquisition expands Marriott's reach into a price-sensitive market.
- December 2022: Hilton Announced Continued Expansion of Waldorf Astoria Hotels & Resorts in the Caribbean and Latin America by signing a new hotel in San Miguel de Allende, Mexico. This demonstrates Hilton's strategy to capitalize on luxury tourism growth in these regions.
Strategic Outlook for Non-Residential Accommodation Market Market
The Non-Residential Accommodation Market is poised for sustained growth, driven by continued tourism expansion, technological innovation, and evolving consumer preferences. Opportunities lie in leveraging technology for personalized experiences, embracing sustainable practices, and catering to the rising demand for unique and experiential travel. Strategic partnerships, expansion into new markets, and targeted acquisitions will be crucial for players to maintain a competitive edge and capitalize on the market's potential.
Non-Residential Accommodation Market Segmentation
-
1. Type
- 1.1. Hotels
- 1.2. Motels
- 1.3. Resorts
- 1.4. Vacation Rentals
- 1.5. Others
-
2. End User
- 2.1. Leisure Travelers
- 2.2. Business Travelers
- 2.3. Group Travelers
-
3. Distribution Channels
- 3.1. Hotel Websites
- 3.2. Online Travel Agencies (OTA)
- 3.3. Travel Management Companies (TMCs)
- 3.4. Corporate Travel Agents
Non-Residential Accommodation Market Segmentation By Geography
- 1. North America
- 2. Europe
- 3. Asia Pacific
- 4. South America
- 5. Middle East
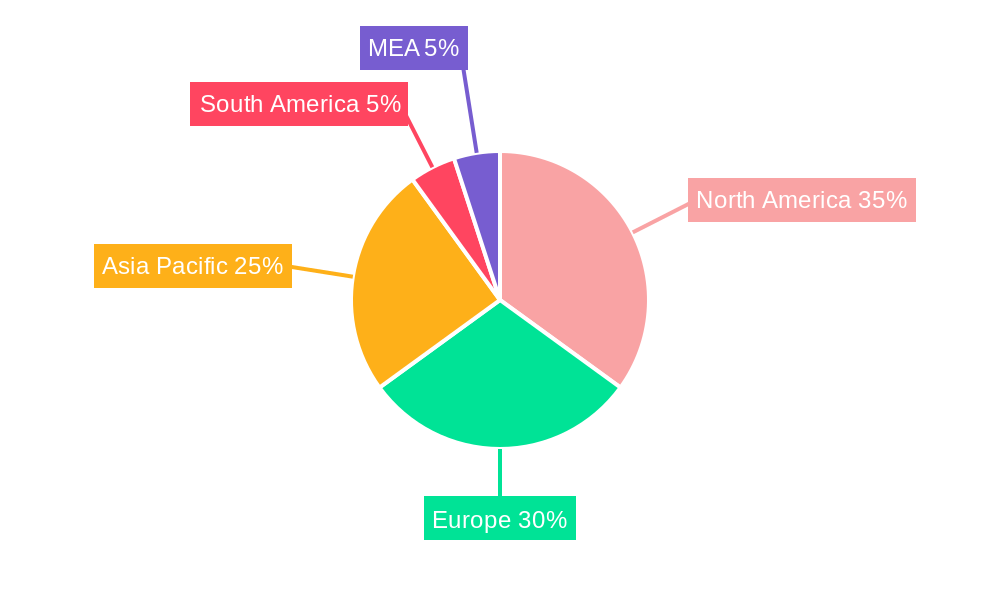
Non-Residential Accommodation Market Regional Market Share
Geographic Coverage of Non-Residential Accommodation Market
Non-Residential Accommodation Market REPORT HIGHLIGHTS
| Aspects | Details |
|---|---|
| Study Period | 2020-2034 |
| Base Year | 2025 |
| Estimated Year | 2026 |
| Forecast Period | 2026-2034 |
| Historical Period | 2020-2025 |
| Growth Rate | CAGR of > 12.00% from 2020-2034 |
| Segmentation |
|
Table of Contents
- 1. Introduction
- 1.1. Research Scope
- 1.2. Market Segmentation
- 1.3. Research Objective
- 1.4. Definitions and Assumptions
- 2. Executive Summary
- 2.1. Market Snapshot
- 3. Market Dynamics
- 3.1. Market Drivers
- 3.2. Market Restrains
- 3.3. Market Trends
- 3.4. Market Opportunities
- 4. Market Factor Analysis
- 4.1. Porters Five Forces
- 4.1.1. Bargaining Power of Suppliers
- 4.1.2. Bargaining Power of Buyers
- 4.1.3. Threat of New Entrants
- 4.1.4. Threat of Substitutes
- 4.1.5. Competitive Rivalry
- 4.2. PESTEL analysis
- 4.3. BCG Analysis
- 4.3.1. Stars (High Growth, High Market Share)
- 4.3.2. Cash Cows (Low Growth, High Market Share)
- 4.3.3. Question Mark (High Growth, Low Market Share)
- 4.3.4. Dogs (Low Growth, Low Market Share)
- 4.4. Ansoff Matrix Analysis
- 4.5. Supply Chain Analysis
- 4.6. Regulatory Landscape
- 4.7. Current Market Potential and Opportunity Assessment (TAM–SAM–SOM Framework)
- 4.8. RAX Analyst Note
- 4.1. Porters Five Forces
- 5. Market Analysis, Insights and Forecast 2021-2033
- 5.1. Market Analysis, Insights and Forecast - by Type
- 5.1.1. Hotels
- 5.1.2. Motels
- 5.1.3. Resorts
- 5.1.4. Vacation Rentals
- 5.1.5. Others
- 5.2. Market Analysis, Insights and Forecast - by End User
- 5.2.1. Leisure Travelers
- 5.2.2. Business Travelers
- 5.2.3. Group Travelers
- 5.3. Market Analysis, Insights and Forecast - by Distribution Channels
- 5.3.1. Hotel Websites
- 5.3.2. Online Travel Agencies (OTA)
- 5.3.3. Travel Management Companies (TMCs)
- 5.3.4. Corporate Travel Agents
- 5.4. Market Analysis, Insights and Forecast - by Region
- 5.4.1. North America
- 5.4.2. Europe
- 5.4.3. Asia Pacific
- 5.4.4. South America
- 5.4.5. Middle East
- 5.1. Market Analysis, Insights and Forecast - by Type
- 6. Global Non-Residential Accommodation Market Analysis, Insights and Forecast, 2021-2033
- 6.1. Market Analysis, Insights and Forecast - by Type
- 6.1.1. Hotels
- 6.1.2. Motels
- 6.1.3. Resorts
- 6.1.4. Vacation Rentals
- 6.1.5. Others
- 6.2. Market Analysis, Insights and Forecast - by End User
- 6.2.1. Leisure Travelers
- 6.2.2. Business Travelers
- 6.2.3. Group Travelers
- 6.3. Market Analysis, Insights and Forecast - by Distribution Channels
- 6.3.1. Hotel Websites
- 6.3.2. Online Travel Agencies (OTA)
- 6.3.3. Travel Management Companies (TMCs)
- 6.3.4. Corporate Travel Agents
- 6.1. Market Analysis, Insights and Forecast - by Type
- 7. North America Non-Residential Accommodation Market Analysis, Insights and Forecast, 2020-2032
- 7.1. Market Analysis, Insights and Forecast - by Type
- 7.1.1. Hotels
- 7.1.2. Motels
- 7.1.3. Resorts
- 7.1.4. Vacation Rentals
- 7.1.5. Others
- 7.2. Market Analysis, Insights and Forecast - by End User
- 7.2.1. Leisure Travelers
- 7.2.2. Business Travelers
- 7.2.3. Group Travelers
- 7.3. Market Analysis, Insights and Forecast - by Distribution Channels
- 7.3.1. Hotel Websites
- 7.3.2. Online Travel Agencies (OTA)
- 7.3.3. Travel Management Companies (TMCs)
- 7.3.4. Corporate Travel Agents
- 7.1. Market Analysis, Insights and Forecast - by Type
- 8. Europe Non-Residential Accommodation Market Analysis, Insights and Forecast, 2020-2032
- 8.1. Market Analysis, Insights and Forecast - by Type
- 8.1.1. Hotels
- 8.1.2. Motels
- 8.1.3. Resorts
- 8.1.4. Vacation Rentals
- 8.1.5. Others
- 8.2. Market Analysis, Insights and Forecast - by End User
- 8.2.1. Leisure Travelers
- 8.2.2. Business Travelers
- 8.2.3. Group Travelers
- 8.3. Market Analysis, Insights and Forecast - by Distribution Channels
- 8.3.1. Hotel Websites
- 8.3.2. Online Travel Agencies (OTA)
- 8.3.3. Travel Management Companies (TMCs)
- 8.3.4. Corporate Travel Agents
- 8.1. Market Analysis, Insights and Forecast - by Type
- 9. Asia Pacific Non-Residential Accommodation Market Analysis, Insights and Forecast, 2020-2032
- 9.1. Market Analysis, Insights and Forecast - by Type
- 9.1.1. Hotels
- 9.1.2. Motels
- 9.1.3. Resorts
- 9.1.4. Vacation Rentals
- 9.1.5. Others
- 9.2. Market Analysis, Insights and Forecast - by End User
- 9.2.1. Leisure Travelers
- 9.2.2. Business Travelers
- 9.2.3. Group Travelers
- 9.3. Market Analysis, Insights and Forecast - by Distribution Channels
- 9.3.1. Hotel Websites
- 9.3.2. Online Travel Agencies (OTA)
- 9.3.3. Travel Management Companies (TMCs)
- 9.3.4. Corporate Travel Agents
- 9.1. Market Analysis, Insights and Forecast - by Type
- 10. South America Non-Residential Accommodation Market Analysis, Insights and Forecast, 2020-2032
- 10.1. Market Analysis, Insights and Forecast - by Type
- 10.1.1. Hotels
- 10.1.2. Motels
- 10.1.3. Resorts
- 10.1.4. Vacation Rentals
- 10.1.5. Others
- 10.2. Market Analysis, Insights and Forecast - by End User
- 10.2.1. Leisure Travelers
- 10.2.2. Business Travelers
- 10.2.3. Group Travelers
- 10.3. Market Analysis, Insights and Forecast - by Distribution Channels
- 10.3.1. Hotel Websites
- 10.3.2. Online Travel Agencies (OTA)
- 10.3.3. Travel Management Companies (TMCs)
- 10.3.4. Corporate Travel Agents
- 10.1. Market Analysis, Insights and Forecast - by Type
- 11. Middle East Non-Residential Accommodation Market Analysis, Insights and Forecast, 2020-2032
- 11.1. Market Analysis, Insights and Forecast - by Type
- 11.1.1. Hotels
- 11.1.2. Motels
- 11.1.3. Resorts
- 11.1.4. Vacation Rentals
- 11.1.5. Others
- 11.2. Market Analysis, Insights and Forecast - by End User
- 11.2.1. Leisure Travelers
- 11.2.2. Business Travelers
- 11.2.3. Group Travelers
- 11.3. Market Analysis, Insights and Forecast - by Distribution Channels
- 11.3.1. Hotel Websites
- 11.3.2. Online Travel Agencies (OTA)
- 11.3.3. Travel Management Companies (TMCs)
- 11.3.4. Corporate Travel Agents
- 11.1. Market Analysis, Insights and Forecast - by Type
- 12. Competitive Analysis
- 12.1. Company Profiles
- 12.1.1 InterContinental Hotels Group
- 12.1.1.1. Company Overview
- 12.1.1.2. Products
- 12.1.1.3. Company Financials
- 12.1.1.4. SWOT Analysis
- 12.1.2 Hyatt Hotels Corporation
- 12.1.2.1. Company Overview
- 12.1.2.2. Products
- 12.1.2.3. Company Financials
- 12.1.2.4. SWOT Analysis
- 12.1.3 Marriott International
- 12.1.3.1. Company Overview
- 12.1.3.2. Products
- 12.1.3.3. Company Financials
- 12.1.3.4. SWOT Analysis
- 12.1.4 Four Seasons Hotels and Resorts**List Not Exhaustive
- 12.1.4.1. Company Overview
- 12.1.4.2. Products
- 12.1.4.3. Company Financials
- 12.1.4.4. SWOT Analysis
- 12.1.5 AccorHotels
- 12.1.5.1. Company Overview
- 12.1.5.2. Products
- 12.1.5.3. Company Financials
- 12.1.5.4. SWOT Analysis
- 12.1.6 Hilton Worldwide Holdings
- 12.1.6.1. Company Overview
- 12.1.6.2. Products
- 12.1.6.3. Company Financials
- 12.1.6.4. SWOT Analysis
- 12.1.7 MGM Resorts International
- 12.1.7.1. Company Overview
- 12.1.7.2. Products
- 12.1.7.3. Company Financials
- 12.1.7.4. SWOT Analysis
- 12.1.8 Starwood Hotels
- 12.1.8.1. Company Overview
- 12.1.8.2. Products
- 12.1.8.3. Company Financials
- 12.1.8.4. SWOT Analysis
- 12.1.9 Ctrip Com International Ltd
- 12.1.9.1. Company Overview
- 12.1.9.2. Products
- 12.1.9.3. Company Financials
- 12.1.9.4. SWOT Analysis
- 12.1.10 Rewe Group
- 12.1.10.1. Company Overview
- 12.1.10.2. Products
- 12.1.10.3. Company Financials
- 12.1.10.4. SWOT Analysis
- 12.1.1 InterContinental Hotels Group
- 12.2. Market Entropy
- 12.2.1 Company's Key Areas Served
- 12.2.2 Recent Developments
- 12.3. Company Market Share Analysis 2025
- 12.3.1 Top 5 Companies Market Share Analysis
- 12.3.2 Top 3 Companies Market Share Analysis
- 12.4. List of Potential Customers
- 13. Research Methodology
List of Figures
- Figure 1: Global Non-Residential Accommodation Market Revenue Breakdown (Million, %) by Region 2025 & 2033
- Figure 2: North America Non-Residential Accommodation Market Revenue (Million), by Type 2025 & 2033
- Figure 3: North America Non-Residential Accommodation Market Revenue Share (%), by Type 2025 & 2033
- Figure 4: North America Non-Residential Accommodation Market Revenue (Million), by End User 2025 & 2033
- Figure 5: North America Non-Residential Accommodation Market Revenue Share (%), by End User 2025 & 2033
- Figure 6: North America Non-Residential Accommodation Market Revenue (Million), by Distribution Channels 2025 & 2033
- Figure 7: North America Non-Residential Accommodation Market Revenue Share (%), by Distribution Channels 2025 & 2033
- Figure 8: North America Non-Residential Accommodation Market Revenue (Million), by Country 2025 & 2033
- Figure 9: North America Non-Residential Accommodation Market Revenue Share (%), by Country 2025 & 2033
- Figure 10: Europe Non-Residential Accommodation Market Revenue (Million), by Type 2025 & 2033
- Figure 11: Europe Non-Residential Accommodation Market Revenue Share (%), by Type 2025 & 2033
- Figure 12: Europe Non-Residential Accommodation Market Revenue (Million), by End User 2025 & 2033
- Figure 13: Europe Non-Residential Accommodation Market Revenue Share (%), by End User 2025 & 2033
- Figure 14: Europe Non-Residential Accommodation Market Revenue (Million), by Distribution Channels 2025 & 2033
- Figure 15: Europe Non-Residential Accommodation Market Revenue Share (%), by Distribution Channels 2025 & 2033
- Figure 16: Europe Non-Residential Accommodation Market Revenue (Million), by Country 2025 & 2033
- Figure 17: Europe Non-Residential Accommodation Market Revenue Share (%), by Country 2025 & 2033
- Figure 18: Asia Pacific Non-Residential Accommodation Market Revenue (Million), by Type 2025 & 2033
- Figure 19: Asia Pacific Non-Residential Accommodation Market Revenue Share (%), by Type 2025 & 2033
- Figure 20: Asia Pacific Non-Residential Accommodation Market Revenue (Million), by End User 2025 & 2033
- Figure 21: Asia Pacific Non-Residential Accommodation Market Revenue Share (%), by End User 2025 & 2033
- Figure 22: Asia Pacific Non-Residential Accommodation Market Revenue (Million), by Distribution Channels 2025 & 2033
- Figure 23: Asia Pacific Non-Residential Accommodation Market Revenue Share (%), by Distribution Channels 2025 & 2033
- Figure 24: Asia Pacific Non-Residential Accommodation Market Revenue (Million), by Country 2025 & 2033
- Figure 25: Asia Pacific Non-Residential Accommodation Market Revenue Share (%), by Country 2025 & 2033
- Figure 26: South America Non-Residential Accommodation Market Revenue (Million), by Type 2025 & 2033
- Figure 27: South America Non-Residential Accommodation Market Revenue Share (%), by Type 2025 & 2033
- Figure 28: South America Non-Residential Accommodation Market Revenue (Million), by End User 2025 & 2033
- Figure 29: South America Non-Residential Accommodation Market Revenue Share (%), by End User 2025 & 2033
- Figure 30: South America Non-Residential Accommodation Market Revenue (Million), by Distribution Channels 2025 & 2033
- Figure 31: South America Non-Residential Accommodation Market Revenue Share (%), by Distribution Channels 2025 & 2033
- Figure 32: South America Non-Residential Accommodation Market Revenue (Million), by Country 2025 & 2033
- Figure 33: South America Non-Residential Accommodation Market Revenue Share (%), by Country 2025 & 2033
- Figure 34: Middle East Non-Residential Accommodation Market Revenue (Million), by Type 2025 & 2033
- Figure 35: Middle East Non-Residential Accommodation Market Revenue Share (%), by Type 2025 & 2033
- Figure 36: Middle East Non-Residential Accommodation Market Revenue (Million), by End User 2025 & 2033
- Figure 37: Middle East Non-Residential Accommodation Market Revenue Share (%), by End User 2025 & 2033
- Figure 38: Middle East Non-Residential Accommodation Market Revenue (Million), by Distribution Channels 2025 & 2033
- Figure 39: Middle East Non-Residential Accommodation Market Revenue Share (%), by Distribution Channels 2025 & 2033
- Figure 40: Middle East Non-Residential Accommodation Market Revenue (Million), by Country 2025 & 2033
- Figure 41: Middle East Non-Residential Accommodation Market Revenue Share (%), by Country 2025 & 2033
List of Tables
- Table 1: Global Non-Residential Accommodation Market Revenue Million Forecast, by Type 2020 & 2033
- Table 2: Global Non-Residential Accommodation Market Revenue Million Forecast, by End User 2020 & 2033
- Table 3: Global Non-Residential Accommodation Market Revenue Million Forecast, by Distribution Channels 2020 & 2033
- Table 4: Global Non-Residential Accommodation Market Revenue Million Forecast, by Region 2020 & 2033
- Table 5: Global Non-Residential Accommodation Market Revenue Million Forecast, by Type 2020 & 2033
- Table 6: Global Non-Residential Accommodation Market Revenue Million Forecast, by End User 2020 & 2033
- Table 7: Global Non-Residential Accommodation Market Revenue Million Forecast, by Distribution Channels 2020 & 2033
- Table 8: Global Non-Residential Accommodation Market Revenue Million Forecast, by Country 2020 & 2033
- Table 9: Global Non-Residential Accommodation Market Revenue Million Forecast, by Type 2020 & 2033
- Table 10: Global Non-Residential Accommodation Market Revenue Million Forecast, by End User 2020 & 2033
- Table 11: Global Non-Residential Accommodation Market Revenue Million Forecast, by Distribution Channels 2020 & 2033
- Table 12: Global Non-Residential Accommodation Market Revenue Million Forecast, by Country 2020 & 2033
- Table 13: Global Non-Residential Accommodation Market Revenue Million Forecast, by Type 2020 & 2033
- Table 14: Global Non-Residential Accommodation Market Revenue Million Forecast, by End User 2020 & 2033
- Table 15: Global Non-Residential Accommodation Market Revenue Million Forecast, by Distribution Channels 2020 & 2033
- Table 16: Global Non-Residential Accommodation Market Revenue Million Forecast, by Country 2020 & 2033
- Table 17: Global Non-Residential Accommodation Market Revenue Million Forecast, by Type 2020 & 2033
- Table 18: Global Non-Residential Accommodation Market Revenue Million Forecast, by End User 2020 & 2033
- Table 19: Global Non-Residential Accommodation Market Revenue Million Forecast, by Distribution Channels 2020 & 2033
- Table 20: Global Non-Residential Accommodation Market Revenue Million Forecast, by Country 2020 & 2033
- Table 21: Global Non-Residential Accommodation Market Revenue Million Forecast, by Type 2020 & 2033
- Table 22: Global Non-Residential Accommodation Market Revenue Million Forecast, by End User 2020 & 2033
- Table 23: Global Non-Residential Accommodation Market Revenue Million Forecast, by Distribution Channels 2020 & 2033
- Table 24: Global Non-Residential Accommodation Market Revenue Million Forecast, by Country 2020 & 2033
Frequently Asked Questions
1. What is the projected Compound Annual Growth Rate (CAGR) of the Non-Residential Accommodation Market?
The projected CAGR is approximately > 12.00%.
2. Which companies are prominent players in the Non-Residential Accommodation Market?
Key companies in the market include InterContinental Hotels Group, Hyatt Hotels Corporation, Marriott International, Four Seasons Hotels and Resorts**List Not Exhaustive, AccorHotels, Hilton Worldwide Holdings, MGM Resorts International, Starwood Hotels, Ctrip Com International Ltd, Rewe Group.
3. What are the main segments of the Non-Residential Accommodation Market?
The market segments include Type, End User, Distribution Channels.
4. Can you provide details about the market size?
The market size is estimated to be USD XX Million as of 2022.
5. What are some drivers contributing to market growth?
Increased Demand for Unique and Personalized Travel Experiences; Rising Trend of Online Booking and Mobile Applications.
6. What are the notable trends driving market growth?
Technology Driven Services is Driving the Market.
7. Are there any restraints impacting market growth?
Competition from Other Alternative Accommodation Options Such as Vacation Rentals and Homestays; Seasonal Demand Fluctuations and Dependence on Tourism Industry.
8. Can you provide examples of recent developments in the market?
December 2022: Hilton Announced Continued Expansion of Waldorf Astoria Hotels & Resorts in the Caribbean and Latin America by signing a new hotel in San Miguel de Allende, Mexico.
9. What pricing options are available for accessing the report?
Pricing options include single-user, multi-user, and enterprise licenses priced at USD 4750, USD 5250, and USD 8750 respectively.
10. Is the market size provided in terms of value or volume?
The market size is provided in terms of value, measured in Million.
11. Are there any specific market keywords associated with the report?
Yes, the market keyword associated with the report is "Non-Residential Accommodation Market," which aids in identifying and referencing the specific market segment covered.
12. How do I determine which pricing option suits my needs best?
The pricing options vary based on user requirements and access needs. Individual users may opt for single-user licenses, while businesses requiring broader access may choose multi-user or enterprise licenses for cost-effective access to the report.
13. Are there any additional resources or data provided in the Non-Residential Accommodation Market report?
While the report offers comprehensive insights, it's advisable to review the specific contents or supplementary materials provided to ascertain if additional resources or data are available.
14. How can I stay updated on further developments or reports in the Non-Residential Accommodation Market?
To stay informed about further developments, trends, and reports in the Non-Residential Accommodation Market, consider subscribing to industry newsletters, following relevant companies and organizations, or regularly checking reputable industry news sources and publications.
Methodology
Step 1 - Identification of Relevant Samples Size from Population Database


Step 2 - Approaches for Defining Global Market Size (Value, Volume* & Price*)

Note*: In applicable scenarios
Step 3 - Data Sources
Primary Research
- Web Analytics
- Survey Reports
- Research Institute
- Latest Research Reports
- Opinion Leaders
Secondary Research
- Annual Reports
- White Paper
- Latest Press Release
- Industry Association
- Paid Database
- Investor Presentations

Step 4 - Data Triangulation
Involves using different sources of information in order to increase the validity of a study
These sources are likely to be stakeholders in a program - participants, other researchers, program staff, other community members, and so on.
Then we put all data in single framework & apply various statistical tools to find out the dynamic on the market.
During the analysis stage, feedback from the stakeholder groups would be compared to determine areas of agreement as well as areas of divergence