

Key Insights
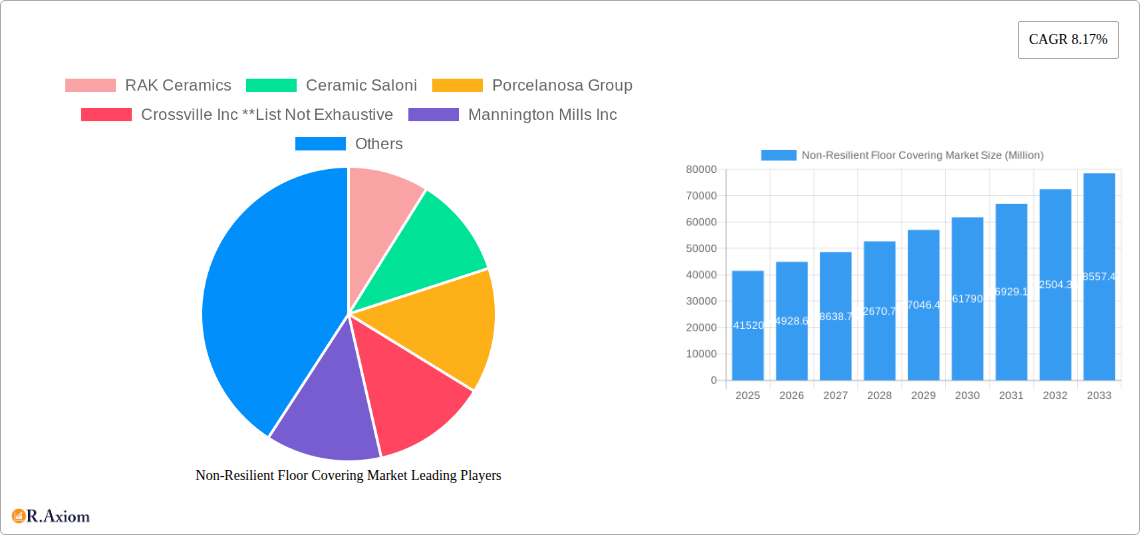
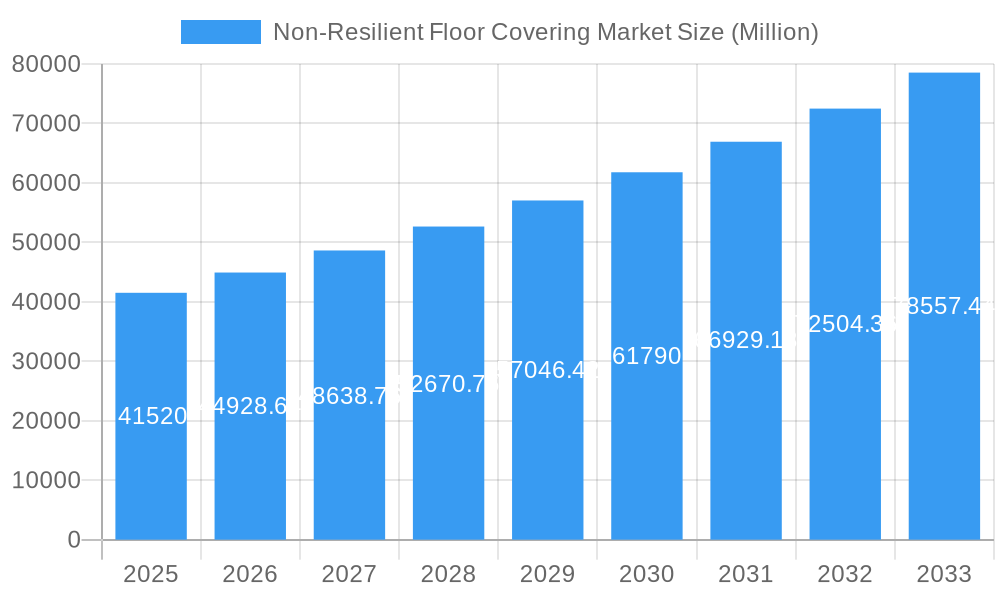
The Non-Resilient Floor Covering market, valued at $41.52 billion in 2025, is projected to experience robust growth, driven by a Compound Annual Growth Rate (CAGR) of 8.17% from 2025 to 2033. This expansion is fueled by several key factors. Increasing urbanization and construction activities globally are significantly boosting demand for durable and aesthetically pleasing flooring solutions. The burgeoning commercial sector, particularly in rapidly developing economies within Asia-Pacific and North America, is a primary driver. Furthermore, a growing preference for eco-friendly and sustainable flooring options, such as those made from recycled materials or with low VOC emissions, is shaping market trends. The rising disposable income levels in many regions are enabling consumers to invest in higher-quality, long-lasting floor coverings, further fueling market growth. Segment-wise, ceramic tiles consistently hold a dominant market share, owing to their versatility, durability, and relatively lower cost compared to other options like stone or wood tiles. However, laminate and wood tile flooring segments are witnessing strong growth due to increasing consumer demand for aesthetic appeal and design flexibility. The distribution channels are diversified, with home centers and specialty stores playing a crucial role in retail sales, while the contract channel caters primarily to large-scale commercial projects. Major players like RAK Ceramics, Porcelanosa Group, and Mohawk Industries are shaping market dynamics through product innovation, strategic partnerships, and geographical expansion.
Non-Resilient Floor Covering Market Market Size (In Billion)
The market faces some challenges, including fluctuations in raw material prices and the increasing competition from resilient flooring options. However, the long-term outlook remains positive, with continued growth anticipated throughout the forecast period. The market's geographical distribution reveals strong performance in North America and Europe, driven by established infrastructure and higher consumer spending. However, Asia-Pacific is expected to show significant growth potential in the coming years, fueled by rapid urbanization and rising construction activity. Sustained economic growth, coupled with innovative product development and effective marketing strategies, will be key to unlocking the full market potential in the years to come. Strategic collaborations, mergers and acquisitions are expected to further consolidate the market share of established players while creating opportunities for emerging players.
Non-Resilient Floor Covering Market Company Market Share
Non-Resilient Floor Covering Market: A Comprehensive Report (2019-2033)
This detailed report provides a comprehensive analysis of the Non-Resilient Floor Covering Market, offering invaluable insights for industry stakeholders. Covering the period from 2019 to 2033, with 2025 as the base year, this report delves into market dynamics, segmentation, leading players, and future growth prospects. The study meticulously examines various segments, including product type (Ceramic Tiles Flooring, Stone Tiles Flooring, Laminate Tiles Flooring, Wood Tiles Flooring, Others), distribution channels (Contract, Specialty Stores, Home Centers, Others), and end-users (Residential, Commercial). Key players like RAK Ceramics, Ceramic Saloni, Porcelanosa Group, Crossville Inc, Mannington Mills Inc, Shaw Industries Inc, Mohawk Industries Inc, Dal Tiles, China Ceramics, and Kajaria Ceramics are analyzed in detail.
Non-Resilient Floor Covering Market Concentration & Innovation
This section analyzes the market concentration, innovation drivers, regulatory frameworks, product substitutes, end-user trends, and M&A activities within the non-resilient floor covering market. The market exhibits a moderately concentrated landscape, with the top five players holding an estimated xx% market share in 2025. Innovation is primarily driven by advancements in material science, design aesthetics, and sustainable manufacturing practices. Stringent environmental regulations are pushing manufacturers towards eco-friendly production methods, while the increasing demand for durable and aesthetically pleasing flooring fuels innovation. Key product substitutes include resilient flooring options like vinyl and luxury vinyl tile (LVT), posing a competitive challenge. End-user trends show a growing preference for large-format tiles and personalized designs. M&A activities have been moderate, with deal values totaling approximately xx Million in the last five years. Specific deals included [Insert details of specific M&A deals, if available, otherwise state "Specific deal details unavailable"]. The overall landscape points to a dynamic market with increasing competition and a focus on sustainable and innovative products.
Non-Resilient Floor Covering Market Industry Trends & Insights
The Non-Resilient Floor Covering Market is experiencing significant growth, driven by robust infrastructure development, particularly in emerging economies, and rising disposable incomes leading to increased home renovation and construction activities. The market is projected to grow at a Compound Annual Growth Rate (CAGR) of xx% during the forecast period (2025-2033), reaching a market value of xx Million by 2033. Technological disruptions, such as the adoption of digital printing and advanced manufacturing techniques, are improving product quality, design flexibility, and efficiency. Consumer preferences are shifting towards eco-friendly, durable, and aesthetically appealing products, leading to increased demand for sustainable materials and innovative designs. Competitive dynamics are intense, with leading players focusing on product diversification, strategic partnerships, and technological advancements to maintain their market position. Market penetration of non-resilient flooring in the residential sector is estimated at xx%, while the commercial sector stands at xx%. This signifies substantial growth potential, particularly in emerging markets and specific segments.
Dominant Markets & Segments in Non-Resilient Floor Covering Market
The Non-Resilient Floor Covering Market demonstrates varied regional and segmental performance.
Dominant Segments:
- By Product: Ceramic tiles flooring holds the largest market share, driven by its affordability, durability, and diverse design options. Stone tiles flooring follows, appealing to the premium segment.
- By Distribution Channel: Home centers dominate the distribution network, facilitating broad market reach. Contract sales constitute a significant segment, particularly in commercial construction.
- By End-User: The residential segment represents the largest market share due to the increasing number of new constructions and renovations. The commercial segment is also significant and driven by large-scale projects.
Key Drivers:
- Residential: Rising disposable incomes, increased urbanization, and preferences for aesthetically pleasing and durable flooring are major driving forces.
- Commercial: Infrastructure development, particularly in emerging economies, and growing focus on creating modern and visually appealing commercial spaces.
- Economic Policies: Government initiatives promoting affordable housing and infrastructure development significantly impact market growth.
The dominance of specific regions varies based on the segment in question; further regional breakdown would require additional data.
Non-Resilient Floor Covering Market Product Developments
Recent product innovations focus on enhanced durability, water resistance, and aesthetically pleasing designs. Advanced digital printing technology allows for high-resolution images and intricate designs on tiles, enhancing customization options. Eco-friendly materials and manufacturing processes are gaining traction, aligning with sustainability trends. These developments improve the competitive advantage of manufacturers by providing superior product offerings and catering to the growing consumer demand for sustainable and aesthetically pleasing flooring.
Report Scope & Segmentation Analysis
This report comprehensively analyzes the Non-Resilient Floor Covering market, segmenting it by product type, distribution channel, and end-user.
By Product: The market is segmented into Ceramic Tiles Flooring, Stone Tiles Flooring, Laminate Tiles Flooring, Wood Tiles Flooring, and Others. Growth projections vary across segments, with ceramic tiles maintaining a strong lead due to cost-effectiveness.
By Distribution Channel: The market includes Contract, Specialty Stores, Home Centers, and Others channels. Home centers contribute significantly to market reach and overall sales.
By End-User: The report analyzes the Residential and Commercial end-user segments, with residential dominating due to housing construction and renovation activities. Commercial demand is robust due to construction projects. Competitive dynamics within each segment are influenced by product differentiation, pricing strategies, and brand reputation.
Key Drivers of Non-Resilient Floor Covering Market Growth
The Non-Resilient Floor Covering market is propelled by several key factors. First, the rapid growth of the construction industry globally fuels demand. Second, rising disposable incomes in developing nations, coupled with increasing urbanization, lead to higher spending on home improvements. Third, technological advancements, such as the introduction of large-format tiles and eco-friendly materials, enhance product appeal and expand the market. Lastly, supportive government policies promoting infrastructure development further contribute to market expansion.
Challenges in the Non-Resilient Floor Covering Market Sector
The Non-Resilient Floor Covering market faces certain challenges. Fluctuations in raw material prices can impact profitability, and the intense competition among established players leads to price wars and reduced margins. Moreover, stringent environmental regulations and increasing concerns about sustainability demand manufacturers to adopt eco-friendly practices, adding to production costs. Supply chain disruptions also pose challenges to the industry's smooth operation, potentially affecting product availability and delivery timelines.
Emerging Opportunities in Non-Resilient Floor Covering Market
Several opportunities exist for growth within the Non-Resilient Floor Covering market. The rising adoption of sustainable and eco-friendly materials presents a key opportunity for manufacturers to differentiate their products and appeal to environmentally conscious consumers. The growing demand for large-format tiles and customized designs offers potential for innovation and premium pricing. Expansion into emerging markets with high growth potential presents another significant opportunity for manufacturers.
Leading Players in the Non-Resilient Floor Covering Market Market
- RAK Ceramics
- Ceramic Saloni
- Porcelanosa Group
- Crossville Inc
- Mannington Mills Inc
- Shaw Industries Inc
- Mohawk Industries Inc
- Dal Tiles
- China Ceramics
- Kajaria Ceramics
Key Developments in Non-Resilient Floor Covering Market Industry
- February 2023: Daltile announced new tile collections for spring 2023, expanding product offerings and enhancing competitive positioning.
- March 2023: Encina and Shaw Industries partnered to recycle carpet waste, demonstrating a commitment to sustainability and influencing industry practices.
Strategic Outlook for Non-Resilient Floor Covering Market Market
The Non-Resilient Floor Covering Market is poised for continued growth, driven by the ongoing expansion of the construction industry, increasing disposable incomes, and technological advancements. Manufacturers who prioritize sustainability, innovation, and customer-centric approaches are likely to capture a larger market share. Focus on product differentiation, strategic partnerships, and efficient supply chain management will be crucial for sustained success in this dynamic and competitive market.
Non-Resilient Floor Covering Market Segmentation
-
1. Product
- 1.1. Ceramic Tiles Flooring
- 1.2. Stone Tiles Flooring
- 1.3. Laminate Tiles Flooring
- 1.4. Wood Tiles Flooring
- 1.5. Others
-
2. Distribution Channel
- 2.1. Contract
- 2.2. Specialty Stores
- 2.3. Home Centers
- 2.4. Others
-
3. End-User
- 3.1. Residential
- 3.2. Commercial
Non-Resilient Floor Covering Market Segmentation By Geography
-
1. North America
- 1.1. USA
- 1.2. Canada
- 1.3. Rest of North America
-
2. Europe
- 2.1. Germany
- 2.2. France
- 2.3. Italy
- 2.4. Spain
- 2.5. Rest of Europe
-
3. Asia Pacific
- 3.1. China
- 3.2. Japan
- 3.3. Australia
- 3.4. India
- 3.5. South Korea
- 3.6. Rest of Asia Pacific
-
4. Middle East and Africa
- 4.1. Saudi Arabia
- 4.2. Egypt
- 4.3. UAE
- 4.4. Rest of Middle East and Africa
-
5. South America
- 5.1. Argentina
- 5.2. Colombia
- 5.3. Rest of South America
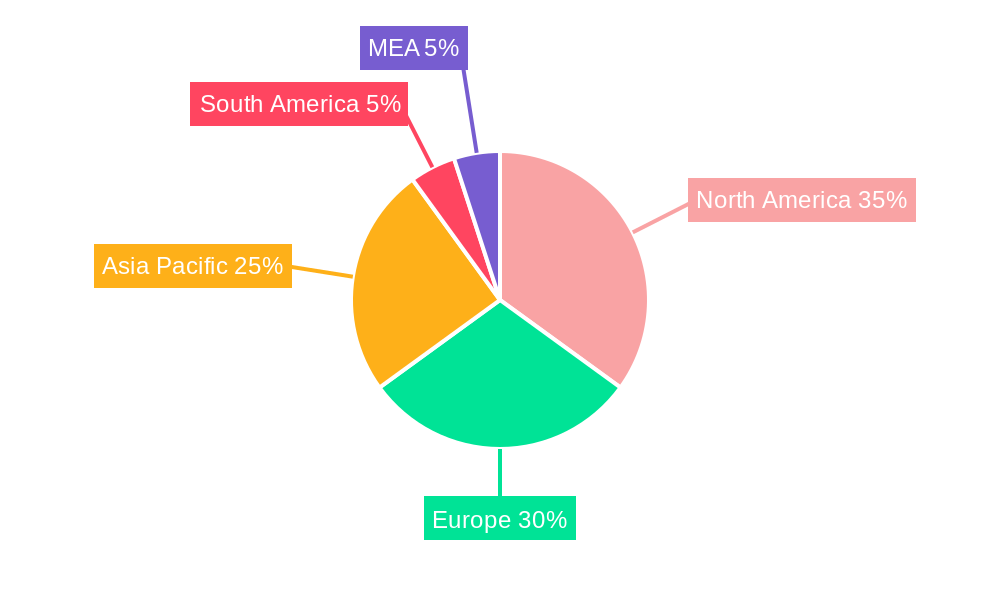
Non-Resilient Floor Covering Market Regional Market Share
Geographic Coverage of Non-Resilient Floor Covering Market
Non-Resilient Floor Covering Market REPORT HIGHLIGHTS
| Aspects | Details |
|---|---|
| Study Period | 2020-2034 |
| Base Year | 2025 |
| Estimated Year | 2026 |
| Forecast Period | 2026-2034 |
| Historical Period | 2020-2025 |
| Growth Rate | CAGR of 8.17% from 2020-2034 |
| Segmentation |
|
Table of Contents
- 1. Introduction
- 1.1. Research Scope
- 1.2. Market Segmentation
- 1.3. Research Objective
- 1.4. Definitions and Assumptions
- 2. Executive Summary
- 2.1. Market Snapshot
- 3. Market Dynamics
- 3.1. Market Drivers
- 3.2. Market Restrains
- 3.3. Market Trends
- 3.4. Market Opportunities
- 4. Market Factor Analysis
- 4.1. Porters Five Forces
- 4.1.1. Bargaining Power of Suppliers
- 4.1.2. Bargaining Power of Buyers
- 4.1.3. Threat of New Entrants
- 4.1.4. Threat of Substitutes
- 4.1.5. Competitive Rivalry
- 4.2. PESTEL analysis
- 4.3. BCG Analysis
- 4.3.1. Stars (High Growth, High Market Share)
- 4.3.2. Cash Cows (Low Growth, High Market Share)
- 4.3.3. Question Mark (High Growth, Low Market Share)
- 4.3.4. Dogs (Low Growth, Low Market Share)
- 4.4. Ansoff Matrix Analysis
- 4.5. Supply Chain Analysis
- 4.6. Regulatory Landscape
- 4.7. Current Market Potential and Opportunity Assessment (TAM–SAM–SOM Framework)
- 4.8. RAX Analyst Note
- 4.1. Porters Five Forces
- 5. Market Analysis, Insights and Forecast 2021-2033
- 5.1. Market Analysis, Insights and Forecast - by Product
- 5.1.1. Ceramic Tiles Flooring
- 5.1.2. Stone Tiles Flooring
- 5.1.3. Laminate Tiles Flooring
- 5.1.4. Wood Tiles Flooring
- 5.1.5. Others
- 5.2. Market Analysis, Insights and Forecast - by Distribution Channel
- 5.2.1. Contract
- 5.2.2. Specialty Stores
- 5.2.3. Home Centers
- 5.2.4. Others
- 5.3. Market Analysis, Insights and Forecast - by End-User
- 5.3.1. Residential
- 5.3.2. Commercial
- 5.4. Market Analysis, Insights and Forecast - by Region
- 5.4.1. North America
- 5.4.2. Europe
- 5.4.3. Asia Pacific
- 5.4.4. Middle East and Africa
- 5.4.5. South America
- 5.1. Market Analysis, Insights and Forecast - by Product
- 6. Global Non-Resilient Floor Covering Market Analysis, Insights and Forecast, 2021-2033
- 6.1. Market Analysis, Insights and Forecast - by Product
- 6.1.1. Ceramic Tiles Flooring
- 6.1.2. Stone Tiles Flooring
- 6.1.3. Laminate Tiles Flooring
- 6.1.4. Wood Tiles Flooring
- 6.1.5. Others
- 6.2. Market Analysis, Insights and Forecast - by Distribution Channel
- 6.2.1. Contract
- 6.2.2. Specialty Stores
- 6.2.3. Home Centers
- 6.2.4. Others
- 6.3. Market Analysis, Insights and Forecast - by End-User
- 6.3.1. Residential
- 6.3.2. Commercial
- 6.1. Market Analysis, Insights and Forecast - by Product
- 7. North America Non-Resilient Floor Covering Market Analysis, Insights and Forecast, 2020-2032
- 7.1. Market Analysis, Insights and Forecast - by Product
- 7.1.1. Ceramic Tiles Flooring
- 7.1.2. Stone Tiles Flooring
- 7.1.3. Laminate Tiles Flooring
- 7.1.4. Wood Tiles Flooring
- 7.1.5. Others
- 7.2. Market Analysis, Insights and Forecast - by Distribution Channel
- 7.2.1. Contract
- 7.2.2. Specialty Stores
- 7.2.3. Home Centers
- 7.2.4. Others
- 7.3. Market Analysis, Insights and Forecast - by End-User
- 7.3.1. Residential
- 7.3.2. Commercial
- 7.1. Market Analysis, Insights and Forecast - by Product
- 8. Europe Non-Resilient Floor Covering Market Analysis, Insights and Forecast, 2020-2032
- 8.1. Market Analysis, Insights and Forecast - by Product
- 8.1.1. Ceramic Tiles Flooring
- 8.1.2. Stone Tiles Flooring
- 8.1.3. Laminate Tiles Flooring
- 8.1.4. Wood Tiles Flooring
- 8.1.5. Others
- 8.2. Market Analysis, Insights and Forecast - by Distribution Channel
- 8.2.1. Contract
- 8.2.2. Specialty Stores
- 8.2.3. Home Centers
- 8.2.4. Others
- 8.3. Market Analysis, Insights and Forecast - by End-User
- 8.3.1. Residential
- 8.3.2. Commercial
- 8.1. Market Analysis, Insights and Forecast - by Product
- 9. Asia Pacific Non-Resilient Floor Covering Market Analysis, Insights and Forecast, 2020-2032
- 9.1. Market Analysis, Insights and Forecast - by Product
- 9.1.1. Ceramic Tiles Flooring
- 9.1.2. Stone Tiles Flooring
- 9.1.3. Laminate Tiles Flooring
- 9.1.4. Wood Tiles Flooring
- 9.1.5. Others
- 9.2. Market Analysis, Insights and Forecast - by Distribution Channel
- 9.2.1. Contract
- 9.2.2. Specialty Stores
- 9.2.3. Home Centers
- 9.2.4. Others
- 9.3. Market Analysis, Insights and Forecast - by End-User
- 9.3.1. Residential
- 9.3.2. Commercial
- 9.1. Market Analysis, Insights and Forecast - by Product
- 10. Middle East and Africa Non-Resilient Floor Covering Market Analysis, Insights and Forecast, 2020-2032
- 10.1. Market Analysis, Insights and Forecast - by Product
- 10.1.1. Ceramic Tiles Flooring
- 10.1.2. Stone Tiles Flooring
- 10.1.3. Laminate Tiles Flooring
- 10.1.4. Wood Tiles Flooring
- 10.1.5. Others
- 10.2. Market Analysis, Insights and Forecast - by Distribution Channel
- 10.2.1. Contract
- 10.2.2. Specialty Stores
- 10.2.3. Home Centers
- 10.2.4. Others
- 10.3. Market Analysis, Insights and Forecast - by End-User
- 10.3.1. Residential
- 10.3.2. Commercial
- 10.1. Market Analysis, Insights and Forecast - by Product
- 11. South America Non-Resilient Floor Covering Market Analysis, Insights and Forecast, 2020-2032
- 11.1. Market Analysis, Insights and Forecast - by Product
- 11.1.1. Ceramic Tiles Flooring
- 11.1.2. Stone Tiles Flooring
- 11.1.3. Laminate Tiles Flooring
- 11.1.4. Wood Tiles Flooring
- 11.1.5. Others
- 11.2. Market Analysis, Insights and Forecast - by Distribution Channel
- 11.2.1. Contract
- 11.2.2. Specialty Stores
- 11.2.3. Home Centers
- 11.2.4. Others
- 11.3. Market Analysis, Insights and Forecast - by End-User
- 11.3.1. Residential
- 11.3.2. Commercial
- 11.1. Market Analysis, Insights and Forecast - by Product
- 12. Competitive Analysis
- 12.1. Company Profiles
- 12.1.1 RAK Ceramics
- 12.1.1.1. Company Overview
- 12.1.1.2. Products
- 12.1.1.3. Company Financials
- 12.1.1.4. SWOT Analysis
- 12.1.2 Ceramic Saloni
- 12.1.2.1. Company Overview
- 12.1.2.2. Products
- 12.1.2.3. Company Financials
- 12.1.2.4. SWOT Analysis
- 12.1.3 Porcelanosa Group
- 12.1.3.1. Company Overview
- 12.1.3.2. Products
- 12.1.3.3. Company Financials
- 12.1.3.4. SWOT Analysis
- 12.1.4 Crossville Inc **List Not Exhaustive
- 12.1.4.1. Company Overview
- 12.1.4.2. Products
- 12.1.4.3. Company Financials
- 12.1.4.4. SWOT Analysis
- 12.1.5 Mannington Mills Inc
- 12.1.5.1. Company Overview
- 12.1.5.2. Products
- 12.1.5.3. Company Financials
- 12.1.5.4. SWOT Analysis
- 12.1.6 Shaw Industries Inc
- 12.1.6.1. Company Overview
- 12.1.6.2. Products
- 12.1.6.3. Company Financials
- 12.1.6.4. SWOT Analysis
- 12.1.7 Mohawk Industries Inc
- 12.1.7.1. Company Overview
- 12.1.7.2. Products
- 12.1.7.3. Company Financials
- 12.1.7.4. SWOT Analysis
- 12.1.8 Dal Tiles
- 12.1.8.1. Company Overview
- 12.1.8.2. Products
- 12.1.8.3. Company Financials
- 12.1.8.4. SWOT Analysis
- 12.1.9 China Ceramics
- 12.1.9.1. Company Overview
- 12.1.9.2. Products
- 12.1.9.3. Company Financials
- 12.1.9.4. SWOT Analysis
- 12.1.10 Kajaria Ceramics
- 12.1.10.1. Company Overview
- 12.1.10.2. Products
- 12.1.10.3. Company Financials
- 12.1.10.4. SWOT Analysis
- 12.1.1 RAK Ceramics
- 12.2. Market Entropy
- 12.2.1 Company's Key Areas Served
- 12.2.2 Recent Developments
- 12.3. Company Market Share Analysis 2025
- 12.3.1 Top 5 Companies Market Share Analysis
- 12.3.2 Top 3 Companies Market Share Analysis
- 12.4. List of Potential Customers
- 13. Research Methodology
List of Figures
- Figure 1: Global Non-Resilient Floor Covering Market Revenue Breakdown (Million, %) by Region 2025 & 2033
- Figure 2: North America Non-Resilient Floor Covering Market Revenue (Million), by Product 2025 & 2033
- Figure 3: North America Non-Resilient Floor Covering Market Revenue Share (%), by Product 2025 & 2033
- Figure 4: North America Non-Resilient Floor Covering Market Revenue (Million), by Distribution Channel 2025 & 2033
- Figure 5: North America Non-Resilient Floor Covering Market Revenue Share (%), by Distribution Channel 2025 & 2033
- Figure 6: North America Non-Resilient Floor Covering Market Revenue (Million), by End-User 2025 & 2033
- Figure 7: North America Non-Resilient Floor Covering Market Revenue Share (%), by End-User 2025 & 2033
- Figure 8: North America Non-Resilient Floor Covering Market Revenue (Million), by Country 2025 & 2033
- Figure 9: North America Non-Resilient Floor Covering Market Revenue Share (%), by Country 2025 & 2033
- Figure 10: Europe Non-Resilient Floor Covering Market Revenue (Million), by Product 2025 & 2033
- Figure 11: Europe Non-Resilient Floor Covering Market Revenue Share (%), by Product 2025 & 2033
- Figure 12: Europe Non-Resilient Floor Covering Market Revenue (Million), by Distribution Channel 2025 & 2033
- Figure 13: Europe Non-Resilient Floor Covering Market Revenue Share (%), by Distribution Channel 2025 & 2033
- Figure 14: Europe Non-Resilient Floor Covering Market Revenue (Million), by End-User 2025 & 2033
- Figure 15: Europe Non-Resilient Floor Covering Market Revenue Share (%), by End-User 2025 & 2033
- Figure 16: Europe Non-Resilient Floor Covering Market Revenue (Million), by Country 2025 & 2033
- Figure 17: Europe Non-Resilient Floor Covering Market Revenue Share (%), by Country 2025 & 2033
- Figure 18: Asia Pacific Non-Resilient Floor Covering Market Revenue (Million), by Product 2025 & 2033
- Figure 19: Asia Pacific Non-Resilient Floor Covering Market Revenue Share (%), by Product 2025 & 2033
- Figure 20: Asia Pacific Non-Resilient Floor Covering Market Revenue (Million), by Distribution Channel 2025 & 2033
- Figure 21: Asia Pacific Non-Resilient Floor Covering Market Revenue Share (%), by Distribution Channel 2025 & 2033
- Figure 22: Asia Pacific Non-Resilient Floor Covering Market Revenue (Million), by End-User 2025 & 2033
- Figure 23: Asia Pacific Non-Resilient Floor Covering Market Revenue Share (%), by End-User 2025 & 2033
- Figure 24: Asia Pacific Non-Resilient Floor Covering Market Revenue (Million), by Country 2025 & 2033
- Figure 25: Asia Pacific Non-Resilient Floor Covering Market Revenue Share (%), by Country 2025 & 2033
- Figure 26: Middle East and Africa Non-Resilient Floor Covering Market Revenue (Million), by Product 2025 & 2033
- Figure 27: Middle East and Africa Non-Resilient Floor Covering Market Revenue Share (%), by Product 2025 & 2033
- Figure 28: Middle East and Africa Non-Resilient Floor Covering Market Revenue (Million), by Distribution Channel 2025 & 2033
- Figure 29: Middle East and Africa Non-Resilient Floor Covering Market Revenue Share (%), by Distribution Channel 2025 & 2033
- Figure 30: Middle East and Africa Non-Resilient Floor Covering Market Revenue (Million), by End-User 2025 & 2033
- Figure 31: Middle East and Africa Non-Resilient Floor Covering Market Revenue Share (%), by End-User 2025 & 2033
- Figure 32: Middle East and Africa Non-Resilient Floor Covering Market Revenue (Million), by Country 2025 & 2033
- Figure 33: Middle East and Africa Non-Resilient Floor Covering Market Revenue Share (%), by Country 2025 & 2033
- Figure 34: South America Non-Resilient Floor Covering Market Revenue (Million), by Product 2025 & 2033
- Figure 35: South America Non-Resilient Floor Covering Market Revenue Share (%), by Product 2025 & 2033
- Figure 36: South America Non-Resilient Floor Covering Market Revenue (Million), by Distribution Channel 2025 & 2033
- Figure 37: South America Non-Resilient Floor Covering Market Revenue Share (%), by Distribution Channel 2025 & 2033
- Figure 38: South America Non-Resilient Floor Covering Market Revenue (Million), by End-User 2025 & 2033
- Figure 39: South America Non-Resilient Floor Covering Market Revenue Share (%), by End-User 2025 & 2033
- Figure 40: South America Non-Resilient Floor Covering Market Revenue (Million), by Country 2025 & 2033
- Figure 41: South America Non-Resilient Floor Covering Market Revenue Share (%), by Country 2025 & 2033
List of Tables
- Table 1: Global Non-Resilient Floor Covering Market Revenue Million Forecast, by Product 2020 & 2033
- Table 2: Global Non-Resilient Floor Covering Market Revenue Million Forecast, by Distribution Channel 2020 & 2033
- Table 3: Global Non-Resilient Floor Covering Market Revenue Million Forecast, by End-User 2020 & 2033
- Table 4: Global Non-Resilient Floor Covering Market Revenue Million Forecast, by Region 2020 & 2033
- Table 5: Global Non-Resilient Floor Covering Market Revenue Million Forecast, by Product 2020 & 2033
- Table 6: Global Non-Resilient Floor Covering Market Revenue Million Forecast, by Distribution Channel 2020 & 2033
- Table 7: Global Non-Resilient Floor Covering Market Revenue Million Forecast, by End-User 2020 & 2033
- Table 8: Global Non-Resilient Floor Covering Market Revenue Million Forecast, by Country 2020 & 2033
- Table 9: USA Non-Resilient Floor Covering Market Revenue (Million) Forecast, by Application 2020 & 2033
- Table 10: Canada Non-Resilient Floor Covering Market Revenue (Million) Forecast, by Application 2020 & 2033
- Table 11: Rest of North America Non-Resilient Floor Covering Market Revenue (Million) Forecast, by Application 2020 & 2033
- Table 12: Global Non-Resilient Floor Covering Market Revenue Million Forecast, by Product 2020 & 2033
- Table 13: Global Non-Resilient Floor Covering Market Revenue Million Forecast, by Distribution Channel 2020 & 2033
- Table 14: Global Non-Resilient Floor Covering Market Revenue Million Forecast, by End-User 2020 & 2033
- Table 15: Global Non-Resilient Floor Covering Market Revenue Million Forecast, by Country 2020 & 2033
- Table 16: Germany Non-Resilient Floor Covering Market Revenue (Million) Forecast, by Application 2020 & 2033
- Table 17: France Non-Resilient Floor Covering Market Revenue (Million) Forecast, by Application 2020 & 2033
- Table 18: Italy Non-Resilient Floor Covering Market Revenue (Million) Forecast, by Application 2020 & 2033
- Table 19: Spain Non-Resilient Floor Covering Market Revenue (Million) Forecast, by Application 2020 & 2033
- Table 20: Rest of Europe Non-Resilient Floor Covering Market Revenue (Million) Forecast, by Application 2020 & 2033
- Table 21: Global Non-Resilient Floor Covering Market Revenue Million Forecast, by Product 2020 & 2033
- Table 22: Global Non-Resilient Floor Covering Market Revenue Million Forecast, by Distribution Channel 2020 & 2033
- Table 23: Global Non-Resilient Floor Covering Market Revenue Million Forecast, by End-User 2020 & 2033
- Table 24: Global Non-Resilient Floor Covering Market Revenue Million Forecast, by Country 2020 & 2033
- Table 25: China Non-Resilient Floor Covering Market Revenue (Million) Forecast, by Application 2020 & 2033
- Table 26: Japan Non-Resilient Floor Covering Market Revenue (Million) Forecast, by Application 2020 & 2033
- Table 27: Australia Non-Resilient Floor Covering Market Revenue (Million) Forecast, by Application 2020 & 2033
- Table 28: India Non-Resilient Floor Covering Market Revenue (Million) Forecast, by Application 2020 & 2033
- Table 29: South Korea Non-Resilient Floor Covering Market Revenue (Million) Forecast, by Application 2020 & 2033
- Table 30: Rest of Asia Pacific Non-Resilient Floor Covering Market Revenue (Million) Forecast, by Application 2020 & 2033
- Table 31: Global Non-Resilient Floor Covering Market Revenue Million Forecast, by Product 2020 & 2033
- Table 32: Global Non-Resilient Floor Covering Market Revenue Million Forecast, by Distribution Channel 2020 & 2033
- Table 33: Global Non-Resilient Floor Covering Market Revenue Million Forecast, by End-User 2020 & 2033
- Table 34: Global Non-Resilient Floor Covering Market Revenue Million Forecast, by Country 2020 & 2033
- Table 35: Saudi Arabia Non-Resilient Floor Covering Market Revenue (Million) Forecast, by Application 2020 & 2033
- Table 36: Egypt Non-Resilient Floor Covering Market Revenue (Million) Forecast, by Application 2020 & 2033
- Table 37: UAE Non-Resilient Floor Covering Market Revenue (Million) Forecast, by Application 2020 & 2033
- Table 38: Rest of Middle East and Africa Non-Resilient Floor Covering Market Revenue (Million) Forecast, by Application 2020 & 2033
- Table 39: Global Non-Resilient Floor Covering Market Revenue Million Forecast, by Product 2020 & 2033
- Table 40: Global Non-Resilient Floor Covering Market Revenue Million Forecast, by Distribution Channel 2020 & 2033
- Table 41: Global Non-Resilient Floor Covering Market Revenue Million Forecast, by End-User 2020 & 2033
- Table 42: Global Non-Resilient Floor Covering Market Revenue Million Forecast, by Country 2020 & 2033
- Table 43: Argentina Non-Resilient Floor Covering Market Revenue (Million) Forecast, by Application 2020 & 2033
- Table 44: Colombia Non-Resilient Floor Covering Market Revenue (Million) Forecast, by Application 2020 & 2033
- Table 45: Rest of South America Non-Resilient Floor Covering Market Revenue (Million) Forecast, by Application 2020 & 2033
Frequently Asked Questions
1. What is the projected Compound Annual Growth Rate (CAGR) of the Non-Resilient Floor Covering Market?
The projected CAGR is approximately 8.17%.
2. Which companies are prominent players in the Non-Resilient Floor Covering Market?
Key companies in the market include RAK Ceramics, Ceramic Saloni, Porcelanosa Group, Crossville Inc **List Not Exhaustive, Mannington Mills Inc, Shaw Industries Inc, Mohawk Industries Inc, Dal Tiles, China Ceramics, Kajaria Ceramics.
3. What are the main segments of the Non-Resilient Floor Covering Market?
The market segments include Product, Distribution Channel, End-User.
4. Can you provide details about the market size?
The market size is estimated to be USD 41.52 Million as of 2022.
5. What are some drivers contributing to market growth?
Rising Disposable Income is Driving the Market.
6. What are the notable trends driving market growth?
Ceramic Tile Segment Drives the Market.
7. Are there any restraints impacting market growth?
Price Volatility of Raw Manufacturers; Economic Fluctuations and Consumer Purchasing Power.
8. Can you provide examples of recent developments in the market?
March 2023: Encina and Shaw Industries partnered with Carpet Waste Recycling. Under the agreement, Shaw will annually provide Encina with more than 2 million pounds of waste materials from its carpet manufacturing processes.
9. What pricing options are available for accessing the report?
Pricing options include single-user, multi-user, and enterprise licenses priced at USD 4750, USD 5250, and USD 8750 respectively.
10. Is the market size provided in terms of value or volume?
The market size is provided in terms of value, measured in Million.
11. Are there any specific market keywords associated with the report?
Yes, the market keyword associated with the report is "Non-Resilient Floor Covering Market," which aids in identifying and referencing the specific market segment covered.
12. How do I determine which pricing option suits my needs best?
The pricing options vary based on user requirements and access needs. Individual users may opt for single-user licenses, while businesses requiring broader access may choose multi-user or enterprise licenses for cost-effective access to the report.
13. Are there any additional resources or data provided in the Non-Resilient Floor Covering Market report?
While the report offers comprehensive insights, it's advisable to review the specific contents or supplementary materials provided to ascertain if additional resources or data are available.
14. How can I stay updated on further developments or reports in the Non-Resilient Floor Covering Market?
To stay informed about further developments, trends, and reports in the Non-Resilient Floor Covering Market, consider subscribing to industry newsletters, following relevant companies and organizations, or regularly checking reputable industry news sources and publications.
Methodology
Step 1 - Identification of Relevant Samples Size from Population Database


Step 2 - Approaches for Defining Global Market Size (Value, Volume* & Price*)

Note*: In applicable scenarios
Step 3 - Data Sources
Primary Research
- Web Analytics
- Survey Reports
- Research Institute
- Latest Research Reports
- Opinion Leaders
Secondary Research
- Annual Reports
- White Paper
- Latest Press Release
- Industry Association
- Paid Database
- Investor Presentations

Step 4 - Data Triangulation
Involves using different sources of information in order to increase the validity of a study
These sources are likely to be stakeholders in a program - participants, other researchers, program staff, other community members, and so on.
Then we put all data in single framework & apply various statistical tools to find out the dynamic on the market.
During the analysis stage, feedback from the stakeholder groups would be compared to determine areas of agreement as well as areas of divergence