

Key Insights
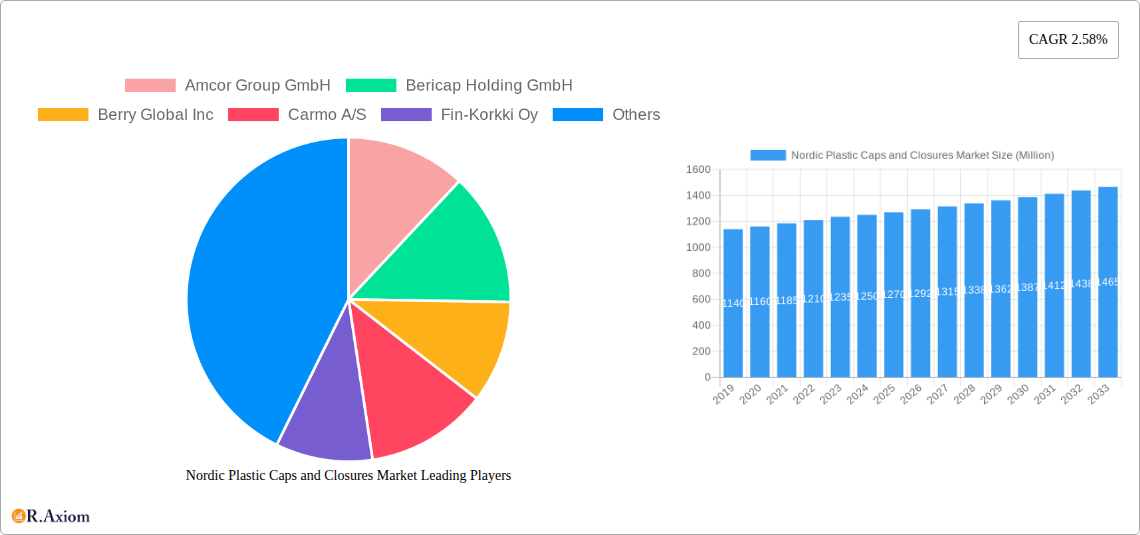
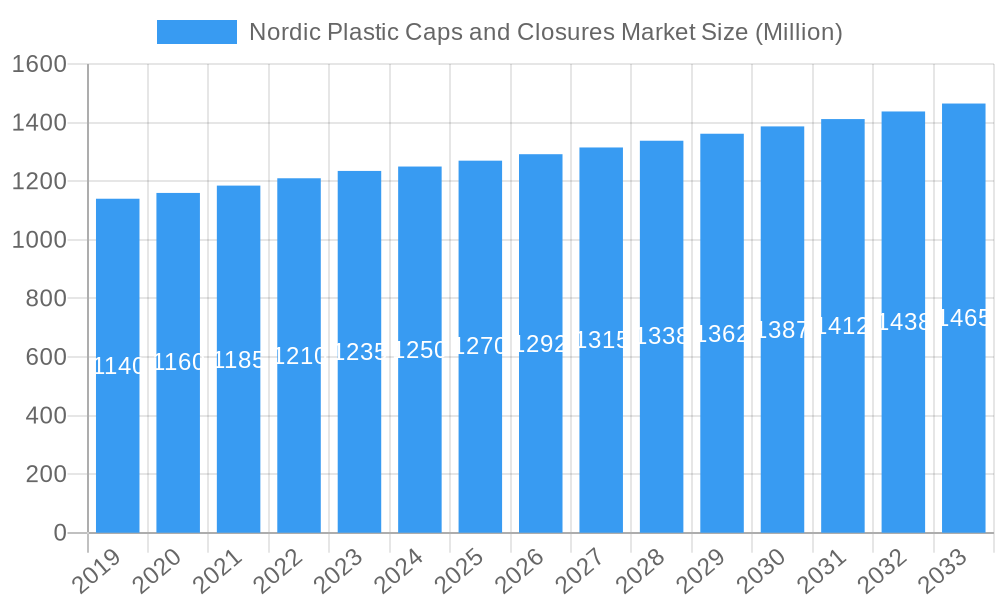
The Nordic Plastic Caps and Closures Market is poised for steady expansion, driven by robust demand across key end-user industries. With a current market size estimated at $1.25 billion and a projected Compound Annual Growth Rate (CAGR) of 2.58%, the market is expected to reach approximately $1.60 billion by 2033. This growth is underpinned by the increasing consumption of packaged goods, particularly in the food, beverage, and personal care sectors, where secure and convenient packaging solutions are paramount. The prevalence of bottled water, carbonated soft drinks, and various beverages within the Nordic region significantly contributes to the demand for specialized caps and closures. Furthermore, the rising consumer preference for products with enhanced safety features, such as child-resistant closures, is a key growth accelerant. The market's strength is also amplified by the continuous innovation in materials and design, with Polyethylene (PE), Polyethylene Terephthalate (PET), and Polypropylene (PP) remaining dominant resin types, offering a balance of cost-effectiveness and performance.
Nordic Plastic Caps and Closures Market Market Size (In Billion)
The competitive landscape in the Nordic Plastic Caps and Closures Market is characterized by the presence of both established global players and emerging regional manufacturers. Companies like Amcor Group GmbH, Bericap Holding GmbH, and Berry Global Inc. are actively shaping the market through strategic investments in capacity expansion and product development. The market's trajectory is influenced by evolving consumer preferences for sustainable packaging solutions, prompting manufacturers to invest in recyclable and biodegradable materials. While the overall market presents a positive outlook, potential restraints could include fluctuating raw material prices and stringent environmental regulations that may impact production costs. However, the strong demand for specialized product types like dispensing caps and screw caps, coupled with the widespread adoption across diverse end-user industries in the Nordic region, is expected to largely mitigate these challenges, ensuring sustained market growth.
Nordic Plastic Caps and Closures Market Company Market Share
This in-depth market research report provides a comprehensive analysis of the Nordic plastic caps and closures market, covering the historical period (2019–2024), base year (2025), estimated year (2025), and forecast period (2025–2033). The report delves into market concentration, innovation drivers, regulatory frameworks, product substitutes, end-user trends, and M&A activities, offering valuable insights for industry stakeholders including manufacturers, suppliers, and investors. With a projected market size of USD XXX Million by 2033, driven by robust CAGR, this report highlights key market segments, dominant regions, and emerging opportunities, offering strategic guidance for navigating this dynamic sector.
Nordic Plastic Caps and Closures Market Market Concentration & Innovation
The Nordic plastic caps and closures market exhibits a moderate level of concentration, with leading players like Amcor Group GmbH, Bericap Holding GmbH, and Berry Global Inc. holding significant market share. Innovation is a key differentiator, driven by advancements in material science, sustainable packaging solutions, and the demand for enhanced functionality such as child-resistance and tamper-evidence. Regulatory frameworks, particularly those focused on environmental sustainability and food safety, play a crucial role in shaping product development and market access. The threat of product substitutes, such as metal closures or alternative packaging formats, exists but is mitigated by the cost-effectiveness and versatility of plastic solutions. End-user trends, including the growing demand for convenience and premiumization in the beverage and personal care sectors, are significant growth catalysts. Mergers and acquisitions (M&A) activity is expected to remain a strategic tool for market consolidation and expansion, with deal values anticipated to reflect the market's growth trajectory. For instance, a recent M&A transaction in the region, valued at approximately USD XX Million, underscores the ongoing consolidation efforts.
Nordic Plastic Caps and Closures Market Industry Trends & Insights
The Nordic plastic caps and closures market is poised for substantial growth, projected to expand at a Compound Annual Growth Rate (CAGR) of approximately XX% during the forecast period. This expansion is fueled by a confluence of factors including a rising disposable income in Nordic countries, a growing preference for convenient and portable packaging solutions, and an increasing demand for sustainable and eco-friendly plastic alternatives. The beverage industry, particularly bottled water and carbonated soft drinks, continues to be a dominant end-user, driven by changing consumer lifestyles and the need for safe and reliable packaging. Technological disruptions, such as the adoption of advanced molding techniques and the integration of smart features in closures for traceability and authentication, are reshaping the competitive landscape. Consumer preferences are increasingly leaning towards lightweight, easy-to-open, and aesthetically pleasing closures that enhance the overall product experience. Furthermore, the growing emphasis on circular economy principles is pushing manufacturers to invest in recycled content and biodegradable materials for their plastic caps and closures. The market penetration of advanced closure technologies, such as tamper-evident seals and child-resistant mechanisms, is steadily increasing across various end-user industries, reflecting a heightened focus on product safety and consumer well-being. The competitive dynamics are characterized by innovation in design, material sourcing, and cost optimization, with established players leveraging their scale and emerging companies focusing on niche solutions and sustainability.
Dominant Markets & Segments in Nordic Plastic Caps and Closures Market
The Nordic plastic caps and closures market is characterized by the dominance of specific resins, product types, and end-user industries, driven by distinct economic and consumer preferences across the region.
Resin Dominance: Polyethylene (PE) and Polypropylene (PP) are the most dominant resins in the Nordic market due to their cost-effectiveness, versatility, and excellent barrier properties.
- Polyethylene (PE): Its flexibility and chemical resistance make it ideal for a wide range of applications, particularly in household chemicals and some food packaging. The market share of PE is estimated at approximately XX% in 2025.
- Polypropylene (PP): Known for its rigidity, heat resistance, and excellent sealability, PP holds a significant share, especially in beverage and personal care applications. Its market share is projected to be around XX% in 2025.
- Polyethylene Terephthalate (PET): While primarily used for bottles, PET-based closures are also prevalent, especially for carbonated beverages, offering high clarity and good mechanical strength.
- Other Plastics: This segment, including materials like HDPE and LDPE, caters to specialized applications requiring specific properties.
Product Type Leadership: Threaded screw caps and dispensing closures are leading product types, reflecting the demand for ease of use and controlled product delivery.
- Threaded - Screw Caps: This category dominates due to its universal application across numerous beverage, food, and household products. Its market share is estimated to be around XX% in 2025.
- Dispensing Closures: Driven by the personal care and household chemical industries, these closures offer controlled pouring and application, contributing significantly to market value.
- Child-Resistant Closures: Regulatory requirements and consumer safety concerns are boosting the demand for child-resistant caps, particularly in the pharmaceutical and household chemical sectors.
- Vacuum Closures: Essential for food preservation, these closures maintain product integrity and extend shelf life, holding a steady market presence.
End-User Industry Impact: The Food and Beverage sector, followed by Personal Care and Cosmetics, are the primary drivers of demand for plastic caps and closures in the Nordics.
- Beverage Industry: This is the largest consumer, with Bottled Water and Carbonated Soft Drinks leading consumption. The convenience and portability offered by bottled beverages are key growth factors. The beverage segment's market share is expected to reach XX% in 2025.
- Personal Care and Cosmetics: The growing demand for premium beauty and personal hygiene products, along with the trend towards smaller, portable packaging, significantly drives the need for specialized and aesthetically appealing closures.
- Household Chemicals: Safety features like child-resistance and leak-proof designs are paramount in this segment, ensuring secure packaging for detergents, cleaning agents, and other household products.
- Other End-User Industries: This includes pharmaceuticals, industrial chemicals, and other niche applications, contributing a smaller but growing portion of the market.
Nordic Plastic Caps and Closures Market Product Developments
Recent product developments in the Nordic plastic caps and closures market highlight a strong focus on sustainability, lightweighting, and enhanced functionality. Companies are actively innovating to meet evolving consumer preferences and stringent environmental regulations. For instance, the introduction of the Slimline range by Berry Global Inc., crafted from PE and PP materials, exemplifies the trend towards lightweight tube closures that reduce material consumption without compromising performance. This innovation caters to the growing personal care and pharmaceutical markets, offering improved aesthetics and user experience. Such developments are crucial for maintaining a competitive edge and capturing market share in an increasingly eco-conscious environment.
Report Scope & Segmentation Analysis
This report offers an exhaustive analysis of the Nordic plastic caps and closures market, segmented by Resin (Polyethylene (PE), Polyethylene Terephthalate (PET), Polypropylene (PP), Other Plastics), Product Type (Threaded - Screw Caps, Vacuum, Dispensing, Unthread, Child-resistant), and End-user Industries (Food, Beverage (Bottled Water, Carbonated Soft Drinks, Alcoholic Beverages, Juices and Energy Drinks, Other Beverages), Personal Care and Cosmetics, Household Chemicals, Other End-user Industries). The market size for each segment is projected to witness varying growth rates, with the Beverage sector expected to maintain its leading position. For example, the Polyethylene (PE) resin segment is anticipated to grow at a CAGR of XX% during the forecast period, driven by its widespread application in everyday consumer products.
Key Drivers of Nordic Plastic Caps and Closures Market Growth
The growth of the Nordic plastic caps and closures market is propelled by several key drivers. The increasing consumer demand for convenience and portability in beverages and personal care products directly fuels the need for reliable and user-friendly caps and closures. Furthermore, stringent regulations mandating child-resistant and tamper-evident features in specific product categories, such as household chemicals and pharmaceuticals, are creating sustained demand. Technological advancements in material science and manufacturing processes are enabling the development of lighter, more durable, and aesthetically pleasing closures, enhancing product appeal. The growing emphasis on sustainability and the circular economy is also a significant driver, pushing for the adoption of recycled content and eco-friendly materials in plastic cap and closure production.
Challenges in the Nordic Plastic Caps and Closures Market Sector
Despite the robust growth, the Nordic plastic caps and closures market faces several challenges. Fluctuations in raw material prices, particularly for petroleum-based resins, can impact manufacturing costs and profitability. The increasing regulatory pressure regarding plastic waste and environmental sustainability necessitates significant investment in research and development for biodegradable and recyclable alternatives. Supply chain disruptions, influenced by geopolitical events and global logistics, can affect the timely delivery of raw materials and finished products. Intense competition among both established global players and smaller local manufacturers leads to price sensitivity and the need for continuous innovation and cost optimization to maintain market share.
Emerging Opportunities in Nordic Plastic Caps and Closures Market
Emerging opportunities within the Nordic plastic caps and closures market are primarily centered around sustainability, digitalization, and niche applications. The growing consumer and regulatory push for eco-friendly packaging presents a significant opportunity for manufacturers developing biodegradable, compostable, and highly recyclable plastic closures made from post-consumer recycled (PCR) content. The integration of smart technologies, such as QR codes or NFC tags on closures for product authentication and supply chain traceability, is another burgeoning area. Furthermore, the expanding e-commerce sector is creating demand for specialized closures that ensure product integrity during transit. The rising popularity of functional beverages and premium personal care products also opens avenues for innovative dispensing and aesthetic closure designs.
Leading Players in the Nordic Plastic Caps and Closures Market Market
- Amcor Group GmbH
- Bericap Holding GmbH
- Berry Global Inc
- Carmo A/S
- Fin-Korkki Oy
- Modulpac AB
- Tetra Pak International SV
- Robinson PLC
Key Developments in Nordic Plastic Caps and Closures Market Industry
- February 2024: Robinson PLC, a UK-based company operating in Denmark, exhibited its products at Packaging Innovations and Empack, hosted at Birmingham's National Exhibition Centre (NEC).
- October 2023: Berry Global Inc., a US-based company with operations in Finland and Denmark, has introduced the Slimline range, a lightweight tube closure solution. This range, crafted from PE and PP materials, spans diameters from 35 mm to 50 mm. The Slimline's design caters to diverse personal care and pharmaceutical uses, including skin care, body wash, and hair care.
Strategic Outlook for Nordic Plastic Caps and Closures Market Market
The strategic outlook for the Nordic plastic caps and closures market is marked by sustained growth, driven by a dual focus on innovation and sustainability. Companies that can effectively leverage advanced manufacturing technologies to produce cost-efficient, high-performance closures while simultaneously investing in eco-friendly materials and designs will be best positioned for success. The increasing demand for tamper-evident and child-resistant closures will continue to be a significant market catalyst. Strategic partnerships and collaborations aimed at developing novel sustainable solutions and expanding market reach, particularly in the burgeoning personal care and functional beverage segments, will be crucial for future growth and market leadership in this dynamic region.
Nordic Plastic Caps and Closures Market Segmentation
-
1. Resin
- 1.1. Polyethylene (PE)
- 1.2. Polyethylene Terephthalate (PET)
- 1.3. Polypropylene (PP)
- 1.4. Other Pl
-
2. Product Type
- 2.1. Threaded - Screw Caps, Vacuum, etc.
- 2.2. Dispensing
- 2.3. Unthread
- 2.4. Child-resistant
-
3. End-user Industries
- 3.1. Food
-
3.2. Beverage
- 3.2.1. Bottled Water
- 3.2.2. Carbonated Soft Drinks
- 3.2.3. Alcoholic Beverages
- 3.2.4. Juices and Energy Drinks
- 3.2.5. Other Beverages
- 3.3. Personal Care and Cosmetics
- 3.4. Household Chemicals
- 3.5. Other End-user Industries
Nordic Plastic Caps and Closures Market Segmentation By Geography
-
1. North America
- 1.1. United States
- 1.2. Canada
- 1.3. Mexico
-
2. South America
- 2.1. Brazil
- 2.2. Argentina
- 2.3. Rest of South America
-
3. Europe
- 3.1. United Kingdom
- 3.2. Germany
- 3.3. France
- 3.4. Italy
- 3.5. Spain
- 3.6. Russia
- 3.7. Benelux
- 3.8. Nordics
- 3.9. Rest of Europe
-
4. Middle East & Africa
- 4.1. Turkey
- 4.2. Israel
- 4.3. GCC
- 4.4. North Africa
- 4.5. South Africa
- 4.6. Rest of Middle East & Africa
-
5. Asia Pacific
- 5.1. China
- 5.2. India
- 5.3. Japan
- 5.4. South Korea
- 5.5. ASEAN
- 5.6. Oceania
- 5.7. Rest of Asia Pacific
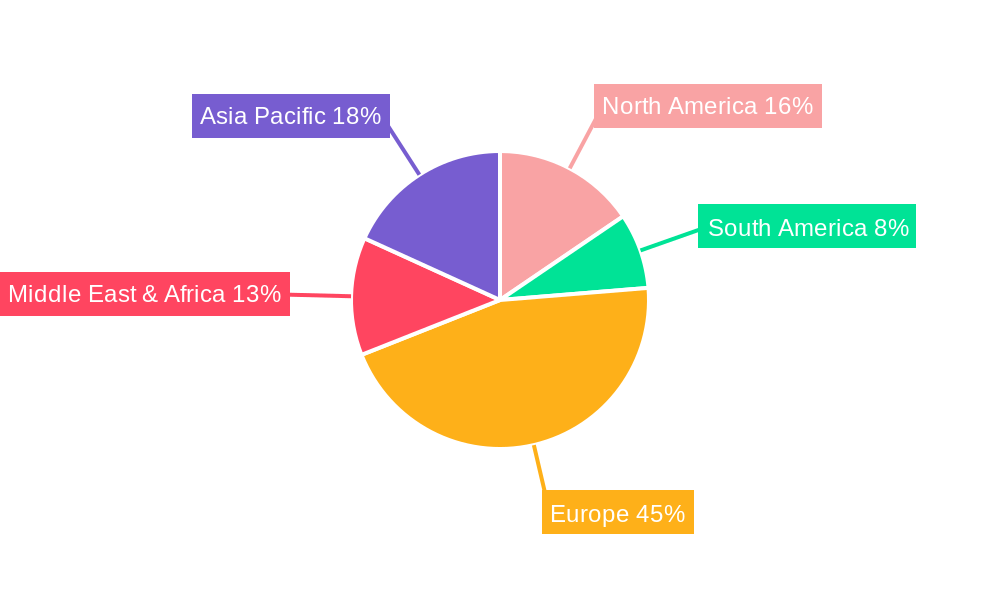
Nordic Plastic Caps and Closures Market Regional Market Share
Geographic Coverage of Nordic Plastic Caps and Closures Market
Nordic Plastic Caps and Closures Market REPORT HIGHLIGHTS
| Aspects | Details |
|---|---|
| Study Period | 2020-2034 |
| Base Year | 2025 |
| Estimated Year | 2026 |
| Forecast Period | 2026-2034 |
| Historical Period | 2020-2025 |
| Growth Rate | CAGR of 2.58% from 2020-2034 |
| Segmentation |
|
Table of Contents
- 1. Introduction
- 1.1. Research Scope
- 1.2. Market Segmentation
- 1.3. Research Objective
- 1.4. Definitions and Assumptions
- 2. Executive Summary
- 2.1. Market Snapshot
- 3. Market Dynamics
- 3.1. Market Drivers
- 3.2. Market Restrains
- 3.3. Market Trends
- 3.4. Market Opportunities
- 4. Market Factor Analysis
- 4.1. Porters Five Forces
- 4.1.1. Bargaining Power of Suppliers
- 4.1.2. Bargaining Power of Buyers
- 4.1.3. Threat of New Entrants
- 4.1.4. Threat of Substitutes
- 4.1.5. Competitive Rivalry
- 4.2. PESTEL analysis
- 4.3. BCG Analysis
- 4.3.1. Stars (High Growth, High Market Share)
- 4.3.2. Cash Cows (Low Growth, High Market Share)
- 4.3.3. Question Mark (High Growth, Low Market Share)
- 4.3.4. Dogs (Low Growth, Low Market Share)
- 4.4. Ansoff Matrix Analysis
- 4.5. Supply Chain Analysis
- 4.6. Regulatory Landscape
- 4.7. Current Market Potential and Opportunity Assessment (TAM–SAM–SOM Framework)
- 4.8. RAX Analyst Note
- 4.1. Porters Five Forces
- 5. Market Analysis, Insights and Forecast 2021-2033
- 5.1. Market Analysis, Insights and Forecast - by Resin
- 5.1.1. Polyethylene (PE)
- 5.1.2. Polyethylene Terephthalate (PET)
- 5.1.3. Polypropylene (PP)
- 5.1.4. Other Pl
- 5.2. Market Analysis, Insights and Forecast - by Product Type
- 5.2.1. Threaded - Screw Caps, Vacuum, etc.
- 5.2.2. Dispensing
- 5.2.3. Unthread
- 5.2.4. Child-resistant
- 5.3. Market Analysis, Insights and Forecast - by End-user Industries
- 5.3.1. Food
- 5.3.2. Beverage
- 5.3.2.1. Bottled Water
- 5.3.2.2. Carbonated Soft Drinks
- 5.3.2.3. Alcoholic Beverages
- 5.3.2.4. Juices and Energy Drinks
- 5.3.2.5. Other Beverages
- 5.3.3. Personal Care and Cosmetics
- 5.3.4. Household Chemicals
- 5.3.5. Other End-user Industries
- 5.4. Market Analysis, Insights and Forecast - by Region
- 5.4.1. North America
- 5.4.2. South America
- 5.4.3. Europe
- 5.4.4. Middle East & Africa
- 5.4.5. Asia Pacific
- 5.1. Market Analysis, Insights and Forecast - by Resin
- 6. Global Nordic Plastic Caps and Closures Market Analysis, Insights and Forecast, 2021-2033
- 6.1. Market Analysis, Insights and Forecast - by Resin
- 6.1.1. Polyethylene (PE)
- 6.1.2. Polyethylene Terephthalate (PET)
- 6.1.3. Polypropylene (PP)
- 6.1.4. Other Pl
- 6.2. Market Analysis, Insights and Forecast - by Product Type
- 6.2.1. Threaded - Screw Caps, Vacuum, etc.
- 6.2.2. Dispensing
- 6.2.3. Unthread
- 6.2.4. Child-resistant
- 6.3. Market Analysis, Insights and Forecast - by End-user Industries
- 6.3.1. Food
- 6.3.2. Beverage
- 6.3.2.1. Bottled Water
- 6.3.2.2. Carbonated Soft Drinks
- 6.3.2.3. Alcoholic Beverages
- 6.3.2.4. Juices and Energy Drinks
- 6.3.2.5. Other Beverages
- 6.3.3. Personal Care and Cosmetics
- 6.3.4. Household Chemicals
- 6.3.5. Other End-user Industries
- 6.1. Market Analysis, Insights and Forecast - by Resin
- 7. North America Nordic Plastic Caps and Closures Market Analysis, Insights and Forecast, 2020-2032
- 7.1. Market Analysis, Insights and Forecast - by Resin
- 7.1.1. Polyethylene (PE)
- 7.1.2. Polyethylene Terephthalate (PET)
- 7.1.3. Polypropylene (PP)
- 7.1.4. Other Pl
- 7.2. Market Analysis, Insights and Forecast - by Product Type
- 7.2.1. Threaded - Screw Caps, Vacuum, etc.
- 7.2.2. Dispensing
- 7.2.3. Unthread
- 7.2.4. Child-resistant
- 7.3. Market Analysis, Insights and Forecast - by End-user Industries
- 7.3.1. Food
- 7.3.2. Beverage
- 7.3.2.1. Bottled Water
- 7.3.2.2. Carbonated Soft Drinks
- 7.3.2.3. Alcoholic Beverages
- 7.3.2.4. Juices and Energy Drinks
- 7.3.2.5. Other Beverages
- 7.3.3. Personal Care and Cosmetics
- 7.3.4. Household Chemicals
- 7.3.5. Other End-user Industries
- 7.1. Market Analysis, Insights and Forecast - by Resin
- 8. South America Nordic Plastic Caps and Closures Market Analysis, Insights and Forecast, 2020-2032
- 8.1. Market Analysis, Insights and Forecast - by Resin
- 8.1.1. Polyethylene (PE)
- 8.1.2. Polyethylene Terephthalate (PET)
- 8.1.3. Polypropylene (PP)
- 8.1.4. Other Pl
- 8.2. Market Analysis, Insights and Forecast - by Product Type
- 8.2.1. Threaded - Screw Caps, Vacuum, etc.
- 8.2.2. Dispensing
- 8.2.3. Unthread
- 8.2.4. Child-resistant
- 8.3. Market Analysis, Insights and Forecast - by End-user Industries
- 8.3.1. Food
- 8.3.2. Beverage
- 8.3.2.1. Bottled Water
- 8.3.2.2. Carbonated Soft Drinks
- 8.3.2.3. Alcoholic Beverages
- 8.3.2.4. Juices and Energy Drinks
- 8.3.2.5. Other Beverages
- 8.3.3. Personal Care and Cosmetics
- 8.3.4. Household Chemicals
- 8.3.5. Other End-user Industries
- 8.1. Market Analysis, Insights and Forecast - by Resin
- 9. Europe Nordic Plastic Caps and Closures Market Analysis, Insights and Forecast, 2020-2032
- 9.1. Market Analysis, Insights and Forecast - by Resin
- 9.1.1. Polyethylene (PE)
- 9.1.2. Polyethylene Terephthalate (PET)
- 9.1.3. Polypropylene (PP)
- 9.1.4. Other Pl
- 9.2. Market Analysis, Insights and Forecast - by Product Type
- 9.2.1. Threaded - Screw Caps, Vacuum, etc.
- 9.2.2. Dispensing
- 9.2.3. Unthread
- 9.2.4. Child-resistant
- 9.3. Market Analysis, Insights and Forecast - by End-user Industries
- 9.3.1. Food
- 9.3.2. Beverage
- 9.3.2.1. Bottled Water
- 9.3.2.2. Carbonated Soft Drinks
- 9.3.2.3. Alcoholic Beverages
- 9.3.2.4. Juices and Energy Drinks
- 9.3.2.5. Other Beverages
- 9.3.3. Personal Care and Cosmetics
- 9.3.4. Household Chemicals
- 9.3.5. Other End-user Industries
- 9.1. Market Analysis, Insights and Forecast - by Resin
- 10. Middle East & Africa Nordic Plastic Caps and Closures Market Analysis, Insights and Forecast, 2020-2032
- 10.1. Market Analysis, Insights and Forecast - by Resin
- 10.1.1. Polyethylene (PE)
- 10.1.2. Polyethylene Terephthalate (PET)
- 10.1.3. Polypropylene (PP)
- 10.1.4. Other Pl
- 10.2. Market Analysis, Insights and Forecast - by Product Type
- 10.2.1. Threaded - Screw Caps, Vacuum, etc.
- 10.2.2. Dispensing
- 10.2.3. Unthread
- 10.2.4. Child-resistant
- 10.3. Market Analysis, Insights and Forecast - by End-user Industries
- 10.3.1. Food
- 10.3.2. Beverage
- 10.3.2.1. Bottled Water
- 10.3.2.2. Carbonated Soft Drinks
- 10.3.2.3. Alcoholic Beverages
- 10.3.2.4. Juices and Energy Drinks
- 10.3.2.5. Other Beverages
- 10.3.3. Personal Care and Cosmetics
- 10.3.4. Household Chemicals
- 10.3.5. Other End-user Industries
- 10.1. Market Analysis, Insights and Forecast - by Resin
- 11. Asia Pacific Nordic Plastic Caps and Closures Market Analysis, Insights and Forecast, 2020-2032
- 11.1. Market Analysis, Insights and Forecast - by Resin
- 11.1.1. Polyethylene (PE)
- 11.1.2. Polyethylene Terephthalate (PET)
- 11.1.3. Polypropylene (PP)
- 11.1.4. Other Pl
- 11.2. Market Analysis, Insights and Forecast - by Product Type
- 11.2.1. Threaded - Screw Caps, Vacuum, etc.
- 11.2.2. Dispensing
- 11.2.3. Unthread
- 11.2.4. Child-resistant
- 11.3. Market Analysis, Insights and Forecast - by End-user Industries
- 11.3.1. Food
- 11.3.2. Beverage
- 11.3.2.1. Bottled Water
- 11.3.2.2. Carbonated Soft Drinks
- 11.3.2.3. Alcoholic Beverages
- 11.3.2.4. Juices and Energy Drinks
- 11.3.2.5. Other Beverages
- 11.3.3. Personal Care and Cosmetics
- 11.3.4. Household Chemicals
- 11.3.5. Other End-user Industries
- 11.1. Market Analysis, Insights and Forecast - by Resin
- 12. Competitive Analysis
- 12.1. Company Profiles
- 12.1.1 Amcor Group GmbH
- 12.1.1.1. Company Overview
- 12.1.1.2. Products
- 12.1.1.3. Company Financials
- 12.1.1.4. SWOT Analysis
- 12.1.2 Bericap Holding GmbH
- 12.1.2.1. Company Overview
- 12.1.2.2. Products
- 12.1.2.3. Company Financials
- 12.1.2.4. SWOT Analysis
- 12.1.3 Berry Global Inc
- 12.1.3.1. Company Overview
- 12.1.3.2. Products
- 12.1.3.3. Company Financials
- 12.1.3.4. SWOT Analysis
- 12.1.4 Carmo A/S
- 12.1.4.1. Company Overview
- 12.1.4.2. Products
- 12.1.4.3. Company Financials
- 12.1.4.4. SWOT Analysis
- 12.1.5 Fin-Korkki Oy
- 12.1.5.1. Company Overview
- 12.1.5.2. Products
- 12.1.5.3. Company Financials
- 12.1.5.4. SWOT Analysis
- 12.1.6 Modulpac AB
- 12.1.6.1. Company Overview
- 12.1.6.2. Products
- 12.1.6.3. Company Financials
- 12.1.6.4. SWOT Analysis
- 12.1.7 Tetra Pak International SV
- 12.1.7.1. Company Overview
- 12.1.7.2. Products
- 12.1.7.3. Company Financials
- 12.1.7.4. SWOT Analysis
- 12.1.8 Robinson PLC8 2 Heat Map Analysis8 3 Competitor Analysis - Emerging vs Established Player
- 12.1.8.1. Company Overview
- 12.1.8.2. Products
- 12.1.8.3. Company Financials
- 12.1.8.4. SWOT Analysis
- 12.1.1 Amcor Group GmbH
- 12.2. Market Entropy
- 12.2.1 Company's Key Areas Served
- 12.2.2 Recent Developments
- 12.3. Company Market Share Analysis 2025
- 12.3.1 Top 5 Companies Market Share Analysis
- 12.3.2 Top 3 Companies Market Share Analysis
- 12.4. List of Potential Customers
- 13. Research Methodology
List of Figures
- Figure 1: Global Nordic Plastic Caps and Closures Market Revenue Breakdown (Million, %) by Region 2025 & 2033
- Figure 2: Global Nordic Plastic Caps and Closures Market Volume Breakdown (Billion, %) by Region 2025 & 2033
- Figure 3: North America Nordic Plastic Caps and Closures Market Revenue (Million), by Resin 2025 & 2033
- Figure 4: North America Nordic Plastic Caps and Closures Market Volume (Billion), by Resin 2025 & 2033
- Figure 5: North America Nordic Plastic Caps and Closures Market Revenue Share (%), by Resin 2025 & 2033
- Figure 6: North America Nordic Plastic Caps and Closures Market Volume Share (%), by Resin 2025 & 2033
- Figure 7: North America Nordic Plastic Caps and Closures Market Revenue (Million), by Product Type 2025 & 2033
- Figure 8: North America Nordic Plastic Caps and Closures Market Volume (Billion), by Product Type 2025 & 2033
- Figure 9: North America Nordic Plastic Caps and Closures Market Revenue Share (%), by Product Type 2025 & 2033
- Figure 10: North America Nordic Plastic Caps and Closures Market Volume Share (%), by Product Type 2025 & 2033
- Figure 11: North America Nordic Plastic Caps and Closures Market Revenue (Million), by End-user Industries 2025 & 2033
- Figure 12: North America Nordic Plastic Caps and Closures Market Volume (Billion), by End-user Industries 2025 & 2033
- Figure 13: North America Nordic Plastic Caps and Closures Market Revenue Share (%), by End-user Industries 2025 & 2033
- Figure 14: North America Nordic Plastic Caps and Closures Market Volume Share (%), by End-user Industries 2025 & 2033
- Figure 15: North America Nordic Plastic Caps and Closures Market Revenue (Million), by Country 2025 & 2033
- Figure 16: North America Nordic Plastic Caps and Closures Market Volume (Billion), by Country 2025 & 2033
- Figure 17: North America Nordic Plastic Caps and Closures Market Revenue Share (%), by Country 2025 & 2033
- Figure 18: North America Nordic Plastic Caps and Closures Market Volume Share (%), by Country 2025 & 2033
- Figure 19: South America Nordic Plastic Caps and Closures Market Revenue (Million), by Resin 2025 & 2033
- Figure 20: South America Nordic Plastic Caps and Closures Market Volume (Billion), by Resin 2025 & 2033
- Figure 21: South America Nordic Plastic Caps and Closures Market Revenue Share (%), by Resin 2025 & 2033
- Figure 22: South America Nordic Plastic Caps and Closures Market Volume Share (%), by Resin 2025 & 2033
- Figure 23: South America Nordic Plastic Caps and Closures Market Revenue (Million), by Product Type 2025 & 2033
- Figure 24: South America Nordic Plastic Caps and Closures Market Volume (Billion), by Product Type 2025 & 2033
- Figure 25: South America Nordic Plastic Caps and Closures Market Revenue Share (%), by Product Type 2025 & 2033
- Figure 26: South America Nordic Plastic Caps and Closures Market Volume Share (%), by Product Type 2025 & 2033
- Figure 27: South America Nordic Plastic Caps and Closures Market Revenue (Million), by End-user Industries 2025 & 2033
- Figure 28: South America Nordic Plastic Caps and Closures Market Volume (Billion), by End-user Industries 2025 & 2033
- Figure 29: South America Nordic Plastic Caps and Closures Market Revenue Share (%), by End-user Industries 2025 & 2033
- Figure 30: South America Nordic Plastic Caps and Closures Market Volume Share (%), by End-user Industries 2025 & 2033
- Figure 31: South America Nordic Plastic Caps and Closures Market Revenue (Million), by Country 2025 & 2033
- Figure 32: South America Nordic Plastic Caps and Closures Market Volume (Billion), by Country 2025 & 2033
- Figure 33: South America Nordic Plastic Caps and Closures Market Revenue Share (%), by Country 2025 & 2033
- Figure 34: South America Nordic Plastic Caps and Closures Market Volume Share (%), by Country 2025 & 2033
- Figure 35: Europe Nordic Plastic Caps and Closures Market Revenue (Million), by Resin 2025 & 2033
- Figure 36: Europe Nordic Plastic Caps and Closures Market Volume (Billion), by Resin 2025 & 2033
- Figure 37: Europe Nordic Plastic Caps and Closures Market Revenue Share (%), by Resin 2025 & 2033
- Figure 38: Europe Nordic Plastic Caps and Closures Market Volume Share (%), by Resin 2025 & 2033
- Figure 39: Europe Nordic Plastic Caps and Closures Market Revenue (Million), by Product Type 2025 & 2033
- Figure 40: Europe Nordic Plastic Caps and Closures Market Volume (Billion), by Product Type 2025 & 2033
- Figure 41: Europe Nordic Plastic Caps and Closures Market Revenue Share (%), by Product Type 2025 & 2033
- Figure 42: Europe Nordic Plastic Caps and Closures Market Volume Share (%), by Product Type 2025 & 2033
- Figure 43: Europe Nordic Plastic Caps and Closures Market Revenue (Million), by End-user Industries 2025 & 2033
- Figure 44: Europe Nordic Plastic Caps and Closures Market Volume (Billion), by End-user Industries 2025 & 2033
- Figure 45: Europe Nordic Plastic Caps and Closures Market Revenue Share (%), by End-user Industries 2025 & 2033
- Figure 46: Europe Nordic Plastic Caps and Closures Market Volume Share (%), by End-user Industries 2025 & 2033
- Figure 47: Europe Nordic Plastic Caps and Closures Market Revenue (Million), by Country 2025 & 2033
- Figure 48: Europe Nordic Plastic Caps and Closures Market Volume (Billion), by Country 2025 & 2033
- Figure 49: Europe Nordic Plastic Caps and Closures Market Revenue Share (%), by Country 2025 & 2033
- Figure 50: Europe Nordic Plastic Caps and Closures Market Volume Share (%), by Country 2025 & 2033
- Figure 51: Middle East & Africa Nordic Plastic Caps and Closures Market Revenue (Million), by Resin 2025 & 2033
- Figure 52: Middle East & Africa Nordic Plastic Caps and Closures Market Volume (Billion), by Resin 2025 & 2033
- Figure 53: Middle East & Africa Nordic Plastic Caps and Closures Market Revenue Share (%), by Resin 2025 & 2033
- Figure 54: Middle East & Africa Nordic Plastic Caps and Closures Market Volume Share (%), by Resin 2025 & 2033
- Figure 55: Middle East & Africa Nordic Plastic Caps and Closures Market Revenue (Million), by Product Type 2025 & 2033
- Figure 56: Middle East & Africa Nordic Plastic Caps and Closures Market Volume (Billion), by Product Type 2025 & 2033
- Figure 57: Middle East & Africa Nordic Plastic Caps and Closures Market Revenue Share (%), by Product Type 2025 & 2033
- Figure 58: Middle East & Africa Nordic Plastic Caps and Closures Market Volume Share (%), by Product Type 2025 & 2033
- Figure 59: Middle East & Africa Nordic Plastic Caps and Closures Market Revenue (Million), by End-user Industries 2025 & 2033
- Figure 60: Middle East & Africa Nordic Plastic Caps and Closures Market Volume (Billion), by End-user Industries 2025 & 2033
- Figure 61: Middle East & Africa Nordic Plastic Caps and Closures Market Revenue Share (%), by End-user Industries 2025 & 2033
- Figure 62: Middle East & Africa Nordic Plastic Caps and Closures Market Volume Share (%), by End-user Industries 2025 & 2033
- Figure 63: Middle East & Africa Nordic Plastic Caps and Closures Market Revenue (Million), by Country 2025 & 2033
- Figure 64: Middle East & Africa Nordic Plastic Caps and Closures Market Volume (Billion), by Country 2025 & 2033
- Figure 65: Middle East & Africa Nordic Plastic Caps and Closures Market Revenue Share (%), by Country 2025 & 2033
- Figure 66: Middle East & Africa Nordic Plastic Caps and Closures Market Volume Share (%), by Country 2025 & 2033
- Figure 67: Asia Pacific Nordic Plastic Caps and Closures Market Revenue (Million), by Resin 2025 & 2033
- Figure 68: Asia Pacific Nordic Plastic Caps and Closures Market Volume (Billion), by Resin 2025 & 2033
- Figure 69: Asia Pacific Nordic Plastic Caps and Closures Market Revenue Share (%), by Resin 2025 & 2033
- Figure 70: Asia Pacific Nordic Plastic Caps and Closures Market Volume Share (%), by Resin 2025 & 2033
- Figure 71: Asia Pacific Nordic Plastic Caps and Closures Market Revenue (Million), by Product Type 2025 & 2033
- Figure 72: Asia Pacific Nordic Plastic Caps and Closures Market Volume (Billion), by Product Type 2025 & 2033
- Figure 73: Asia Pacific Nordic Plastic Caps and Closures Market Revenue Share (%), by Product Type 2025 & 2033
- Figure 74: Asia Pacific Nordic Plastic Caps and Closures Market Volume Share (%), by Product Type 2025 & 2033
- Figure 75: Asia Pacific Nordic Plastic Caps and Closures Market Revenue (Million), by End-user Industries 2025 & 2033
- Figure 76: Asia Pacific Nordic Plastic Caps and Closures Market Volume (Billion), by End-user Industries 2025 & 2033
- Figure 77: Asia Pacific Nordic Plastic Caps and Closures Market Revenue Share (%), by End-user Industries 2025 & 2033
- Figure 78: Asia Pacific Nordic Plastic Caps and Closures Market Volume Share (%), by End-user Industries 2025 & 2033
- Figure 79: Asia Pacific Nordic Plastic Caps and Closures Market Revenue (Million), by Country 2025 & 2033
- Figure 80: Asia Pacific Nordic Plastic Caps and Closures Market Volume (Billion), by Country 2025 & 2033
- Figure 81: Asia Pacific Nordic Plastic Caps and Closures Market Revenue Share (%), by Country 2025 & 2033
- Figure 82: Asia Pacific Nordic Plastic Caps and Closures Market Volume Share (%), by Country 2025 & 2033
List of Tables
- Table 1: Global Nordic Plastic Caps and Closures Market Revenue Million Forecast, by Resin 2020 & 2033
- Table 2: Global Nordic Plastic Caps and Closures Market Volume Billion Forecast, by Resin 2020 & 2033
- Table 3: Global Nordic Plastic Caps and Closures Market Revenue Million Forecast, by Product Type 2020 & 2033
- Table 4: Global Nordic Plastic Caps and Closures Market Volume Billion Forecast, by Product Type 2020 & 2033
- Table 5: Global Nordic Plastic Caps and Closures Market Revenue Million Forecast, by End-user Industries 2020 & 2033
- Table 6: Global Nordic Plastic Caps and Closures Market Volume Billion Forecast, by End-user Industries 2020 & 2033
- Table 7: Global Nordic Plastic Caps and Closures Market Revenue Million Forecast, by Region 2020 & 2033
- Table 8: Global Nordic Plastic Caps and Closures Market Volume Billion Forecast, by Region 2020 & 2033
- Table 9: Global Nordic Plastic Caps and Closures Market Revenue Million Forecast, by Resin 2020 & 2033
- Table 10: Global Nordic Plastic Caps and Closures Market Volume Billion Forecast, by Resin 2020 & 2033
- Table 11: Global Nordic Plastic Caps and Closures Market Revenue Million Forecast, by Product Type 2020 & 2033
- Table 12: Global Nordic Plastic Caps and Closures Market Volume Billion Forecast, by Product Type 2020 & 2033
- Table 13: Global Nordic Plastic Caps and Closures Market Revenue Million Forecast, by End-user Industries 2020 & 2033
- Table 14: Global Nordic Plastic Caps and Closures Market Volume Billion Forecast, by End-user Industries 2020 & 2033
- Table 15: Global Nordic Plastic Caps and Closures Market Revenue Million Forecast, by Country 2020 & 2033
- Table 16: Global Nordic Plastic Caps and Closures Market Volume Billion Forecast, by Country 2020 & 2033
- Table 17: United States Nordic Plastic Caps and Closures Market Revenue (Million) Forecast, by Application 2020 & 2033
- Table 18: United States Nordic Plastic Caps and Closures Market Volume (Billion) Forecast, by Application 2020 & 2033
- Table 19: Canada Nordic Plastic Caps and Closures Market Revenue (Million) Forecast, by Application 2020 & 2033
- Table 20: Canada Nordic Plastic Caps and Closures Market Volume (Billion) Forecast, by Application 2020 & 2033
- Table 21: Mexico Nordic Plastic Caps and Closures Market Revenue (Million) Forecast, by Application 2020 & 2033
- Table 22: Mexico Nordic Plastic Caps and Closures Market Volume (Billion) Forecast, by Application 2020 & 2033
- Table 23: Global Nordic Plastic Caps and Closures Market Revenue Million Forecast, by Resin 2020 & 2033
- Table 24: Global Nordic Plastic Caps and Closures Market Volume Billion Forecast, by Resin 2020 & 2033
- Table 25: Global Nordic Plastic Caps and Closures Market Revenue Million Forecast, by Product Type 2020 & 2033
- Table 26: Global Nordic Plastic Caps and Closures Market Volume Billion Forecast, by Product Type 2020 & 2033
- Table 27: Global Nordic Plastic Caps and Closures Market Revenue Million Forecast, by End-user Industries 2020 & 2033
- Table 28: Global Nordic Plastic Caps and Closures Market Volume Billion Forecast, by End-user Industries 2020 & 2033
- Table 29: Global Nordic Plastic Caps and Closures Market Revenue Million Forecast, by Country 2020 & 2033
- Table 30: Global Nordic Plastic Caps and Closures Market Volume Billion Forecast, by Country 2020 & 2033
- Table 31: Brazil Nordic Plastic Caps and Closures Market Revenue (Million) Forecast, by Application 2020 & 2033
- Table 32: Brazil Nordic Plastic Caps and Closures Market Volume (Billion) Forecast, by Application 2020 & 2033
- Table 33: Argentina Nordic Plastic Caps and Closures Market Revenue (Million) Forecast, by Application 2020 & 2033
- Table 34: Argentina Nordic Plastic Caps and Closures Market Volume (Billion) Forecast, by Application 2020 & 2033
- Table 35: Rest of South America Nordic Plastic Caps and Closures Market Revenue (Million) Forecast, by Application 2020 & 2033
- Table 36: Rest of South America Nordic Plastic Caps and Closures Market Volume (Billion) Forecast, by Application 2020 & 2033
- Table 37: Global Nordic Plastic Caps and Closures Market Revenue Million Forecast, by Resin 2020 & 2033
- Table 38: Global Nordic Plastic Caps and Closures Market Volume Billion Forecast, by Resin 2020 & 2033
- Table 39: Global Nordic Plastic Caps and Closures Market Revenue Million Forecast, by Product Type 2020 & 2033
- Table 40: Global Nordic Plastic Caps and Closures Market Volume Billion Forecast, by Product Type 2020 & 2033
- Table 41: Global Nordic Plastic Caps and Closures Market Revenue Million Forecast, by End-user Industries 2020 & 2033
- Table 42: Global Nordic Plastic Caps and Closures Market Volume Billion Forecast, by End-user Industries 2020 & 2033
- Table 43: Global Nordic Plastic Caps and Closures Market Revenue Million Forecast, by Country 2020 & 2033
- Table 44: Global Nordic Plastic Caps and Closures Market Volume Billion Forecast, by Country 2020 & 2033
- Table 45: United Kingdom Nordic Plastic Caps and Closures Market Revenue (Million) Forecast, by Application 2020 & 2033
- Table 46: United Kingdom Nordic Plastic Caps and Closures Market Volume (Billion) Forecast, by Application 2020 & 2033
- Table 47: Germany Nordic Plastic Caps and Closures Market Revenue (Million) Forecast, by Application 2020 & 2033
- Table 48: Germany Nordic Plastic Caps and Closures Market Volume (Billion) Forecast, by Application 2020 & 2033
- Table 49: France Nordic Plastic Caps and Closures Market Revenue (Million) Forecast, by Application 2020 & 2033
- Table 50: France Nordic Plastic Caps and Closures Market Volume (Billion) Forecast, by Application 2020 & 2033
- Table 51: Italy Nordic Plastic Caps and Closures Market Revenue (Million) Forecast, by Application 2020 & 2033
- Table 52: Italy Nordic Plastic Caps and Closures Market Volume (Billion) Forecast, by Application 2020 & 2033
- Table 53: Spain Nordic Plastic Caps and Closures Market Revenue (Million) Forecast, by Application 2020 & 2033
- Table 54: Spain Nordic Plastic Caps and Closures Market Volume (Billion) Forecast, by Application 2020 & 2033
- Table 55: Russia Nordic Plastic Caps and Closures Market Revenue (Million) Forecast, by Application 2020 & 2033
- Table 56: Russia Nordic Plastic Caps and Closures Market Volume (Billion) Forecast, by Application 2020 & 2033
- Table 57: Benelux Nordic Plastic Caps and Closures Market Revenue (Million) Forecast, by Application 2020 & 2033
- Table 58: Benelux Nordic Plastic Caps and Closures Market Volume (Billion) Forecast, by Application 2020 & 2033
- Table 59: Nordics Nordic Plastic Caps and Closures Market Revenue (Million) Forecast, by Application 2020 & 2033
- Table 60: Nordics Nordic Plastic Caps and Closures Market Volume (Billion) Forecast, by Application 2020 & 2033
- Table 61: Rest of Europe Nordic Plastic Caps and Closures Market Revenue (Million) Forecast, by Application 2020 & 2033
- Table 62: Rest of Europe Nordic Plastic Caps and Closures Market Volume (Billion) Forecast, by Application 2020 & 2033
- Table 63: Global Nordic Plastic Caps and Closures Market Revenue Million Forecast, by Resin 2020 & 2033
- Table 64: Global Nordic Plastic Caps and Closures Market Volume Billion Forecast, by Resin 2020 & 2033
- Table 65: Global Nordic Plastic Caps and Closures Market Revenue Million Forecast, by Product Type 2020 & 2033
- Table 66: Global Nordic Plastic Caps and Closures Market Volume Billion Forecast, by Product Type 2020 & 2033
- Table 67: Global Nordic Plastic Caps and Closures Market Revenue Million Forecast, by End-user Industries 2020 & 2033
- Table 68: Global Nordic Plastic Caps and Closures Market Volume Billion Forecast, by End-user Industries 2020 & 2033
- Table 69: Global Nordic Plastic Caps and Closures Market Revenue Million Forecast, by Country 2020 & 2033
- Table 70: Global Nordic Plastic Caps and Closures Market Volume Billion Forecast, by Country 2020 & 2033
- Table 71: Turkey Nordic Plastic Caps and Closures Market Revenue (Million) Forecast, by Application 2020 & 2033
- Table 72: Turkey Nordic Plastic Caps and Closures Market Volume (Billion) Forecast, by Application 2020 & 2033
- Table 73: Israel Nordic Plastic Caps and Closures Market Revenue (Million) Forecast, by Application 2020 & 2033
- Table 74: Israel Nordic Plastic Caps and Closures Market Volume (Billion) Forecast, by Application 2020 & 2033
- Table 75: GCC Nordic Plastic Caps and Closures Market Revenue (Million) Forecast, by Application 2020 & 2033
- Table 76: GCC Nordic Plastic Caps and Closures Market Volume (Billion) Forecast, by Application 2020 & 2033
- Table 77: North Africa Nordic Plastic Caps and Closures Market Revenue (Million) Forecast, by Application 2020 & 2033
- Table 78: North Africa Nordic Plastic Caps and Closures Market Volume (Billion) Forecast, by Application 2020 & 2033
- Table 79: South Africa Nordic Plastic Caps and Closures Market Revenue (Million) Forecast, by Application 2020 & 2033
- Table 80: South Africa Nordic Plastic Caps and Closures Market Volume (Billion) Forecast, by Application 2020 & 2033
- Table 81: Rest of Middle East & Africa Nordic Plastic Caps and Closures Market Revenue (Million) Forecast, by Application 2020 & 2033
- Table 82: Rest of Middle East & Africa Nordic Plastic Caps and Closures Market Volume (Billion) Forecast, by Application 2020 & 2033
- Table 83: Global Nordic Plastic Caps and Closures Market Revenue Million Forecast, by Resin 2020 & 2033
- Table 84: Global Nordic Plastic Caps and Closures Market Volume Billion Forecast, by Resin 2020 & 2033
- Table 85: Global Nordic Plastic Caps and Closures Market Revenue Million Forecast, by Product Type 2020 & 2033
- Table 86: Global Nordic Plastic Caps and Closures Market Volume Billion Forecast, by Product Type 2020 & 2033
- Table 87: Global Nordic Plastic Caps and Closures Market Revenue Million Forecast, by End-user Industries 2020 & 2033
- Table 88: Global Nordic Plastic Caps and Closures Market Volume Billion Forecast, by End-user Industries 2020 & 2033
- Table 89: Global Nordic Plastic Caps and Closures Market Revenue Million Forecast, by Country 2020 & 2033
- Table 90: Global Nordic Plastic Caps and Closures Market Volume Billion Forecast, by Country 2020 & 2033
- Table 91: China Nordic Plastic Caps and Closures Market Revenue (Million) Forecast, by Application 2020 & 2033
- Table 92: China Nordic Plastic Caps and Closures Market Volume (Billion) Forecast, by Application 2020 & 2033
- Table 93: India Nordic Plastic Caps and Closures Market Revenue (Million) Forecast, by Application 2020 & 2033
- Table 94: India Nordic Plastic Caps and Closures Market Volume (Billion) Forecast, by Application 2020 & 2033
- Table 95: Japan Nordic Plastic Caps and Closures Market Revenue (Million) Forecast, by Application 2020 & 2033
- Table 96: Japan Nordic Plastic Caps and Closures Market Volume (Billion) Forecast, by Application 2020 & 2033
- Table 97: South Korea Nordic Plastic Caps and Closures Market Revenue (Million) Forecast, by Application 2020 & 2033
- Table 98: South Korea Nordic Plastic Caps and Closures Market Volume (Billion) Forecast, by Application 2020 & 2033
- Table 99: ASEAN Nordic Plastic Caps and Closures Market Revenue (Million) Forecast, by Application 2020 & 2033
- Table 100: ASEAN Nordic Plastic Caps and Closures Market Volume (Billion) Forecast, by Application 2020 & 2033
- Table 101: Oceania Nordic Plastic Caps and Closures Market Revenue (Million) Forecast, by Application 2020 & 2033
- Table 102: Oceania Nordic Plastic Caps and Closures Market Volume (Billion) Forecast, by Application 2020 & 2033
- Table 103: Rest of Asia Pacific Nordic Plastic Caps and Closures Market Revenue (Million) Forecast, by Application 2020 & 2033
- Table 104: Rest of Asia Pacific Nordic Plastic Caps and Closures Market Volume (Billion) Forecast, by Application 2020 & 2033
Frequently Asked Questions
1. What is the projected Compound Annual Growth Rate (CAGR) of the Nordic Plastic Caps and Closures Market?
The projected CAGR is approximately 2.58%.
2. Which companies are prominent players in the Nordic Plastic Caps and Closures Market?
Key companies in the market include Amcor Group GmbH, Bericap Holding GmbH, Berry Global Inc, Carmo A/S, Fin-Korkki Oy, Modulpac AB, Tetra Pak International SV, Robinson PLC8 2 Heat Map Analysis8 3 Competitor Analysis - Emerging vs Established Player.
3. What are the main segments of the Nordic Plastic Caps and Closures Market?
The market segments include Resin, Product Type, End-user Industries.
4. Can you provide details about the market size?
The market size is estimated to be USD 1.25 Million as of 2022.
5. What are some drivers contributing to market growth?
Growing Tourism Boosts the Food and Beverage Industry; Increasing Product Innovation in the Market.
6. What are the notable trends driving market growth?
Polypropylene (PP) Segment is Estimated to Have the Largest Market Share.
7. Are there any restraints impacting market growth?
Growing Tourism Boosts the Food and Beverage Industry; Increasing Product Innovation in the Market.
8. Can you provide examples of recent developments in the market?
February 2024: Robinson PLC, a UK-based company operating in Denmark, exhibited its products at Packaging Innovations and Empack, hosted at Birmingham's National Exhibition Centre (NEC).
9. What pricing options are available for accessing the report?
Pricing options include single-user, multi-user, and enterprise licenses priced at USD 3800, USD 4500, and USD 5800 respectively.
10. Is the market size provided in terms of value or volume?
The market size is provided in terms of value, measured in Million and volume, measured in Billion.
11. Are there any specific market keywords associated with the report?
Yes, the market keyword associated with the report is "Nordic Plastic Caps and Closures Market," which aids in identifying and referencing the specific market segment covered.
12. How do I determine which pricing option suits my needs best?
The pricing options vary based on user requirements and access needs. Individual users may opt for single-user licenses, while businesses requiring broader access may choose multi-user or enterprise licenses for cost-effective access to the report.
13. Are there any additional resources or data provided in the Nordic Plastic Caps and Closures Market report?
While the report offers comprehensive insights, it's advisable to review the specific contents or supplementary materials provided to ascertain if additional resources or data are available.
14. How can I stay updated on further developments or reports in the Nordic Plastic Caps and Closures Market?
To stay informed about further developments, trends, and reports in the Nordic Plastic Caps and Closures Market, consider subscribing to industry newsletters, following relevant companies and organizations, or regularly checking reputable industry news sources and publications.
Methodology
Step 1 - Identification of Relevant Samples Size from Population Database


Step 2 - Approaches for Defining Global Market Size (Value, Volume* & Price*)

Note*: In applicable scenarios
Step 3 - Data Sources
Primary Research
- Web Analytics
- Survey Reports
- Research Institute
- Latest Research Reports
- Opinion Leaders
Secondary Research
- Annual Reports
- White Paper
- Latest Press Release
- Industry Association
- Paid Database
- Investor Presentations

Step 4 - Data Triangulation
Involves using different sources of information in order to increase the validity of a study
These sources are likely to be stakeholders in a program - participants, other researchers, program staff, other community members, and so on.
Then we put all data in single framework & apply various statistical tools to find out the dynamic on the market.
During the analysis stage, feedback from the stakeholder groups would be compared to determine areas of agreement as well as areas of divergence