

Key Insights
The North African battery market, though currently modest, is poised for substantial expansion, driven by industrial growth, urbanization, and a rapidly evolving automotive sector. With an estimated Compound Annual Growth Rate (CAGR) of 6.55%, the market is projected to reach $4.97 billion by the base year 2025. Key growth drivers include the increasing demand for energy storage solutions in renewable energy projects, expansion of telecommunications infrastructure, and the burgeoning electric vehicle (EV) segment. The market is primarily segmented by battery type, with lithium-ion batteries showing accelerated adoption due to their superior energy density, ideal for EVs and energy storage systems (ESS). Lead-acid batteries will continue to hold a significant share, valued for their cost-effectiveness and established use in standby power applications. Major applications encompass automotive batteries (passenger vehicles, commercial transport), industrial batteries (UPS, material handling), and portable batteries (consumer electronics). Despite existing challenges such as infrastructure limitations and the need for advanced recycling programs, the outlook for the North African battery market is exceptionally positive, anticipating significant growth through 2033. Investments in renewable energy infrastructure and the increasing adoption of EVs are critical catalysts, attracting considerable interest from both regional and international stakeholders. Established players like Saft, Toshiba, and Panasonic are already present, indicating a competitive landscape.
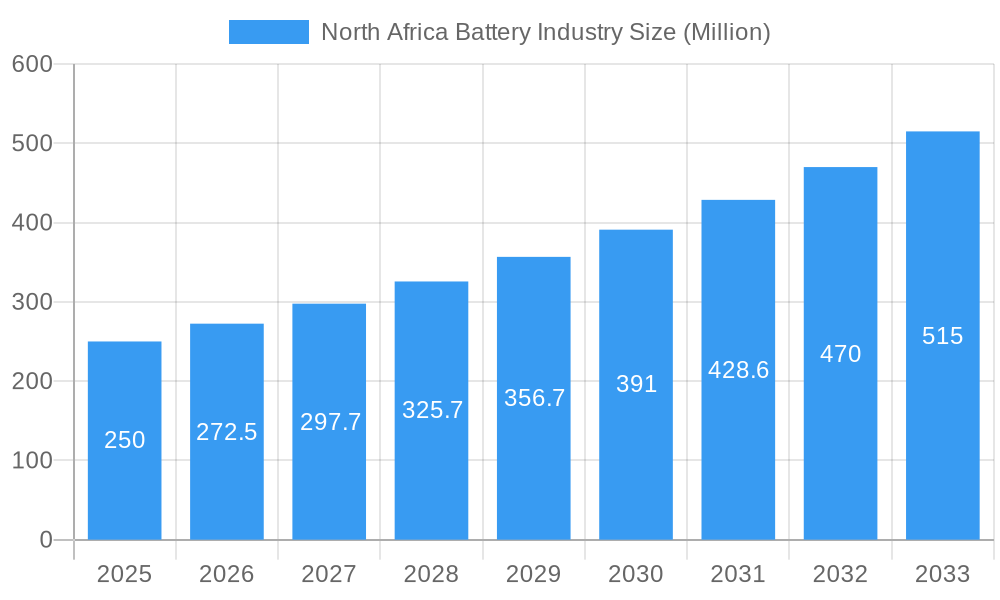
North Africa Battery Industry Market Size (In Billion)
The North African battery market is projected to achieve a size of $4.97 billion by 2025, with a significant CAGR of 6.55%. This growth trajectory is underpinned by robust regional economic dynamics and expanding opportunities in sectors like renewable energy and transportation. Detailed market segmentation by battery type and application will reveal nuanced growth rates within each segment, offering critical insights for strategic investment and business development.
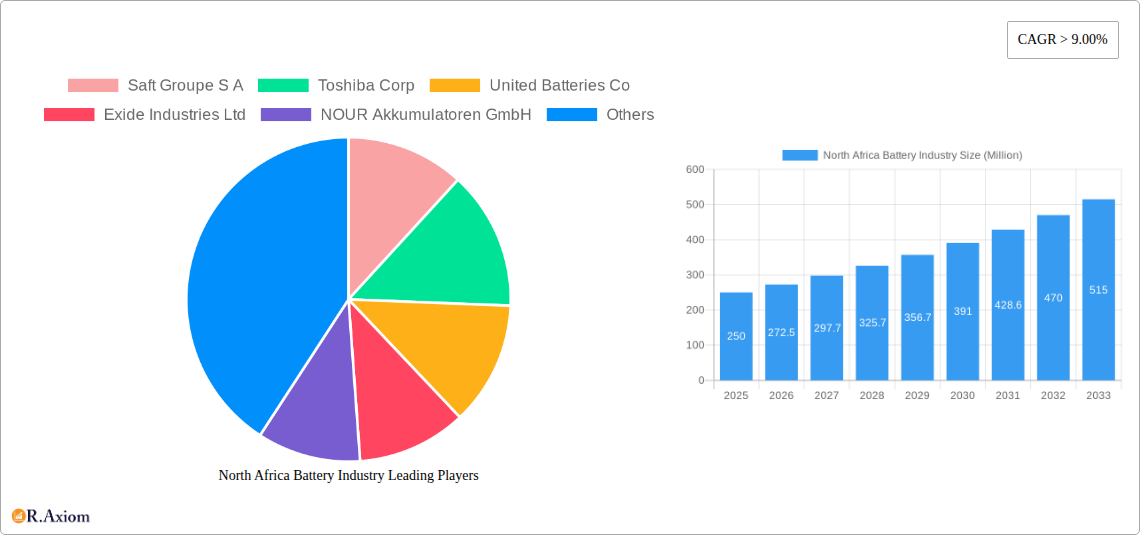
North Africa Battery Industry Company Market Share
North Africa Battery Industry: 2019-2033 Market Analysis and Forecast Report
This comprehensive report provides a detailed analysis of the North Africa battery industry, covering market size, segmentation, growth drivers, challenges, and key players. The study period spans from 2019 to 2033, with 2025 serving as the base and estimated year. This report is crucial for industry stakeholders, investors, and businesses seeking to understand the dynamic landscape of the North African battery market. The report leverages extensive primary and secondary research to provide actionable insights and forecasts.
North Africa Battery Industry Market Concentration & Innovation
The North African battery market exhibits a moderately concentrated landscape, with a few major players holding significant market share. However, the emergence of new entrants and technological advancements are driving increased competition. Market share distribution amongst the top five players in 2025 is estimated at xx%, with Saft Groupe S A, Toshiba Corp, and Panasonic Corporation amongst the leading players. Innovation is primarily driven by the demand for higher energy density batteries, particularly Lithium-ion, to support the growth of renewable energy and electric vehicles. Regulatory frameworks focused on environmental sustainability and safety are influencing product development and market access. Furthermore, M&A activities are expected to intensify, with predicted deal values exceeding USD xx Million in the forecast period (2025-2033). The market is also seeing the rise of product substitutes, such as flow batteries, posing potential challenges to established technologies. End-user trends indicate a strong shift towards renewable energy storage and electric mobility, shaping the future demand for batteries.
- Market Share (2025 Estimate): Top 5 players hold xx%
- M&A Deal Value (2025-2033 Forecast): USD xx Million
- Key Innovation Drivers: Higher energy density, sustainability, safety regulations.
North Africa Battery Industry Industry Trends & Insights
The North African battery market is poised for significant growth, driven by increasing electricity demand, renewable energy integration, and the burgeoning electric vehicle (EV) sector. The Compound Annual Growth Rate (CAGR) for the overall market is projected to be xx% during the forecast period (2025-2033). Technological disruptions, particularly the rapid advancement of Lithium-ion battery technology, are reshaping the competitive landscape. Consumer preferences are shifting towards higher-performance, longer-lasting, and environmentally friendly batteries. Market penetration of Lithium-ion batteries is steadily increasing, surpassing xx% by 2033, driven by government incentives and increasing demand from the electric vehicle and renewable energy sectors. Competitive dynamics are marked by intense price competition and product differentiation, particularly in the automotive battery segment.
Dominant Markets & Segments in North Africa Battery Industry
Egypt is currently the dominant market in North Africa for batteries, owing to its larger economy and higher energy demand compared to other nations in the region. The Secondary Battery segment holds the largest market share, fueled primarily by demand for automotive and industrial applications.
- Dominant Region: Egypt
- Dominant Segment (Type): Secondary Battery
- Dominant Segment (Technology): Lead-acid Battery (currently), with Lithium-ion rapidly growing.
- Dominant Segment (Application): Automotive Batteries
Key Drivers for Egypt's Dominance:
- Robust infrastructure development
- Favorable economic policies promoting industrial growth
- Increasing adoption of renewable energy technologies.
Lead-acid batteries currently dominate the technology segment owing to their lower cost. However, Lithium-ion batteries are experiencing rapid growth driven by their superior energy density and performance characteristics, especially in electric vehicle and renewable energy storage applications.
North Africa Battery Industry Product Developments
Significant product innovations are focusing on enhancing energy density, extending battery life, improving safety features, and reducing costs. The market is witnessing advancements in solid-state batteries and other advanced battery technologies, offering potential advantages in terms of energy density, safety, and lifespan. These new technologies are increasingly being adapted to meet the specific needs of various applications, like portable electronics and electric vehicles. The successful market fit depends heavily on cost reduction strategies to make these advanced batteries more competitive in the North African market.
Report Scope & Segmentation Analysis
This report segments the North African battery market based on type (Primary Battery, Secondary Battery), technology (Lithium-ion Battery, Lead-acid Battery, Others), and application (Automotive Batteries, Industrial Batteries, Portable Batteries, Others). Each segment's growth projections, market sizes, and competitive dynamics are thoroughly analyzed. For example, the Lithium-ion battery segment demonstrates rapid growth driven by the EV and renewable energy sectors, while the lead-acid battery market, while larger, shows slower growth. The Automotive Battery application segment commands the largest market share due to rising car sales and the increasing adoption of electric vehicles.
Key Drivers of North Africa Battery Industry Growth
The growth of the North African battery industry is propelled by several key factors. The increasing demand for electricity and the expansion of renewable energy projects necessitate efficient energy storage solutions, boosting battery demand. Government initiatives supporting electric vehicle adoption and investments in grid modernization further accelerate market growth. Technological advancements leading to better battery performance and reduced costs also play a significant role.
Challenges in the North Africa Battery Industry Sector
The North African battery industry faces several challenges, including limited raw material availability, requiring reliance on imports, which increases vulnerability to global supply chain disruptions. Furthermore, regulatory uncertainties and a lack of harmonized standards across different countries in the region may impede market growth. High initial investment costs for advanced battery technologies, particularly Lithium-ion, can limit market penetration in some segments. Intense competition from established players and new entrants also presents a challenge for market participants.
Emerging Opportunities in North Africa Battery Industry
Significant opportunities exist for growth within the North African battery market. The increasing adoption of renewable energy sources creates a strong demand for energy storage solutions. Government policies incentivizing electric vehicle adoption offer a substantial growth potential for automotive batteries. Furthermore, the expanding industrial sector and rising demand for portable electronics present additional opportunities for battery manufacturers. The development of local manufacturing capabilities and supply chains can significantly strengthen the industry.
Leading Players in the North Africa Battery Industry Market
- Saft Groupe S A
- Toshiba Corp
- United Batteries Co
- Exide Industries Ltd
- NOUR Akkumulatoren GmbH
- Duracell Inc
- Murata Manufacturing Co Ltd
- EL-Nisr Company
- Panasonic Corporation
- Chloride Egypt S A E
Key Developments in North Africa Battery Industry Industry
- October 2022: KarmSolar secured USD 2.4 Million in bank financing for a solar-plus-storage project in Egypt, featuring a 1MW/3.957MWh energy storage system. This highlights the increasing investment in renewable energy storage solutions within the region.
Strategic Outlook for North Africa Battery Industry Market
The North African battery market presents a promising outlook with substantial growth potential fueled by renewable energy integration, electric vehicle adoption, and industrial expansion. Strategic investments in advanced battery technologies, local manufacturing capabilities, and sustainable supply chains are crucial for capturing market share and driving future growth. Addressing the challenges related to raw material sourcing, regulatory harmonization, and cost optimization will be critical for unlocking the full potential of this dynamic market.
North Africa Battery Industry Segmentation
-
1. Type
- 1.1. Primary Battery
- 1.2. Secondary Battery
-
2. Technology
- 2.1. Lithium-ion Battery
- 2.2. Lead-acid Battery
- 2.3. Others
-
3. Application
- 3.1. Automotive Batteries
- 3.2. Industrial Batteries
- 3.3. Portable Batteries
- 3.4. Others
-
4. Geography
- 4.1. Egypt
- 4.2. Algeria
- 4.3. Rest of North Africa
North Africa Battery Industry Segmentation By Geography
- 1. Egypt
- 2. Algeria
- 3. Rest of North Africa
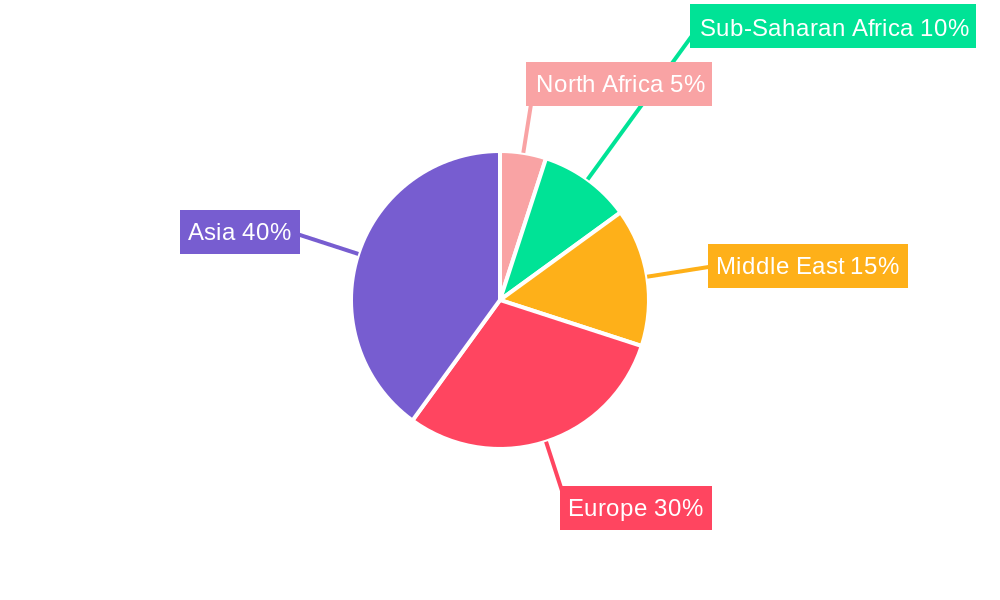
North Africa Battery Industry Regional Market Share
Geographic Coverage of North Africa Battery Industry
North Africa Battery Industry REPORT HIGHLIGHTS
| Aspects | Details |
|---|---|
| Study Period | 2020-2034 |
| Base Year | 2025 |
| Estimated Year | 2026 |
| Forecast Period | 2026-2034 |
| Historical Period | 2020-2025 |
| Growth Rate | CAGR of 6.55% from 2020-2034 |
| Segmentation |
|
Table of Contents
- 1. Introduction
- 1.1. Research Scope
- 1.2. Market Segmentation
- 1.3. Research Objective
- 1.4. Definitions and Assumptions
- 2. Executive Summary
- 2.1. Market Snapshot
- 3. Market Dynamics
- 3.1. Market Drivers
- 3.2. Market Restrains
- 3.3. Market Trends
- 3.4. Market Opportunities
- 4. Market Factor Analysis
- 4.1. Porters Five Forces
- 4.1.1. Bargaining Power of Suppliers
- 4.1.2. Bargaining Power of Buyers
- 4.1.3. Threat of New Entrants
- 4.1.4. Threat of Substitutes
- 4.1.5. Competitive Rivalry
- 4.2. PESTEL analysis
- 4.3. BCG Analysis
- 4.3.1. Stars (High Growth, High Market Share)
- 4.3.2. Cash Cows (Low Growth, High Market Share)
- 4.3.3. Question Mark (High Growth, Low Market Share)
- 4.3.4. Dogs (Low Growth, Low Market Share)
- 4.4. Ansoff Matrix Analysis
- 4.5. Supply Chain Analysis
- 4.6. Regulatory Landscape
- 4.7. Current Market Potential and Opportunity Assessment (TAM–SAM–SOM Framework)
- 4.8. RAX Analyst Note
- 4.1. Porters Five Forces
- 5. Market Analysis, Insights and Forecast 2021-2033
- 5.1. Market Analysis, Insights and Forecast - by Type
- 5.1.1. Primary Battery
- 5.1.2. Secondary Battery
- 5.2. Market Analysis, Insights and Forecast - by Technology
- 5.2.1. Lithium-ion Battery
- 5.2.2. Lead-acid Battery
- 5.2.3. Others
- 5.3. Market Analysis, Insights and Forecast - by Application
- 5.3.1. Automotive Batteries
- 5.3.2. Industrial Batteries
- 5.3.3. Portable Batteries
- 5.3.4. Others
- 5.4. Market Analysis, Insights and Forecast - by Geography
- 5.4.1. Egypt
- 5.4.2. Algeria
- 5.4.3. Rest of North Africa
- 5.5. Market Analysis, Insights and Forecast - by Region
- 5.5.1. Egypt
- 5.5.2. Algeria
- 5.5.3. Rest of North Africa
- 5.1. Market Analysis, Insights and Forecast - by Type
- 6. North Africa Battery Industry Analysis, Insights and Forecast, 2021-2033
- 6.1. Market Analysis, Insights and Forecast - by Type
- 6.1.1. Primary Battery
- 6.1.2. Secondary Battery
- 6.2. Market Analysis, Insights and Forecast - by Technology
- 6.2.1. Lithium-ion Battery
- 6.2.2. Lead-acid Battery
- 6.2.3. Others
- 6.3. Market Analysis, Insights and Forecast - by Application
- 6.3.1. Automotive Batteries
- 6.3.2. Industrial Batteries
- 6.3.3. Portable Batteries
- 6.3.4. Others
- 6.4. Market Analysis, Insights and Forecast - by Geography
- 6.4.1. Egypt
- 6.4.2. Algeria
- 6.4.3. Rest of North Africa
- 6.1. Market Analysis, Insights and Forecast - by Type
- 7. Egypt North Africa Battery Industry Analysis, Insights and Forecast, 2020-2032
- 7.1. Market Analysis, Insights and Forecast - by Type
- 7.1.1. Primary Battery
- 7.1.2. Secondary Battery
- 7.2. Market Analysis, Insights and Forecast - by Technology
- 7.2.1. Lithium-ion Battery
- 7.2.2. Lead-acid Battery
- 7.2.3. Others
- 7.3. Market Analysis, Insights and Forecast - by Application
- 7.3.1. Automotive Batteries
- 7.3.2. Industrial Batteries
- 7.3.3. Portable Batteries
- 7.3.4. Others
- 7.4. Market Analysis, Insights and Forecast - by Geography
- 7.4.1. Egypt
- 7.4.2. Algeria
- 7.4.3. Rest of North Africa
- 7.1. Market Analysis, Insights and Forecast - by Type
- 8. Algeria North Africa Battery Industry Analysis, Insights and Forecast, 2020-2032
- 8.1. Market Analysis, Insights and Forecast - by Type
- 8.1.1. Primary Battery
- 8.1.2. Secondary Battery
- 8.2. Market Analysis, Insights and Forecast - by Technology
- 8.2.1. Lithium-ion Battery
- 8.2.2. Lead-acid Battery
- 8.2.3. Others
- 8.3. Market Analysis, Insights and Forecast - by Application
- 8.3.1. Automotive Batteries
- 8.3.2. Industrial Batteries
- 8.3.3. Portable Batteries
- 8.3.4. Others
- 8.4. Market Analysis, Insights and Forecast - by Geography
- 8.4.1. Egypt
- 8.4.2. Algeria
- 8.4.3. Rest of North Africa
- 8.1. Market Analysis, Insights and Forecast - by Type
- 9. Rest of North Africa North Africa Battery Industry Analysis, Insights and Forecast, 2020-2032
- 9.1. Market Analysis, Insights and Forecast - by Type
- 9.1.1. Primary Battery
- 9.1.2. Secondary Battery
- 9.2. Market Analysis, Insights and Forecast - by Technology
- 9.2.1. Lithium-ion Battery
- 9.2.2. Lead-acid Battery
- 9.2.3. Others
- 9.3. Market Analysis, Insights and Forecast - by Application
- 9.3.1. Automotive Batteries
- 9.3.2. Industrial Batteries
- 9.3.3. Portable Batteries
- 9.3.4. Others
- 9.4. Market Analysis, Insights and Forecast - by Geography
- 9.4.1. Egypt
- 9.4.2. Algeria
- 9.4.3. Rest of North Africa
- 9.1. Market Analysis, Insights and Forecast - by Type
- 10. Competitive Analysis
- 10.1. Company Profiles
- 10.1.1 Saft Groupe S A
- 10.1.1.1. Company Overview
- 10.1.1.2. Products
- 10.1.1.3. Company Financials
- 10.1.1.4. SWOT Analysis
- 10.1.2 Toshiba Corp
- 10.1.2.1. Company Overview
- 10.1.2.2. Products
- 10.1.2.3. Company Financials
- 10.1.2.4. SWOT Analysis
- 10.1.3 United Batteries Co
- 10.1.3.1. Company Overview
- 10.1.3.2. Products
- 10.1.3.3. Company Financials
- 10.1.3.4. SWOT Analysis
- 10.1.4 Exide Industries Ltd
- 10.1.4.1. Company Overview
- 10.1.4.2. Products
- 10.1.4.3. Company Financials
- 10.1.4.4. SWOT Analysis
- 10.1.5 NOUR Akkumulatoren GmbH
- 10.1.5.1. Company Overview
- 10.1.5.2. Products
- 10.1.5.3. Company Financials
- 10.1.5.4. SWOT Analysis
- 10.1.6 Duracell Inc*List Not Exhaustive
- 10.1.6.1. Company Overview
- 10.1.6.2. Products
- 10.1.6.3. Company Financials
- 10.1.6.4. SWOT Analysis
- 10.1.7 Murata Manufacturing Co Ltd
- 10.1.7.1. Company Overview
- 10.1.7.2. Products
- 10.1.7.3. Company Financials
- 10.1.7.4. SWOT Analysis
- 10.1.8 EL-Nisr Company
- 10.1.8.1. Company Overview
- 10.1.8.2. Products
- 10.1.8.3. Company Financials
- 10.1.8.4. SWOT Analysis
- 10.1.9 Panasonic Corporation
- 10.1.9.1. Company Overview
- 10.1.9.2. Products
- 10.1.9.3. Company Financials
- 10.1.9.4. SWOT Analysis
- 10.1.10 Chloride Egypt S A E
- 10.1.10.1. Company Overview
- 10.1.10.2. Products
- 10.1.10.3. Company Financials
- 10.1.10.4. SWOT Analysis
- 10.1.1 Saft Groupe S A
- 10.2. Market Entropy
- 10.2.1 Company's Key Areas Served
- 10.2.2 Recent Developments
- 10.3. Company Market Share Analysis 2025
- 10.3.1 Top 5 Companies Market Share Analysis
- 10.3.2 Top 3 Companies Market Share Analysis
- 10.4. List of Potential Customers
- 11. Research Methodology
List of Figures
- Figure 1: North Africa Battery Industry Revenue Breakdown (billion, %) by Product 2025 & 2033
- Figure 2: North Africa Battery Industry Share (%) by Company 2025
List of Tables
- Table 1: North Africa Battery Industry Revenue billion Forecast, by Type 2020 & 2033
- Table 2: North Africa Battery Industry Volume K Tons Forecast, by Type 2020 & 2033
- Table 3: North Africa Battery Industry Revenue billion Forecast, by Technology 2020 & 2033
- Table 4: North Africa Battery Industry Volume K Tons Forecast, by Technology 2020 & 2033
- Table 5: North Africa Battery Industry Revenue billion Forecast, by Application 2020 & 2033
- Table 6: North Africa Battery Industry Volume K Tons Forecast, by Application 2020 & 2033
- Table 7: North Africa Battery Industry Revenue billion Forecast, by Geography 2020 & 2033
- Table 8: North Africa Battery Industry Volume K Tons Forecast, by Geography 2020 & 2033
- Table 9: North Africa Battery Industry Revenue billion Forecast, by Region 2020 & 2033
- Table 10: North Africa Battery Industry Volume K Tons Forecast, by Region 2020 & 2033
- Table 11: North Africa Battery Industry Revenue billion Forecast, by Type 2020 & 2033
- Table 12: North Africa Battery Industry Volume K Tons Forecast, by Type 2020 & 2033
- Table 13: North Africa Battery Industry Revenue billion Forecast, by Technology 2020 & 2033
- Table 14: North Africa Battery Industry Volume K Tons Forecast, by Technology 2020 & 2033
- Table 15: North Africa Battery Industry Revenue billion Forecast, by Application 2020 & 2033
- Table 16: North Africa Battery Industry Volume K Tons Forecast, by Application 2020 & 2033
- Table 17: North Africa Battery Industry Revenue billion Forecast, by Geography 2020 & 2033
- Table 18: North Africa Battery Industry Volume K Tons Forecast, by Geography 2020 & 2033
- Table 19: North Africa Battery Industry Revenue billion Forecast, by Country 2020 & 2033
- Table 20: North Africa Battery Industry Volume K Tons Forecast, by Country 2020 & 2033
- Table 21: North Africa Battery Industry Revenue billion Forecast, by Type 2020 & 2033
- Table 22: North Africa Battery Industry Volume K Tons Forecast, by Type 2020 & 2033
- Table 23: North Africa Battery Industry Revenue billion Forecast, by Technology 2020 & 2033
- Table 24: North Africa Battery Industry Volume K Tons Forecast, by Technology 2020 & 2033
- Table 25: North Africa Battery Industry Revenue billion Forecast, by Application 2020 & 2033
- Table 26: North Africa Battery Industry Volume K Tons Forecast, by Application 2020 & 2033
- Table 27: North Africa Battery Industry Revenue billion Forecast, by Geography 2020 & 2033
- Table 28: North Africa Battery Industry Volume K Tons Forecast, by Geography 2020 & 2033
- Table 29: North Africa Battery Industry Revenue billion Forecast, by Country 2020 & 2033
- Table 30: North Africa Battery Industry Volume K Tons Forecast, by Country 2020 & 2033
- Table 31: North Africa Battery Industry Revenue billion Forecast, by Type 2020 & 2033
- Table 32: North Africa Battery Industry Volume K Tons Forecast, by Type 2020 & 2033
- Table 33: North Africa Battery Industry Revenue billion Forecast, by Technology 2020 & 2033
- Table 34: North Africa Battery Industry Volume K Tons Forecast, by Technology 2020 & 2033
- Table 35: North Africa Battery Industry Revenue billion Forecast, by Application 2020 & 2033
- Table 36: North Africa Battery Industry Volume K Tons Forecast, by Application 2020 & 2033
- Table 37: North Africa Battery Industry Revenue billion Forecast, by Geography 2020 & 2033
- Table 38: North Africa Battery Industry Volume K Tons Forecast, by Geography 2020 & 2033
- Table 39: North Africa Battery Industry Revenue billion Forecast, by Country 2020 & 2033
- Table 40: North Africa Battery Industry Volume K Tons Forecast, by Country 2020 & 2033
Frequently Asked Questions
1. What is the projected Compound Annual Growth Rate (CAGR) of the North Africa Battery Industry?
The projected CAGR is approximately 6.55%.
2. Which companies are prominent players in the North Africa Battery Industry?
Key companies in the market include Saft Groupe S A, Toshiba Corp, United Batteries Co, Exide Industries Ltd, NOUR Akkumulatoren GmbH, Duracell Inc*List Not Exhaustive, Murata Manufacturing Co Ltd, EL-Nisr Company, Panasonic Corporation, Chloride Egypt S A E.
3. What are the main segments of the North Africa Battery Industry?
The market segments include Type, Technology, Application, Geography.
4. Can you provide details about the market size?
The market size is estimated to be USD 4.97 billion as of 2022.
5. What are some drivers contributing to market growth?
4.; Growing Uses of Natural Gas in Various Sectors.
6. What are the notable trends driving market growth?
Lithium-ion Batteries to Dominate the Market Growth.
7. Are there any restraints impacting market growth?
4.; Volatile Natural Gas Prices.
8. Can you provide examples of recent developments in the market?
October 2022: KarmSolar has secured USD 2.4 million in bank financing for a solar-plus-storage project in Egypt. The funds will be used for Phase 2 expansion of the company's existing solar microgrid system for Cairo 3A Poultry's farm in the Bahareya Oasis in Giza, Egypt. The energy storage system will comprise a 2.576MWp PV inverter and 1MW/3.957MWh storage.
9. What pricing options are available for accessing the report?
Pricing options include single-user, multi-user, and enterprise licenses priced at USD 4750, USD 5250, and USD 8750 respectively.
10. Is the market size provided in terms of value or volume?
The market size is provided in terms of value, measured in billion and volume, measured in K Tons.
11. Are there any specific market keywords associated with the report?
Yes, the market keyword associated with the report is "North Africa Battery Industry," which aids in identifying and referencing the specific market segment covered.
12. How do I determine which pricing option suits my needs best?
The pricing options vary based on user requirements and access needs. Individual users may opt for single-user licenses, while businesses requiring broader access may choose multi-user or enterprise licenses for cost-effective access to the report.
13. Are there any additional resources or data provided in the North Africa Battery Industry report?
While the report offers comprehensive insights, it's advisable to review the specific contents or supplementary materials provided to ascertain if additional resources or data are available.
14. How can I stay updated on further developments or reports in the North Africa Battery Industry?
To stay informed about further developments, trends, and reports in the North Africa Battery Industry, consider subscribing to industry newsletters, following relevant companies and organizations, or regularly checking reputable industry news sources and publications.
Methodology
Step 1 - Identification of Relevant Samples Size from Population Database


Step 2 - Approaches for Defining Global Market Size (Value, Volume* & Price*)

Note*: In applicable scenarios
Step 3 - Data Sources
Primary Research
- Web Analytics
- Survey Reports
- Research Institute
- Latest Research Reports
- Opinion Leaders
Secondary Research
- Annual Reports
- White Paper
- Latest Press Release
- Industry Association
- Paid Database
- Investor Presentations

Step 4 - Data Triangulation
Involves using different sources of information in order to increase the validity of a study
These sources are likely to be stakeholders in a program - participants, other researchers, program staff, other community members, and so on.
Then we put all data in single framework & apply various statistical tools to find out the dynamic on the market.
During the analysis stage, feedback from the stakeholder groups would be compared to determine areas of agreement as well as areas of divergence