Key Insights
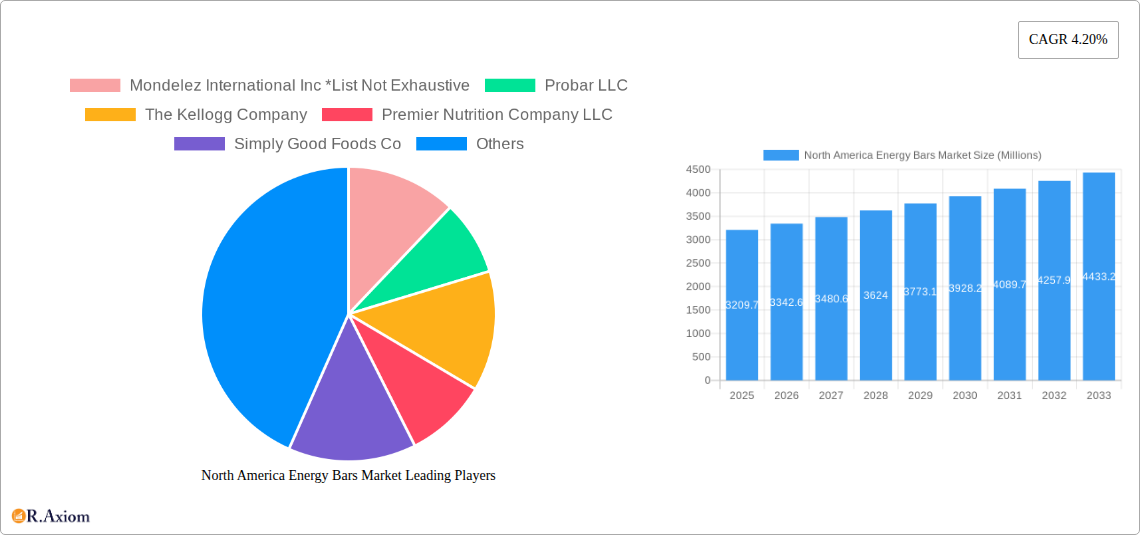
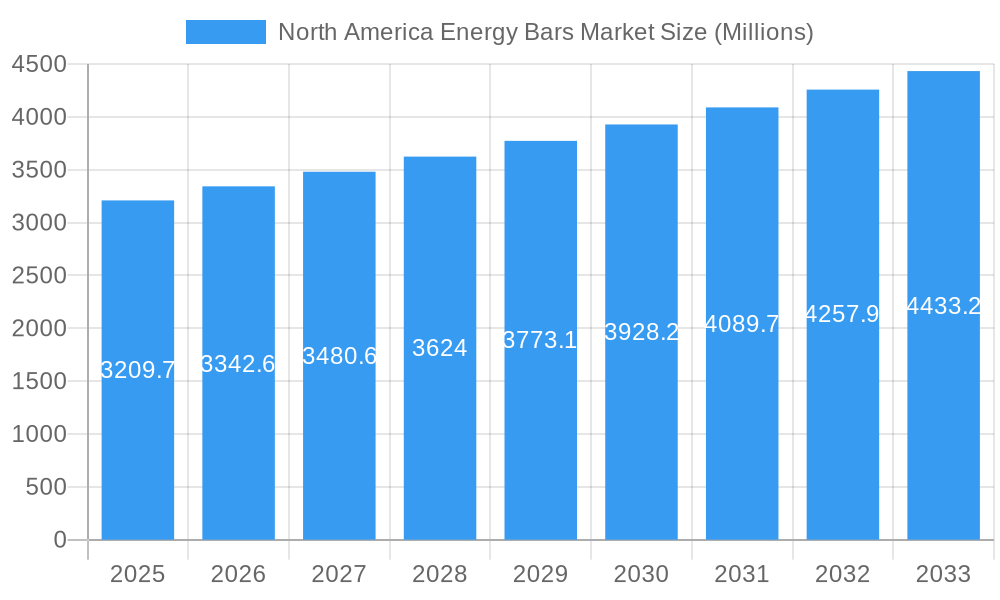
The North American energy bar market, valued at $3,209.7 million in 2025, is projected to experience steady growth, driven by increasing health consciousness and demand for convenient, nutritious snacks. The market's Compound Annual Growth Rate (CAGR) of 4.20% from 2025 to 2033 indicates a robust expansion, primarily fueled by the rising popularity of active lifestyles and the convenience offered by energy bars as a quick fuel source before or after workouts. Key distribution channels include supermarkets/hypermarkets, convenience stores, and the rapidly expanding online retail sector. Major players like Mondelez International, Kellogg's, and General Mills are actively engaged in product innovation and strategic partnerships to capture market share. Consumer preferences are shifting towards bars with natural ingredients, less sugar, and added protein or functional benefits, driving innovation in product formulations and ingredients. While pricing pressures and intense competition among established brands and emerging players remain a challenge, the overall market outlook remains positive, driven by the continued growth in health and wellness trends.
North America Energy Bars Market Market Size (In Billion)
The segment breakdown shows a significant contribution from supermarkets and hypermarkets, reflecting the established presence of energy bars within traditional retail channels. However, the online retail segment is poised for substantial growth, mirroring broader e-commerce trends and increasing consumer reliance on online shopping for convenience. Further segmentation data (not provided) on flavors, ingredients, and target demographics (e.g., athletes, health-conscious consumers) would offer a more granular understanding of market dynamics. The North American market, including the United States, Canada, and Mexico, represents a significant portion of the global energy bar market and is expected to remain a key growth driver. Future market projections suggest sustained growth, particularly in areas aligned with evolving consumer preferences for clean-label products and functional benefits.
North America Energy Bars Market Company Market Share
North America Energy Bars Market: A Comprehensive Report (2019-2033)
This in-depth report provides a comprehensive analysis of the North America energy bars market, covering historical data (2019-2024), the current market (2025), and future projections (2025-2033). It delves into market dynamics, competitive landscapes, and key growth drivers, offering actionable insights for stakeholders across the industry. The report utilizes data in Millions (M) for all values.
North America Energy Bars Market Market Concentration & Innovation
This section analyzes the North America energy bars market's concentration, innovation drivers, regulatory frameworks, product substitutes, end-user trends, and mergers and acquisitions (M&A) activities. The market exhibits moderate concentration, with the top five players holding approximately xx% of the market share in 2025. Key players are actively investing in research and development to introduce innovative products catering to evolving consumer preferences. For example, the rise of plant-based and protein-rich energy bars reflects this trend. Regulatory frameworks, including labeling requirements and food safety standards, significantly impact the market. The presence of substitute products, like protein shakes and fruit snacks, poses a competitive challenge. Consumer trends, including health consciousness and on-the-go snacking, are major growth drivers. M&A activity has been significant, with notable deals such as Mondelez International's acquisition of Clif Bar & Company in August 2022, impacting market share and competitive dynamics. The total value of M&A deals in the energy bar sector between 2019 and 2024 was approximately $xxM.
- Market Concentration: Top 5 players hold approximately xx% market share (2025).
- Innovation Drivers: Growing demand for functional foods, health consciousness, and on-the-go consumption.
- Regulatory Framework: Stringent food safety regulations and labeling requirements.
- Product Substitutes: Protein shakes, fruit snacks, and other convenient snacks.
- End-User Trends: Preference for healthy, convenient, and functional snacks.
- M&A Activity: Significant deals driving consolidation and expansion (e.g., Mondelez's acquisition of Clif Bar).
North America Energy Bars Market Industry Trends & Insights
The North America energy bars market is experiencing robust growth, driven by several factors. The increasing prevalence of health-conscious consumers seeking convenient, nutritious snacks is a key driver. The rising popularity of fitness and active lifestyles further fuels demand. Technological advancements in food processing and formulation allow for the creation of innovative energy bars with enhanced nutritional profiles and improved taste. The market is characterized by intense competition, with both established players and emerging brands vying for market share. Consumer preferences are shifting towards clean-label products, organic ingredients, and functional attributes such as high protein content and added vitamins. The market’s Compound Annual Growth Rate (CAGR) is projected to be xx% during the forecast period (2025-2033), with market penetration expected to reach xx% by 2033. This growth is supported by increasing disposable incomes and changing dietary habits across the region. E-commerce platforms are also playing a significant role in expanding market access.
Dominant Markets & Segments in North America Energy Bars Market
The supermarket/hypermarket channel remains the dominant distribution channel for energy bars in North America, accounting for xx% of the market in 2025. This dominance stems from their wide reach, established consumer base, and availability of diverse product assortments. Convenience stores contribute significantly due to their strategic locations and the impulsive purchasing nature of consumers. Online retail stores are exhibiting rapid growth, propelled by rising internet penetration and the convenience of online shopping. The US market represents the largest regional segment, driven by high energy bar consumption and a substantial population base. Canada follows, characterized by increased health consciousness.
Supermarkets/Hypermarkets: Wide reach, established customer base, and diverse product assortment.
Convenience Stores: Strategic locations and impulsive purchases.
Online Retail Stores: Increasing online shopping and convenience.
Other Distribution Channels: Specialty stores, direct-to-consumer channels.
Key Drivers for Dominance:
- US Market: Large population, high energy bar consumption, strong economy.
- Canada Market: Growing health consciousness and disposable incomes.
- Supermarkets/Hypermarkets: Established infrastructure, wide reach, and established customer base.
North America Energy Bars Market Product Developments
The energy bar market is witnessing continuous product innovation, with manufacturers focusing on enhanced taste, texture, and functionality. Technological advancements enable the creation of healthier, more convenient, and appealing energy bars. This includes the development of plant-based bars, protein-enhanced options, and bars with added functional ingredients like probiotics or adaptogens. These innovations cater to evolving consumer preferences and differentiate products in a competitive market. Manufacturers are also leveraging sustainable packaging options to enhance their brand image and appeal to environmentally conscious consumers.
Report Scope & Segmentation Analysis
This report segments the North America energy bars market by distribution channel: Supermarkets/Hypermarkets, Convenience Stores, Online Retail Stores, and Other Distribution Channels. Each segment is analyzed based on market size, growth projections, and competitive dynamics. Supermarkets/hypermarkets are projected to maintain significant growth due to their wide reach, while online retail stores are expected to experience the highest growth rate driven by the rising popularity of online shopping. Convenience stores offer a stable market with steady growth, while the "other" segment, encompassing various niche channels, displays moderate growth potential.
Key Drivers of North America Energy Bars Market Growth
Several factors propel the growth of the North America energy bars market. The growing health-conscious population increasingly chooses convenient, nutritious snacks like energy bars. The rise in popularity of fitness and active lifestyles fuels demand. Technological advancements in food processing and formulation result in innovative energy bars with better taste, texture, and health benefits. The rising disposable incomes enable consumers to purchase premium, functional energy bars. Favorable government regulations and support for healthy food options further support market expansion.
Challenges in the North America Energy Bars Market Sector
The North America energy bars market faces several challenges. Intense competition from numerous established and emerging brands requires manufacturers to constantly innovate and offer unique product offerings. Fluctuations in the prices of raw materials, particularly nuts and seeds, can impact profitability. Stringent food safety regulations and evolving consumer demands necessitate strict quality control and compliance. Maintaining a consistent supply chain, especially during periods of increased demand, poses another challenge. These factors may restrain market growth if not managed effectively. The combined impact of these challenges on market growth is estimated to be around xx% reduction annually.
Emerging Opportunities in North America Energy Bars Market
The North America energy bars market presents several opportunities. The growing demand for organic, plant-based, and gluten-free options presents significant potential. The incorporation of functional ingredients, like probiotics and adaptogens, will attract health-conscious consumers. Personalized nutrition and customized energy bars are emerging trends. Expansion into new markets and geographical areas holds further growth potential. Leveraging e-commerce and direct-to-consumer strategies can significantly increase market reach and engagement.
Leading Players in the North America Energy Bars Market Market
- Mondelez International Inc
- Probar LLC
- The Kellogg Company
- Premier Nutrition Company LLC
- Simply Good Foods Co
- General Mills Inc
- PepsiCo Inc
- Abbott Laboratories
- Pepsico Inc
- Mars Incorporated
Key Developments in North America Energy Bars Market Industry
- October 2021: CLIF launched CLIF BAR Mini and CLIF BUILDER Mini in Canada, expanding its plant-based energy bar offerings.
- August 2022: Mondelez International acquired Clif Bar & Company, significantly expanding its presence in the North American energy bar market.
- November 2022: Lola Snacks partnered with CA Fortune to expand its US distribution network, increasing its market reach.
Strategic Outlook for North America Energy Bars Market Market
The North America energy bars market exhibits substantial growth potential, driven by evolving consumer preferences, technological advancements, and the increasing focus on health and wellness. The market is expected to maintain a robust growth trajectory over the forecast period, offering significant opportunities for both established players and new entrants. Strategic initiatives such as product diversification, strategic partnerships, and expansion into new distribution channels will be crucial for achieving long-term success in this dynamic market. Companies that can adapt to evolving consumer demands and embrace innovative technologies are poised to capture significant market share.
North America Energy Bars Market Segmentation
-
1. Distribution Channel
- 1.1. Supermarkets/Hypermarkets
- 1.2. Convenience Stores
- 1.3. Online Retail Stores
- 1.4. Other Distribution Channels
-
2. Geography
-
2.1. North America
- 2.1.1. United States
- 2.1.2. Canada
- 2.1.3. Mexico
- 2.1.4. Rest of North America
-
2.1. North America
North America Energy Bars Market Segmentation By Geography
-
1. North America
- 1.1. United States
- 1.2. Canada
- 1.3. Mexico
- 1.4. Rest of North America
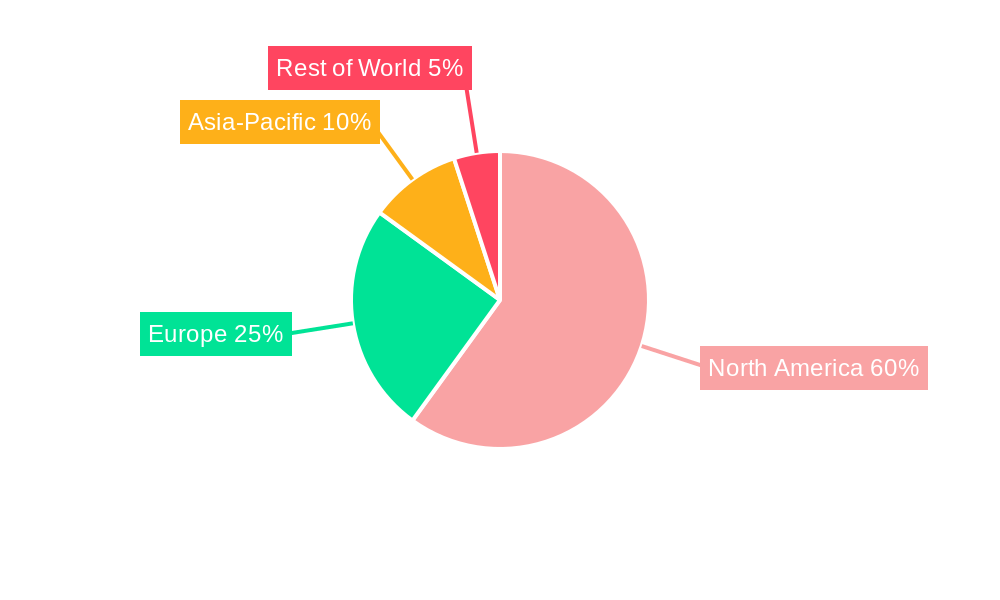
North America Energy Bars Market Regional Market Share
Geographic Coverage of North America Energy Bars Market
North America Energy Bars Market REPORT HIGHLIGHTS
| Aspects | Details |
|---|---|
| Study Period | 2020-2034 |
| Base Year | 2025 |
| Estimated Year | 2026 |
| Forecast Period | 2026-2034 |
| Historical Period | 2020-2025 |
| Growth Rate | CAGR of 4.20% from 2020-2034 |
| Segmentation |
|
Table of Contents
- 1. Introduction
- 1.1. Research Scope
- 1.2. Market Segmentation
- 1.3. Research Methodology
- 1.4. Definitions and Assumptions
- 2. Executive Summary
- 2.1. Introduction
- 3. Market Dynamics
- 3.1. Introduction
- 3.2. Market Drivers
- 3.2.1. Increasing Demand for Clean Label Ingredients; Growing Health Consciousness of Consumers
- 3.3. Market Restrains
- 3.3.1. Higher Manufacturing Cost
- 3.4. Market Trends
- 3.4.1. Increasing Number of Health and Fitness Centers
- 4. Market Factor Analysis
- 4.1. Porters Five Forces
- 4.2. Supply/Value Chain
- 4.3. PESTEL analysis
- 4.4. Market Entropy
- 4.5. Patent/Trademark Analysis
- 5. North America Energy Bars Market Analysis, Insights and Forecast, 2020-2032
- 5.1. Market Analysis, Insights and Forecast - by Distribution Channel
- 5.1.1. Supermarkets/Hypermarkets
- 5.1.2. Convenience Stores
- 5.1.3. Online Retail Stores
- 5.1.4. Other Distribution Channels
- 5.2. Market Analysis, Insights and Forecast - by Geography
- 5.2.1. North America
- 5.2.1.1. United States
- 5.2.1.2. Canada
- 5.2.1.3. Mexico
- 5.2.1.4. Rest of North America
- 5.2.1. North America
- 5.3. Market Analysis, Insights and Forecast - by Region
- 5.3.1. North America
- 5.1. Market Analysis, Insights and Forecast - by Distribution Channel
- 6. Competitive Analysis
- 6.1. Market Share Analysis 2025
- 6.2. Company Profiles
- 6.2.1 Mondelez International Inc *List Not Exhaustive
- 6.2.1.1. Overview
- 6.2.1.2. Products
- 6.2.1.3. SWOT Analysis
- 6.2.1.4. Recent Developments
- 6.2.1.5. Financials (Based on Availability)
- 6.2.2 Probar LLC
- 6.2.2.1. Overview
- 6.2.2.2. Products
- 6.2.2.3. SWOT Analysis
- 6.2.2.4. Recent Developments
- 6.2.2.5. Financials (Based on Availability)
- 6.2.3 The Kellogg Company
- 6.2.3.1. Overview
- 6.2.3.2. Products
- 6.2.3.3. SWOT Analysis
- 6.2.3.4. Recent Developments
- 6.2.3.5. Financials (Based on Availability)
- 6.2.4 Premier Nutrition Company LLC
- 6.2.4.1. Overview
- 6.2.4.2. Products
- 6.2.4.3. SWOT Analysis
- 6.2.4.4. Recent Developments
- 6.2.4.5. Financials (Based on Availability)
- 6.2.5 Simply Good Foods Co
- 6.2.5.1. Overview
- 6.2.5.2. Products
- 6.2.5.3. SWOT Analysis
- 6.2.5.4. Recent Developments
- 6.2.5.5. Financials (Based on Availability)
- 6.2.6 General Mills Inc
- 6.2.6.1. Overview
- 6.2.6.2. Products
- 6.2.6.3. SWOT Analysis
- 6.2.6.4. Recent Developments
- 6.2.6.5. Financials (Based on Availability)
- 6.2.7 PepsiCo Inc
- 6.2.7.1. Overview
- 6.2.7.2. Products
- 6.2.7.3. SWOT Analysis
- 6.2.7.4. Recent Developments
- 6.2.7.5. Financials (Based on Availability)
- 6.2.8 Abbott Laboratories
- 6.2.8.1. Overview
- 6.2.8.2. Products
- 6.2.8.3. SWOT Analysis
- 6.2.8.4. Recent Developments
- 6.2.8.5. Financials (Based on Availability)
- 6.2.9 Pepsico Inc
- 6.2.9.1. Overview
- 6.2.9.2. Products
- 6.2.9.3. SWOT Analysis
- 6.2.9.4. Recent Developments
- 6.2.9.5. Financials (Based on Availability)
- 6.2.10 Mars Incorporated
- 6.2.10.1. Overview
- 6.2.10.2. Products
- 6.2.10.3. SWOT Analysis
- 6.2.10.4. Recent Developments
- 6.2.10.5. Financials (Based on Availability)
- 6.2.1 Mondelez International Inc *List Not Exhaustive
List of Figures
- Figure 1: North America Energy Bars Market Revenue Breakdown (Millions, %) by Product 2025 & 2033
- Figure 2: North America Energy Bars Market Share (%) by Company 2025
List of Tables
- Table 1: North America Energy Bars Market Revenue Millions Forecast, by Distribution Channel 2020 & 2033
- Table 2: North America Energy Bars Market Volume K Tons Forecast, by Distribution Channel 2020 & 2033
- Table 3: North America Energy Bars Market Revenue Millions Forecast, by Geography 2020 & 2033
- Table 4: North America Energy Bars Market Volume K Tons Forecast, by Geography 2020 & 2033
- Table 5: North America Energy Bars Market Revenue Millions Forecast, by Region 2020 & 2033
- Table 6: North America Energy Bars Market Volume K Tons Forecast, by Region 2020 & 2033
- Table 7: North America Energy Bars Market Revenue Millions Forecast, by Distribution Channel 2020 & 2033
- Table 8: North America Energy Bars Market Volume K Tons Forecast, by Distribution Channel 2020 & 2033
- Table 9: North America Energy Bars Market Revenue Millions Forecast, by Geography 2020 & 2033
- Table 10: North America Energy Bars Market Volume K Tons Forecast, by Geography 2020 & 2033
- Table 11: North America Energy Bars Market Revenue Millions Forecast, by Country 2020 & 2033
- Table 12: North America Energy Bars Market Volume K Tons Forecast, by Country 2020 & 2033
- Table 13: United States North America Energy Bars Market Revenue (Millions) Forecast, by Application 2020 & 2033
- Table 14: United States North America Energy Bars Market Volume (K Tons) Forecast, by Application 2020 & 2033
- Table 15: Canada North America Energy Bars Market Revenue (Millions) Forecast, by Application 2020 & 2033
- Table 16: Canada North America Energy Bars Market Volume (K Tons) Forecast, by Application 2020 & 2033
- Table 17: Mexico North America Energy Bars Market Revenue (Millions) Forecast, by Application 2020 & 2033
- Table 18: Mexico North America Energy Bars Market Volume (K Tons) Forecast, by Application 2020 & 2033
- Table 19: Rest of North America North America Energy Bars Market Revenue (Millions) Forecast, by Application 2020 & 2033
- Table 20: Rest of North America North America Energy Bars Market Volume (K Tons) Forecast, by Application 2020 & 2033
Frequently Asked Questions
1. What is the projected Compound Annual Growth Rate (CAGR) of the North America Energy Bars Market?
The projected CAGR is approximately 4.20%.
2. Which companies are prominent players in the North America Energy Bars Market?
Key companies in the market include Mondelez International Inc *List Not Exhaustive, Probar LLC, The Kellogg Company, Premier Nutrition Company LLC, Simply Good Foods Co, General Mills Inc, PepsiCo Inc, Abbott Laboratories, Pepsico Inc, Mars Incorporated.
3. What are the main segments of the North America Energy Bars Market?
The market segments include Distribution Channel, Geography.
4. Can you provide details about the market size?
The market size is estimated to be USD 3,209.7 Millions as of 2022.
5. What are some drivers contributing to market growth?
Increasing Demand for Clean Label Ingredients; Growing Health Consciousness of Consumers.
6. What are the notable trends driving market growth?
Increasing Number of Health and Fitness Centers.
7. Are there any restraints impacting market growth?
Higher Manufacturing Cost.
8. Can you provide examples of recent developments in the market?
November 2022: Lola Snacks, a probiotic energy bar company, partnered with CA Fortune to expand its distribution of energy bars in the United States. The company's energy bars are available in natural and conventional grocery stores across the country.
9. What pricing options are available for accessing the report?
Pricing options include single-user, multi-user, and enterprise licenses priced at USD 4750, USD 5250, and USD 8750 respectively.
10. Is the market size provided in terms of value or volume?
The market size is provided in terms of value, measured in Millions and volume, measured in K Tons.
11. Are there any specific market keywords associated with the report?
Yes, the market keyword associated with the report is "North America Energy Bars Market," which aids in identifying and referencing the specific market segment covered.
12. How do I determine which pricing option suits my needs best?
The pricing options vary based on user requirements and access needs. Individual users may opt for single-user licenses, while businesses requiring broader access may choose multi-user or enterprise licenses for cost-effective access to the report.
13. Are there any additional resources or data provided in the North America Energy Bars Market report?
While the report offers comprehensive insights, it's advisable to review the specific contents or supplementary materials provided to ascertain if additional resources or data are available.
14. How can I stay updated on further developments or reports in the North America Energy Bars Market?
To stay informed about further developments, trends, and reports in the North America Energy Bars Market, consider subscribing to industry newsletters, following relevant companies and organizations, or regularly checking reputable industry news sources and publications.
Methodology
Step 1 - Identification of Relevant Samples Size from Population Database


Step 2 - Approaches for Defining Global Market Size (Value, Volume* & Price*)

Note*: In applicable scenarios
Step 3 - Data Sources
Primary Research
- Web Analytics
- Survey Reports
- Research Institute
- Latest Research Reports
- Opinion Leaders
Secondary Research
- Annual Reports
- White Paper
- Latest Press Release
- Industry Association
- Paid Database
- Investor Presentations

Step 4 - Data Triangulation
Involves using different sources of information in order to increase the validity of a study
These sources are likely to be stakeholders in a program - participants, other researchers, program staff, other community members, and so on.
Then we put all data in single framework & apply various statistical tools to find out the dynamic on the market.
During the analysis stage, feedback from the stakeholder groups would be compared to determine areas of agreement as well as areas of divergence

