

Key Insights
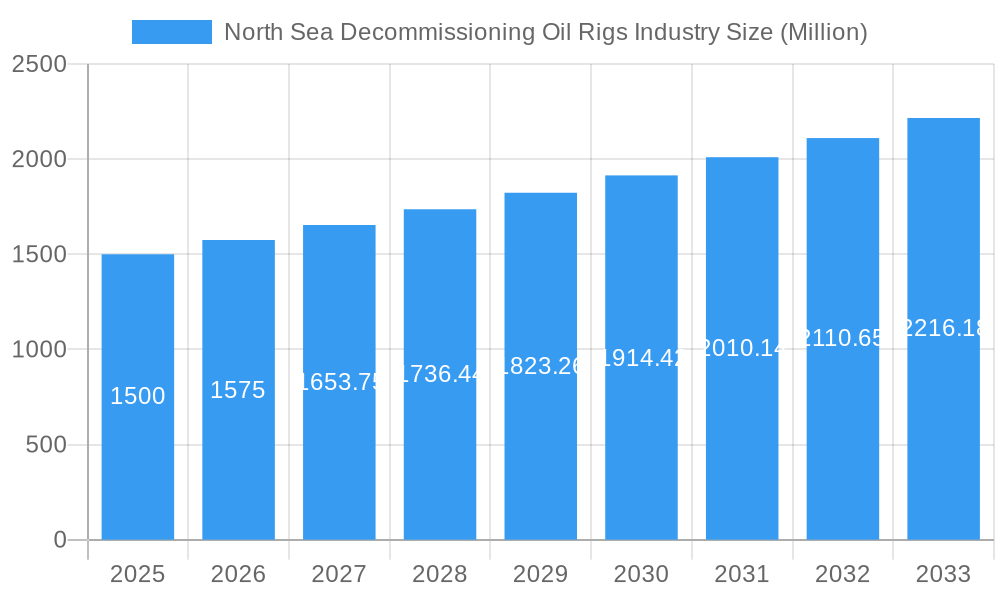
The North Sea Decommissioning Oil Rigs market is experiencing robust growth, driven by the aging infrastructure of offshore oil and gas platforms and increasingly stringent environmental regulations. The market's Compound Annual Growth Rate (CAGR) exceeding 5% indicates a significant expansion projected through 2033. This growth is fueled by several key factors, including the rising number of platforms nearing the end of their operational lifespan, necessitating costly decommissioning processes. Furthermore, governmental policies promoting environmental sustainability and minimizing the environmental impact of offshore operations are accelerating the decommissioning process. The North Sea, a historically significant oil and gas production region, is at the forefront of this trend, presenting substantial opportunities for specialized service providers. The segmentation within the market reflects the diverse challenges associated with decommissioning at varying water depths; shallow water decommissioning projects generally present fewer logistical complexities compared to deepwater or ultra-deepwater operations, influencing project costs and timelines significantly. Key players, including Aker Solutions ASA, DNV GL, and Heerema Marine Contractors, are actively investing in advanced technologies and specialized vessels to capitalize on this burgeoning market.
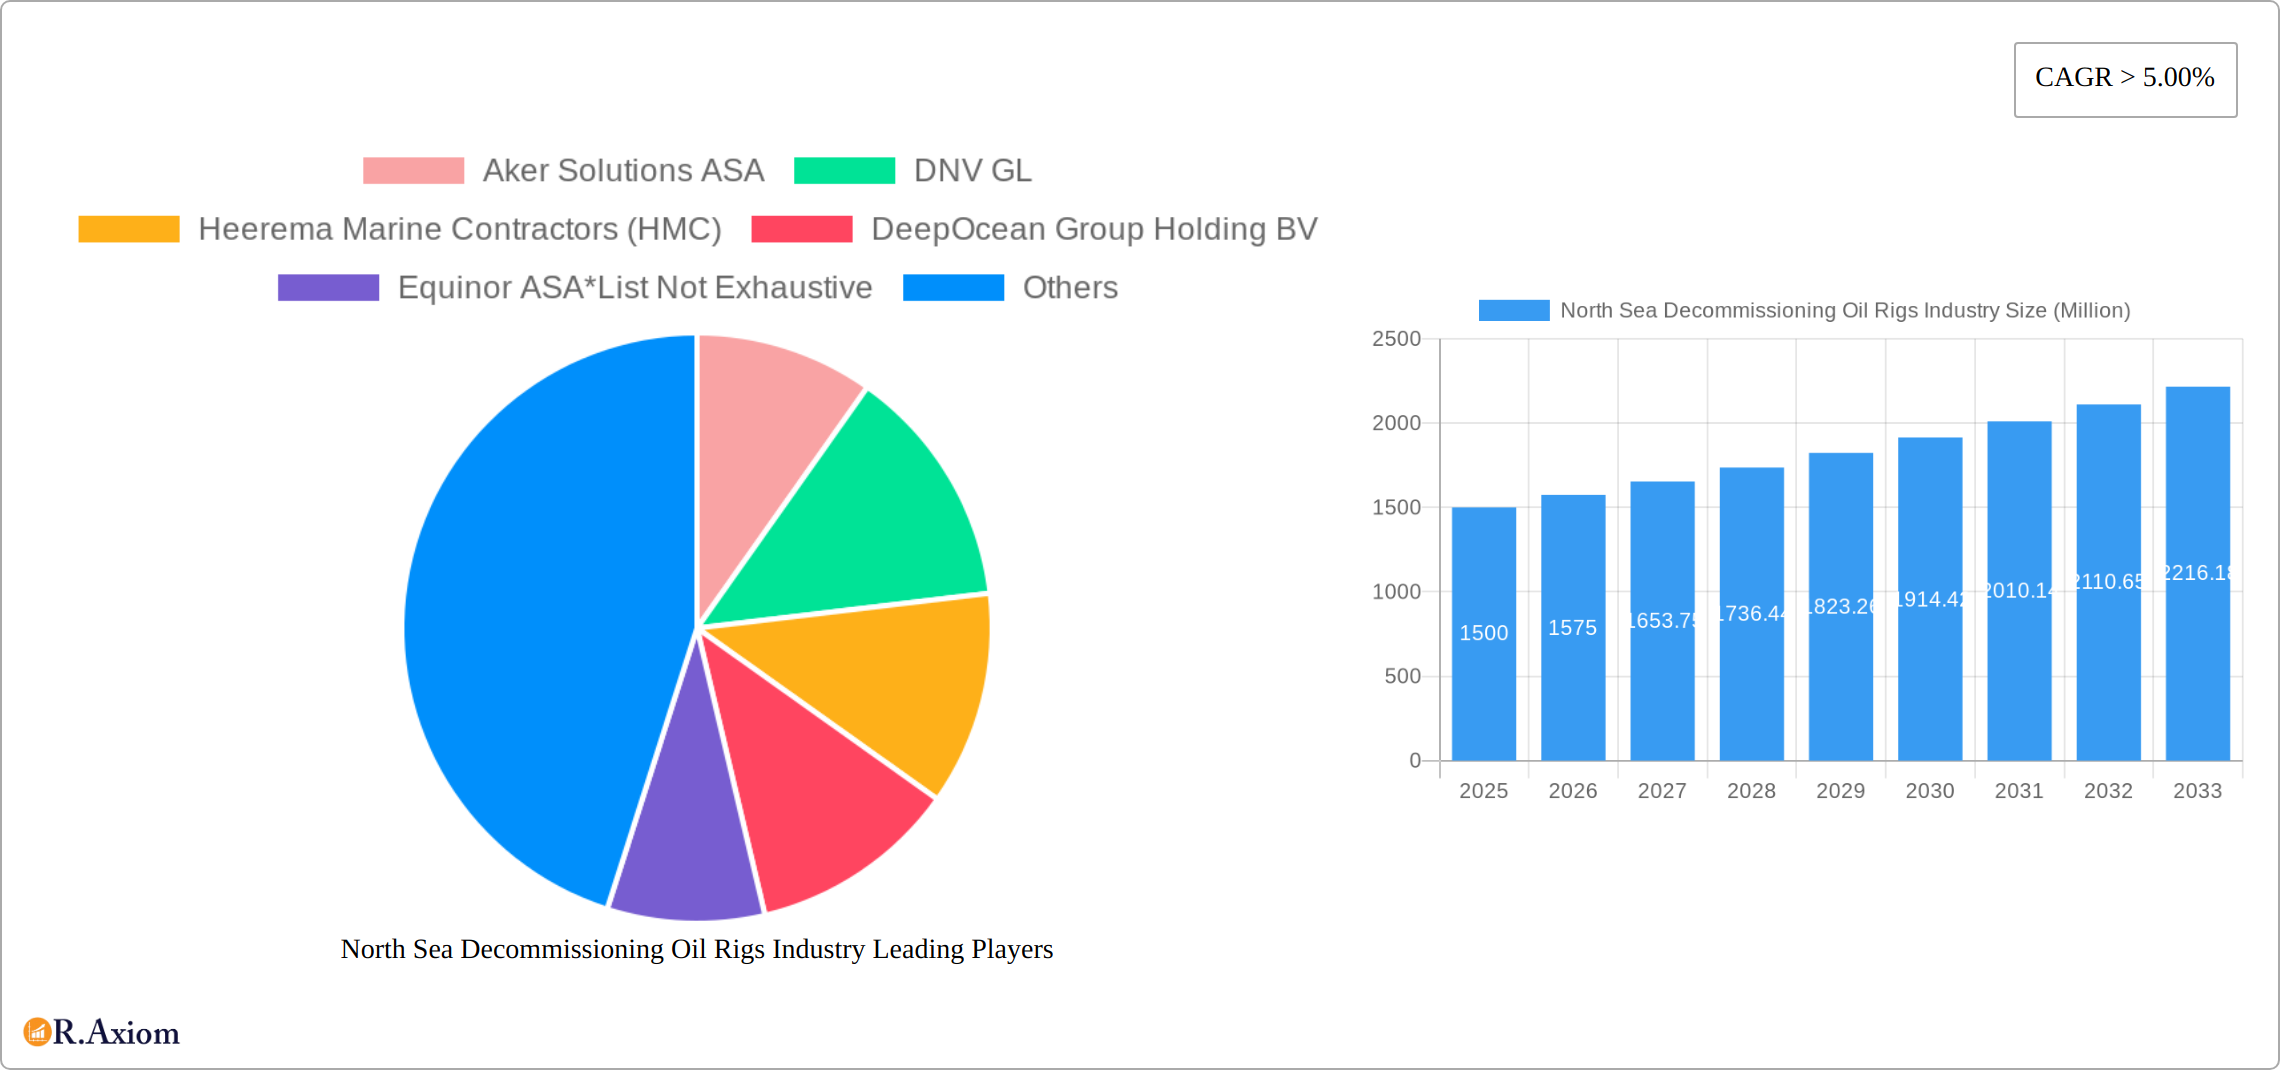
North Sea Decommissioning Oil Rigs Industry Market Size (In Billion)
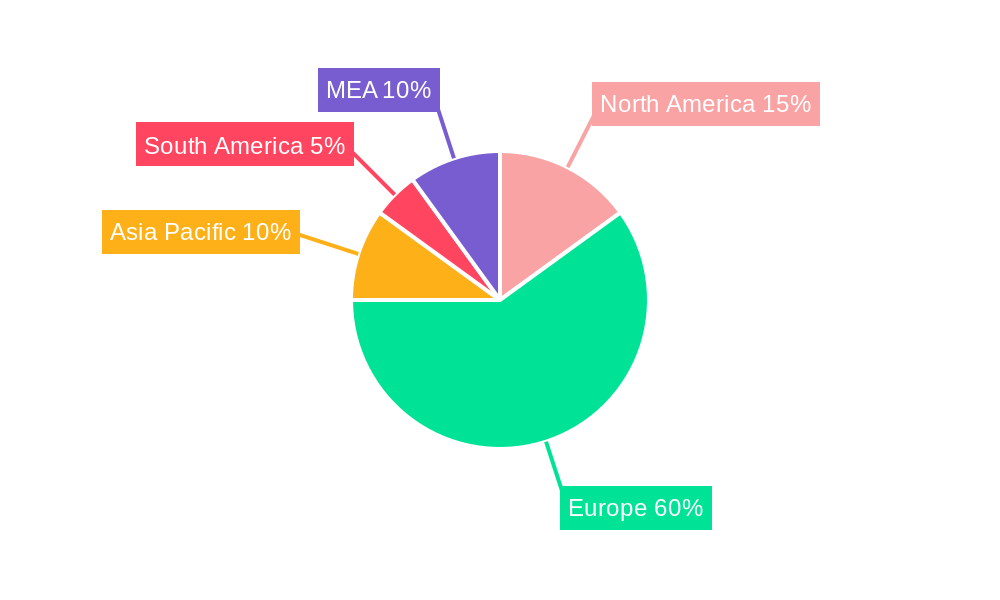
The regional breakdown reveals a concentration of activity in Europe, particularly the North Sea region itself, but also demonstrates opportunities within North America and other regions. The high capital expenditure associated with decommissioning projects, alongside the intricate technical and logistical challenges involved, creates significant barriers to entry for smaller companies. However, the long-term prospects for this market remain exceptionally strong, driven by the inevitable need for decommissioning existing infrastructure and the ongoing advancements in technological solutions that are improving efficiency and reducing environmental impact. Future growth will be influenced by fluctuating oil prices, evolving regulatory frameworks, and ongoing advancements in decommissioning technologies that may reduce overall market size estimates in the long term. However, for the foreseeable future, the North Sea, and indeed the global decommissioning market, will continue to present substantial growth opportunities.
North Sea Decommissioning Oil Rigs Industry Company Market Share
North Sea Decommissioning Oil Rigs Industry: A Comprehensive Market Report (2019-2033)
This comprehensive market report provides an in-depth analysis of the North Sea decommissioning oil rigs industry, covering the period from 2019 to 2033. It offers actionable insights for industry stakeholders, investors, and businesses operating within this dynamic sector. The report leverages extensive data analysis and expert insights to present a clear and concise overview of market trends, competitive landscapes, and future growth prospects. The study period spans 2019-2033, with 2025 serving as both the base and estimated year. The forecast period is 2025-2033, and the historical period is 2019-2024.
North Sea Decommissioning Oil Rigs Industry Market Concentration & Innovation
This section provides a comprehensive analysis of the North Sea decommissioning oil rigs market, examining its concentration, innovation drivers, regulatory landscape, substitute products, end-user trends, and mergers and acquisitions (M&A) activity. The report details the market share of key players, including but not limited to Aker Solutions ASA, DNV GL, Heerema Marine Contractors (HMC), DeepOcean Group Holding BV, Equinor ASA, Able UK, John Wood Group PLC, TechnipFMC PLC, AF Gruppen SA, and Allseas Group. Market concentration is meticulously assessed using relevant metrics such as the Herfindahl-Hirschman Index (HHI), providing a clear picture of the competitive landscape. The analysis explores the transformative impact of technological advancements, specifically highlighting the roles of automation, robotics, and advanced materials in enhancing decommissioning efficiency and safety. Furthermore, the influence of regulatory frameworks, encompassing environmental regulations and safety standards, is thoroughly investigated. The report considers the potential emergence of substitute products and their impact on market growth trajectories, while also examining end-user trends and their evolving needs and preferences. Finally, a review of significant M&A activities is presented, including detailed deal values (in Millions) and their implications for market consolidation and future growth prospects. For instance, a major M&A deal valued at [Insert Specific Deal Value and Company Names] significantly reshaped the competitive dynamics within the market.
North Sea Decommissioning Oil Rigs Industry Industry Trends & Insights
This section provides a detailed analysis of key industry trends and insights, examining market growth drivers, technological disruptions, consumer preferences, and competitive dynamics. The report projects a Compound Annual Growth Rate (CAGR) of xx% for the forecast period (2025-2033), based on an estimated market size of xx Million in 2025. Market penetration of advanced decommissioning technologies is expected to reach xx% by 2033. The analysis identifies key growth drivers, such as increasing regulatory pressure to decommission aging infrastructure, technological advancements leading to more efficient and cost-effective decommissioning methods, and the growing demand for specialized services in this niche market. The impact of technological disruptions, including advancements in robotics, AI, and remote operations, is explored. The report also considers shifts in consumer preferences, including increased emphasis on sustainability and environmental responsibility. Furthermore, it analyzes competitive dynamics, including pricing strategies, market positioning, and the entry of new players into the market.
Dominant Markets & Segments in North Sea Decommissioning Oil Rigs Industry
This section identifies the dominant markets and segments within the North Sea decommissioning oil rigs industry. Based on our analysis, the UK segment is projected to hold a dominant position in the market throughout the forecast period, followed by Norway. The factors contributing to this dominance are explored using specific metrics and data points.
Key Drivers of UK Dominance:
- Extensive existing oil and gas infrastructure requiring decommissioning.
- Established regulatory framework and supportive government policies.
- Presence of major oil and gas companies and specialized decommissioning contractors.
- Well-developed supply chain and infrastructure supporting decommissioning operations.
A detailed analysis of the dominance of the UK sector is provided, along with a comparative analysis of other regions in the North Sea. Market size for each of the water depth segments (Shallow Water, Deepwater, and Ultra-deepwater) is projected, along with associated growth rates and factors influencing market dynamics.
North Sea Decommissioning Oil Rigs Industry Product Developments
This section summarizes recent and projected product innovations, applications, and competitive advantages within the North Sea decommissioning oil rigs industry. Technological trends, such as the increased use of remotely operated vehicles (ROVs) and autonomous underwater vehicles (AUVs) for inspection and dismantling, are highlighted. The market fit of new technologies is assessed, considering factors such as cost-effectiveness, safety, and environmental impact.
Report Scope & Segmentation Analysis
This report segments the North Sea decommissioning oil rigs market based on water depth into three key categories: Shallow Water, Deepwater, and Ultra-deepwater.
Shallow Water: This segment encompasses decommissioning projects in relatively shallow waters, generally up to [Insert Specific Depth] meters. While growth is projected to be relatively stable due to the mature nature of shallow-water fields and the generally lower decommissioning costs, [Insert Specific details regarding market size, technological challenges, or emerging trends].
Deepwater: This segment includes decommissioning projects in water depths ranging from [Insert Specific Depth] meters to [Insert Specific Depth] meters. This segment is poised for significant growth due to the increasing number of aging deepwater facilities requiring decommissioning. [Insert Specific details regarding market size, technological challenges, or emerging trends].
Ultra-deepwater: This segment comprises the most technically challenging decommissioning projects in water depths exceeding [Insert Specific Depth] meters. Growth, while slower, will remain notable due to the highly specialized technology and expertise required. [Insert Specific details regarding market size, technological challenges, or emerging trends].
The report provides a detailed analysis of each segment's market size, growth projections, and competitive dynamics, offering a comprehensive understanding of the market landscape.
Key Drivers of North Sea Decommissioning Oil Rigs Industry Growth
The growth of the North Sea decommissioning oil rigs industry is fueled by several key factors. Stringent regulatory requirements mandating the decommissioning of aging platforms are a major catalyst, alongside advancements in technology that enable more efficient and safer decommissioning processes. Furthermore, government incentives and financial support for decommissioning projects, coupled with the rising awareness of environmental concerns and the growing demand for sustainable practices within the offshore industry, are driving significant market expansion. [Add other factors such as advancements in recycling technology or evolving environmental regulations]
Challenges in the North Sea Decommissioning Oil Rigs Industry Sector
The North Sea decommissioning oil rigs industry faces several challenges. High decommissioning costs, stringent environmental regulations, and potential delays due to complex logistical and operational challenges significantly affect profitability. Furthermore, the industry is impacted by skilled labor shortages and the need for specialized equipment, leading to increased costs and project timelines. The limited number of experienced contractors further intensifies the pressure.
Emerging Opportunities in North Sea Decommissioning Oil Rigs Industry
Emerging opportunities exist in the development and adoption of innovative technologies such as advanced robotics, AI-powered solutions, and sustainable decommissioning techniques. The reuse and repurposing of decommissioned structures for other purposes (e.g., artificial reefs) presents promising avenues. Expanding into new geographical areas with aging offshore structures also creates market potential.
Leading Players in the North Sea Decommissioning Oil Rigs Industry Market
Key Developments in North Sea Decommissioning Oil Rigs Industry Industry
- January 2023: Successful completion of a major decommissioning project utilizing innovative robotic technology, resulting in a xx% reduction in project duration and [Add quantifiable benefits like cost savings or improved safety].
- June 2022: Announcement of a significant M&A deal in the sector, valued at xx Million, leading to [Specific consequences of the M&A, e.g., expanded market share, new technological capabilities].
- October 2021: Introduction of new environmental regulations impacting decommissioning practices and increasing compliance costs, necessitating [Specific industry responses to the new regulations].
- [Add at least 2 more recent key developments with specific details and impacts]
(Further key developments with dates and detailed impact assessments will be provided in the full report)
Strategic Outlook for North Sea Decommissioning Oil Rigs Industry Market
The North Sea decommissioning oil rigs industry is poised for continued growth driven by the aging infrastructure and stringent regulatory mandates. Technological advancements and a focus on sustainable solutions will shape the industry's evolution. The increasing involvement of specialized service providers along with a heightened focus on safety and environmental compliance is creating significant opportunities for strategic growth and innovation. The market anticipates a substantial increase in investment in the coming years, furthering the sector’s expansion.
North Sea Decommissioning Oil Rigs Industry Segmentation
-
1. Water Depth
- 1.1. Shallow Water
- 1.2. Deepwater and Ultra-deepwater
-
2. Geography
- 2.1. United Kingdom
- 2.2. Norway
- 2.3. Rest of North Sea
North Sea Decommissioning Oil Rigs Industry Segmentation By Geography
- 1. United Kingdom
- 2. Norway
- 3. Rest of North Sea
North Sea Decommissioning Oil Rigs Industry Regional Market Share
Geographic Coverage of North Sea Decommissioning Oil Rigs Industry
North Sea Decommissioning Oil Rigs Industry REPORT HIGHLIGHTS
| Aspects | Details |
|---|---|
| Study Period | 2020-2034 |
| Base Year | 2025 |
| Estimated Year | 2026 |
| Forecast Period | 2026-2034 |
| Historical Period | 2020-2025 |
| Growth Rate | CAGR of 8.2% from 2020-2034 |
| Segmentation |
|
Table of Contents
- 1. Introduction
- 1.1. Research Scope
- 1.2. Market Segmentation
- 1.3. Research Objective
- 1.4. Definitions and Assumptions
- 2. Executive Summary
- 2.1. Market Snapshot
- 3. Market Dynamics
- 3.1. Market Drivers
- 3.2. Market Restrains
- 3.3. Market Trends
- 3.4. Market Opportunities
- 4. Market Factor Analysis
- 4.1. Porters Five Forces
- 4.1.1. Bargaining Power of Suppliers
- 4.1.2. Bargaining Power of Buyers
- 4.1.3. Threat of New Entrants
- 4.1.4. Threat of Substitutes
- 4.1.5. Competitive Rivalry
- 4.2. PESTEL analysis
- 4.3. BCG Analysis
- 4.3.1. Stars (High Growth, High Market Share)
- 4.3.2. Cash Cows (Low Growth, High Market Share)
- 4.3.3. Question Mark (High Growth, Low Market Share)
- 4.3.4. Dogs (Low Growth, Low Market Share)
- 4.4. Ansoff Matrix Analysis
- 4.5. Supply Chain Analysis
- 4.6. Regulatory Landscape
- 4.7. Current Market Potential and Opportunity Assessment (TAM–SAM–SOM Framework)
- 4.8. RAX Analyst Note
- 4.1. Porters Five Forces
- 5. Market Analysis, Insights and Forecast 2021-2033
- 5.1. Market Analysis, Insights and Forecast - by Water Depth
- 5.1.1. Shallow Water
- 5.1.2. Deepwater and Ultra-deepwater
- 5.2. Market Analysis, Insights and Forecast - by Geography
- 5.2.1. United Kingdom
- 5.2.2. Norway
- 5.2.3. Rest of North Sea
- 5.3. Market Analysis, Insights and Forecast - by Region
- 5.3.1. United Kingdom
- 5.3.2. Norway
- 5.3.3. Rest of North Sea
- 5.1. Market Analysis, Insights and Forecast - by Water Depth
- 6. Global North Sea Decommissioning Oil Rigs Industry Analysis, Insights and Forecast, 2021-2033
- 6.1. Market Analysis, Insights and Forecast - by Water Depth
- 6.1.1. Shallow Water
- 6.1.2. Deepwater and Ultra-deepwater
- 6.2. Market Analysis, Insights and Forecast - by Geography
- 6.2.1. United Kingdom
- 6.2.2. Norway
- 6.2.3. Rest of North Sea
- 6.1. Market Analysis, Insights and Forecast - by Water Depth
- 7. United Kingdom North Sea Decommissioning Oil Rigs Industry Analysis, Insights and Forecast, 2020-2032
- 7.1. Market Analysis, Insights and Forecast - by Water Depth
- 7.1.1. Shallow Water
- 7.1.2. Deepwater and Ultra-deepwater
- 7.2. Market Analysis, Insights and Forecast - by Geography
- 7.2.1. United Kingdom
- 7.2.2. Norway
- 7.2.3. Rest of North Sea
- 7.1. Market Analysis, Insights and Forecast - by Water Depth
- 8. Norway North Sea Decommissioning Oil Rigs Industry Analysis, Insights and Forecast, 2020-2032
- 8.1. Market Analysis, Insights and Forecast - by Water Depth
- 8.1.1. Shallow Water
- 8.1.2. Deepwater and Ultra-deepwater
- 8.2. Market Analysis, Insights and Forecast - by Geography
- 8.2.1. United Kingdom
- 8.2.2. Norway
- 8.2.3. Rest of North Sea
- 8.1. Market Analysis, Insights and Forecast - by Water Depth
- 9. Rest of North Sea North Sea Decommissioning Oil Rigs Industry Analysis, Insights and Forecast, 2020-2032
- 9.1. Market Analysis, Insights and Forecast - by Water Depth
- 9.1.1. Shallow Water
- 9.1.2. Deepwater and Ultra-deepwater
- 9.2. Market Analysis, Insights and Forecast - by Geography
- 9.2.1. United Kingdom
- 9.2.2. Norway
- 9.2.3. Rest of North Sea
- 9.1. Market Analysis, Insights and Forecast - by Water Depth
- 10. Competitive Analysis
- 10.1. Company Profiles
- 10.1.1 Aker Solutions ASA
- 10.1.1.1. Company Overview
- 10.1.1.2. Products
- 10.1.1.3. Company Financials
- 10.1.1.4. SWOT Analysis
- 10.1.2 DNV GL
- 10.1.2.1. Company Overview
- 10.1.2.2. Products
- 10.1.2.3. Company Financials
- 10.1.2.4. SWOT Analysis
- 10.1.3 Heerema Marine Contractors (HMC)
- 10.1.3.1. Company Overview
- 10.1.3.2. Products
- 10.1.3.3. Company Financials
- 10.1.3.4. SWOT Analysis
- 10.1.4 DeepOcean Group Holding BV
- 10.1.4.1. Company Overview
- 10.1.4.2. Products
- 10.1.4.3. Company Financials
- 10.1.4.4. SWOT Analysis
- 10.1.5 Equinor ASA*List Not Exhaustive
- 10.1.5.1. Company Overview
- 10.1.5.2. Products
- 10.1.5.3. Company Financials
- 10.1.5.4. SWOT Analysis
- 10.1.6 Able UK
- 10.1.6.1. Company Overview
- 10.1.6.2. Products
- 10.1.6.3. Company Financials
- 10.1.6.4. SWOT Analysis
- 10.1.7 John Wood Group PLC
- 10.1.7.1. Company Overview
- 10.1.7.2. Products
- 10.1.7.3. Company Financials
- 10.1.7.4. SWOT Analysis
- 10.1.8 TechnipFMC PLC
- 10.1.8.1. Company Overview
- 10.1.8.2. Products
- 10.1.8.3. Company Financials
- 10.1.8.4. SWOT Analysis
- 10.1.9 AF Gruppen SA
- 10.1.9.1. Company Overview
- 10.1.9.2. Products
- 10.1.9.3. Company Financials
- 10.1.9.4. SWOT Analysis
- 10.1.10 Allseas Group
- 10.1.10.1. Company Overview
- 10.1.10.2. Products
- 10.1.10.3. Company Financials
- 10.1.10.4. SWOT Analysis
- 10.1.1 Aker Solutions ASA
- 10.2. Market Entropy
- 10.2.1 Company's Key Areas Served
- 10.2.2 Recent Developments
- 10.3. Company Market Share Analysis 2025
- 10.3.1 Top 5 Companies Market Share Analysis
- 10.3.2 Top 3 Companies Market Share Analysis
- 10.4. List of Potential Customers
- 11. Research Methodology
List of Figures
- Figure 1: Global North Sea Decommissioning Oil Rigs Industry Revenue Breakdown (undefined, %) by Region 2025 & 2033
- Figure 2: United Kingdom North Sea Decommissioning Oil Rigs Industry Revenue (undefined), by Water Depth 2025 & 2033
- Figure 3: United Kingdom North Sea Decommissioning Oil Rigs Industry Revenue Share (%), by Water Depth 2025 & 2033
- Figure 4: United Kingdom North Sea Decommissioning Oil Rigs Industry Revenue (undefined), by Geography 2025 & 2033
- Figure 5: United Kingdom North Sea Decommissioning Oil Rigs Industry Revenue Share (%), by Geography 2025 & 2033
- Figure 6: United Kingdom North Sea Decommissioning Oil Rigs Industry Revenue (undefined), by Country 2025 & 2033
- Figure 7: United Kingdom North Sea Decommissioning Oil Rigs Industry Revenue Share (%), by Country 2025 & 2033
- Figure 8: Norway North Sea Decommissioning Oil Rigs Industry Revenue (undefined), by Water Depth 2025 & 2033
- Figure 9: Norway North Sea Decommissioning Oil Rigs Industry Revenue Share (%), by Water Depth 2025 & 2033
- Figure 10: Norway North Sea Decommissioning Oil Rigs Industry Revenue (undefined), by Geography 2025 & 2033
- Figure 11: Norway North Sea Decommissioning Oil Rigs Industry Revenue Share (%), by Geography 2025 & 2033
- Figure 12: Norway North Sea Decommissioning Oil Rigs Industry Revenue (undefined), by Country 2025 & 2033
- Figure 13: Norway North Sea Decommissioning Oil Rigs Industry Revenue Share (%), by Country 2025 & 2033
- Figure 14: Rest of North Sea North Sea Decommissioning Oil Rigs Industry Revenue (undefined), by Water Depth 2025 & 2033
- Figure 15: Rest of North Sea North Sea Decommissioning Oil Rigs Industry Revenue Share (%), by Water Depth 2025 & 2033
- Figure 16: Rest of North Sea North Sea Decommissioning Oil Rigs Industry Revenue (undefined), by Geography 2025 & 2033
- Figure 17: Rest of North Sea North Sea Decommissioning Oil Rigs Industry Revenue Share (%), by Geography 2025 & 2033
- Figure 18: Rest of North Sea North Sea Decommissioning Oil Rigs Industry Revenue (undefined), by Country 2025 & 2033
- Figure 19: Rest of North Sea North Sea Decommissioning Oil Rigs Industry Revenue Share (%), by Country 2025 & 2033
List of Tables
- Table 1: Global North Sea Decommissioning Oil Rigs Industry Revenue undefined Forecast, by Water Depth 2020 & 2033
- Table 2: Global North Sea Decommissioning Oil Rigs Industry Revenue undefined Forecast, by Geography 2020 & 2033
- Table 3: Global North Sea Decommissioning Oil Rigs Industry Revenue undefined Forecast, by Region 2020 & 2033
- Table 4: Global North Sea Decommissioning Oil Rigs Industry Revenue undefined Forecast, by Water Depth 2020 & 2033
- Table 5: Global North Sea Decommissioning Oil Rigs Industry Revenue undefined Forecast, by Geography 2020 & 2033
- Table 6: Global North Sea Decommissioning Oil Rigs Industry Revenue undefined Forecast, by Country 2020 & 2033
- Table 7: Global North Sea Decommissioning Oil Rigs Industry Revenue undefined Forecast, by Water Depth 2020 & 2033
- Table 8: Global North Sea Decommissioning Oil Rigs Industry Revenue undefined Forecast, by Geography 2020 & 2033
- Table 9: Global North Sea Decommissioning Oil Rigs Industry Revenue undefined Forecast, by Country 2020 & 2033
- Table 10: Global North Sea Decommissioning Oil Rigs Industry Revenue undefined Forecast, by Water Depth 2020 & 2033
- Table 11: Global North Sea Decommissioning Oil Rigs Industry Revenue undefined Forecast, by Geography 2020 & 2033
- Table 12: Global North Sea Decommissioning Oil Rigs Industry Revenue undefined Forecast, by Country 2020 & 2033
Frequently Asked Questions
1. What is the projected Compound Annual Growth Rate (CAGR) of the North Sea Decommissioning Oil Rigs Industry?
The projected CAGR is approximately 8.2%.
2. Which companies are prominent players in the North Sea Decommissioning Oil Rigs Industry?
Key companies in the market include Aker Solutions ASA, DNV GL, Heerema Marine Contractors (HMC), DeepOcean Group Holding BV, Equinor ASA*List Not Exhaustive, Able UK, John Wood Group PLC, TechnipFMC PLC, AF Gruppen SA, Allseas Group.
3. What are the main segments of the North Sea Decommissioning Oil Rigs Industry?
The market segments include Water Depth, Geography.
4. Can you provide details about the market size?
The market size is estimated to be USD XXX N/A as of 2022.
5. What are some drivers contributing to market growth?
4.; Increasing Demand for Secure. Sustainable. and Clean Energy.
6. What are the notable trends driving market growth?
Shallow Water to Dominate the Market.
7. Are there any restraints impacting market growth?
4.; High Cost of Production of Biofuels.
8. Can you provide examples of recent developments in the market?
N/A
9. What pricing options are available for accessing the report?
Pricing options include single-user, multi-user, and enterprise licenses priced at USD 4750, USD 5250, and USD 8750 respectively.
10. Is the market size provided in terms of value or volume?
The market size is provided in terms of value, measured in N/A.
11. Are there any specific market keywords associated with the report?
Yes, the market keyword associated with the report is "North Sea Decommissioning Oil Rigs Industry," which aids in identifying and referencing the specific market segment covered.
12. How do I determine which pricing option suits my needs best?
The pricing options vary based on user requirements and access needs. Individual users may opt for single-user licenses, while businesses requiring broader access may choose multi-user or enterprise licenses for cost-effective access to the report.
13. Are there any additional resources or data provided in the North Sea Decommissioning Oil Rigs Industry report?
While the report offers comprehensive insights, it's advisable to review the specific contents or supplementary materials provided to ascertain if additional resources or data are available.
14. How can I stay updated on further developments or reports in the North Sea Decommissioning Oil Rigs Industry?
To stay informed about further developments, trends, and reports in the North Sea Decommissioning Oil Rigs Industry, consider subscribing to industry newsletters, following relevant companies and organizations, or regularly checking reputable industry news sources and publications.
Methodology
Step 1 - Identification of Relevant Samples Size from Population Database


Step 2 - Approaches for Defining Global Market Size (Value, Volume* & Price*)

Note*: In applicable scenarios
Step 3 - Data Sources
Primary Research
- Web Analytics
- Survey Reports
- Research Institute
- Latest Research Reports
- Opinion Leaders
Secondary Research
- Annual Reports
- White Paper
- Latest Press Release
- Industry Association
- Paid Database
- Investor Presentations

Step 4 - Data Triangulation
Involves using different sources of information in order to increase the validity of a study
These sources are likely to be stakeholders in a program - participants, other researchers, program staff, other community members, and so on.
Then we put all data in single framework & apply various statistical tools to find out the dynamic on the market.
During the analysis stage, feedback from the stakeholder groups would be compared to determine areas of agreement as well as areas of divergence