

Key Insights
The North Sea oil and gas upstream sector demonstrates resilience amidst evolving market dynamics, projecting moderate growth. This industry, encompassing exploration, development, and production, is supported by robust infrastructure and experienced operators. Key challenges include reserve depletion, rising operational expenditures, and the global transition to renewable energy. Based on a projected Compound Annual Growth Rate (CAGR) of 1.35%, the North Sea upstream market is estimated to reach $323.83 billion by 2025. Regional variations in exploration activity are influenced by technological advancements, particularly in deepwater drilling and enhanced oil recovery. The regulatory landscape is pivotal, balancing energy security with environmental stewardship. Future expansion hinges on successful exploration, efficient production strategies, and adaptation to market shifts, with carbon capture and storage technologies potentially enhancing long-term viability.
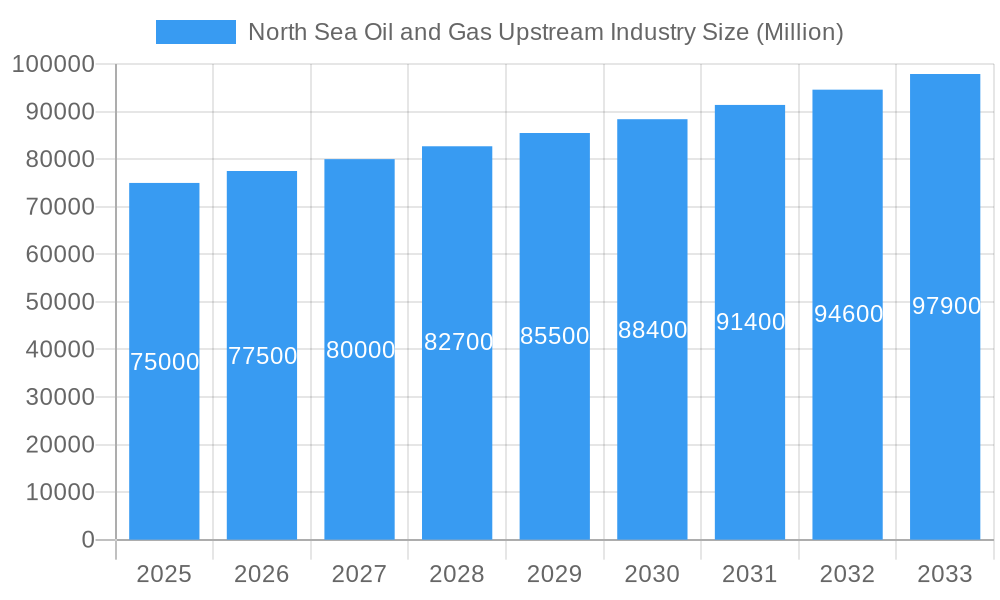
North Sea Oil and Gas Upstream Industry Market Size (In Billion)
The North Sea upstream sector is segmented into exploration, development, and production. Exploration involves significant risk and investment, driven by technological innovation and regulatory frameworks. Development is capital-intensive, requiring robust financial backing and complex project management. Production focuses on maximizing output while adhering to stringent environmental and safety standards. The offshore segment remains dominant, though it faces challenges with aging infrastructure and the adoption of new technologies for efficient production in demanding conditions. Onshore operations, while smaller, are vital for processing and distribution. This complex market requires strategic agility from all participants, emphasizing continuous innovation and adaptability.
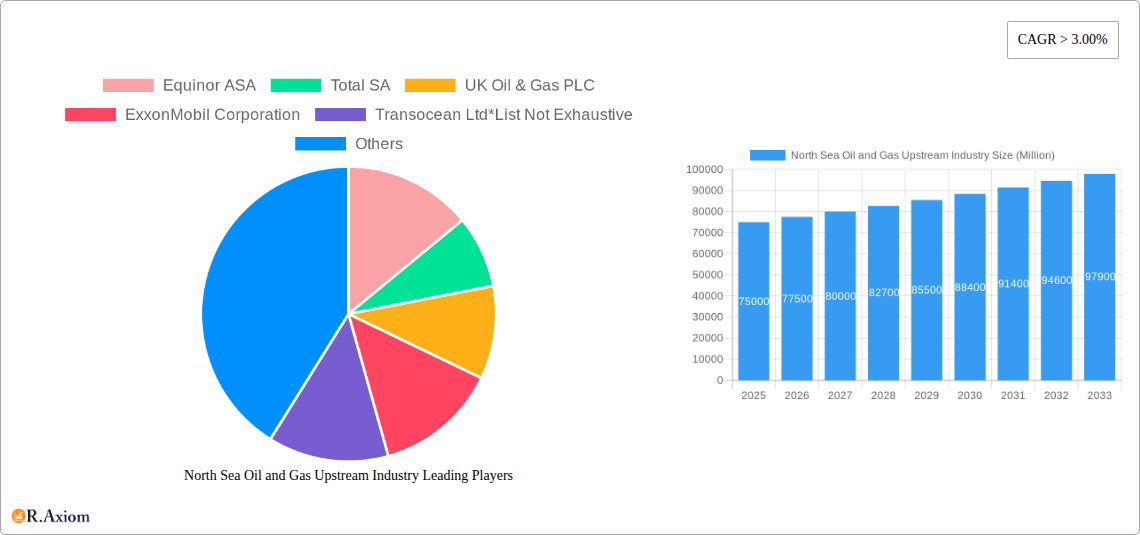
North Sea Oil and Gas Upstream Industry Company Market Share
North Sea Oil and Gas Upstream Industry Market Report: 2019-2033
This comprehensive report provides a detailed analysis of the North Sea oil and gas upstream industry, covering market trends, competitive landscape, and future growth prospects from 2019 to 2033. The study period encompasses the historical period (2019-2024), the base year (2025), and the forecast period (2025-2033). Key players like Equinor ASA, TotalEnergies SE, UK Oil & Gas PLC, ExxonMobil Corporation, Transocean Ltd, Royal Dutch Shell PLC, Eni SpA, BP PLC, and Schlumberger Limited are analyzed, offering crucial insights for stakeholders. The report segments the market by operation (exploration, development, production) and location (onshore, offshore). Expected market size in 2025 is estimated at xx Million.
Keywords: North Sea Oil and Gas, Upstream Industry, Oil Exploration, Gas Production, Offshore Drilling, Energy Security, Market Analysis, Equinor, TotalEnergies, Shell, BP, ExxonMobil, Schlumberger, UK Oil and Gas, Market Size, CAGR, M&A, Industry Trends, Regulatory Framework, Technological Disruptions
North Sea Oil and Gas Upstream Industry Market Concentration & Innovation
This section analyzes market concentration, innovation, regulatory frameworks, and M&A activity within the North Sea oil and gas upstream sector. The high capital expenditure nature of the industry leads to a relatively concentrated market, with a few major international oil companies (IOCs) holding significant market share. Equinor ASA, TotalEnergies SE, and Shell PLC are consistently among the leading players, commanding a combined market share estimated at xx% in 2025. Innovation is driven by the need to improve efficiency, reduce environmental impact, and access increasingly challenging reserves. This is reflected in increased investments in technologies like advanced drilling techniques, subsea production systems, and digitalization.
- Market Share (2025, Estimated):
- Equinor ASA: xx%
- TotalEnergies SE: xx%
- Shell PLC: xx%
- Others: xx%
- M&A Activity: The historical period (2019-2024) witnessed a moderate level of M&A activity, primarily focused on smaller companies being acquired by larger players to consolidate assets and expertise. Total deal value during this period is estimated at xx Million. The forecast period (2025-2033) is expected to see continued consolidation, driven by the need for economies of scale and access to technology. The regulatory framework plays a key role, influencing both exploration and production activities, and impacting M&A decisions. Increased scrutiny on environmental impact is leading to innovation in greener extraction methods and stricter regulatory compliance. Product substitutes, particularly renewable energy sources, pose a long-term challenge, altering the competitive landscape and influencing investment decisions. End-user trends, mainly shifting towards cleaner energy, also influence the industry's long-term growth prospects.
North Sea Oil and Gas Upstream Industry Industry Trends & Insights
The North Sea oil and gas upstream industry is characterized by fluctuating market dynamics influenced by global energy demand, geopolitical factors, and technological advancements. The historical period (2019-2024) was marked by periods of both high and low oil prices, impacting investment decisions and profitability. The industry experienced a period of relatively lower investment during the early part of the period, followed by a rebound in later years driven by rising prices and energy security concerns. The Compound Annual Growth Rate (CAGR) for the historical period is estimated at xx%. The forecast period (2025-2033) is anticipated to see continued growth, although at a potentially moderated rate, driven by factors such as increasing energy demand and government support for domestic energy production, as evidenced by the UK government’s renewed focus on exploration licensing. Technological disruptions, particularly in the area of digitalization and automation, are transforming operations, enhancing efficiency and safety. These innovations also contribute to reduced costs and enhanced environmental performance. Consumer preferences for cleaner energy, alongside government initiatives aimed at reducing carbon emissions, will present substantial challenges to the sector, but also drive the need for innovation in carbon capture, utilization, and storage technologies. The competitive landscape remains dynamic, with existing players constantly seeking to enhance their efficiency and competitiveness through strategic alliances and technology adoption. Market penetration of new technologies will be closely linked to their cost-effectiveness, regulatory support and acceptance by stakeholders. The expected market penetration of digital technologies within the sector by 2033 is estimated at xx%.
Dominant Markets & Segments in North Sea Oil and Gas Upstream Industry
The North Sea remains a significant region for oil and gas production, with the UK and Norway being the dominant players. The offshore segment represents the largest share of the market due to the prevalence of offshore oil and gas fields.
- By Operation:
- Production: Production remains the dominant segment, accounting for the largest share of revenue. The focus is shifting towards maximizing recovery from existing fields and extending their operational life.
- Development: This segment experiences fluctuations based on exploration success and investment decisions. New field development is linked to regulatory approvals and economic viability.
- Exploration: Exploration activity is influenced by government policies, particularly licensing rounds, and by technological advancements that enable access to previously unreachable resources.
- By Location:
- Offshore: The offshore segment is the dominant market driver due to the vast majority of North Sea oil and gas reserves being located offshore. Significant infrastructure investments have created a conducive environment for offshore operations. Technological advancements in offshore drilling and subsea technologies continue to enhance production efficiency in this sector.
- Onshore: The onshore segment is comparatively smaller, with a limited number of onshore fields. However, the development of onshore facilities and infrastructure plays a critical role in supporting offshore operations.
Key Drivers for Dominance:
- Favorable Regulatory Environments: Government policies and regulatory frameworks concerning licensing, taxation, and environmental regulations significantly impact activity levels.
- Infrastructure Investments: Existing infrastructure, particularly in the UK and Norway, allows efficient production and transportation of hydrocarbons. Further investment will continue to improve efficiency.
- Technological Advancements: Innovations in exploration, drilling, and production technologies enable companies to access more reserves and enhance operational efficiency. The development and implementation of Carbon Capture, Utilization, and Storage (CCUS) solutions will play a pivotal role in the future of the sector.
North Sea Oil and Gas Upstream Industry Product Developments
Product innovations primarily focus on enhancing efficiency, safety, and environmental performance. This includes advanced drilling technologies that improve precision and reduce environmental impact, coupled with sophisticated subsea production systems for remote and deepwater operations. Furthermore, the industry is investing heavily in digitalization, applying data analytics and automation to optimize production and reduce operational costs. These innovations aim to increase recovery rates and reduce the environmental footprint of oil and gas extraction. The market fit for these products is largely determined by their ability to deliver improved operational efficiency and reduced environmental impact, which aligns with increasingly stringent regulations and growing industry focus on sustainability.
Report Scope & Segmentation Analysis
This report analyzes the North Sea oil and gas upstream market across multiple segments:
By Operation: Exploration, development, and production represent distinct phases with different growth rates and market dynamics. The production segment is the largest, with steady but potentially slowing growth, while exploration is more cyclical and dependent on investment decisions and licensing rounds. Development activity mirrors exploration trends, with a lag time between discovery and production. Competitive dynamics vary across segments, with different skillsets and technologies required.
By Location: The offshore segment dominates, due to the location of most of the North Sea reserves. Onshore activity is significantly smaller, yet vital for supporting offshore operations via processing and transportation infrastructure. Both segments feature varying regulatory landscapes and infrastructure challenges, impacting competitiveness.
Key Drivers of North Sea Oil and Gas Upstream Industry Growth
Several factors drive the growth of the North Sea oil and gas upstream industry. Firstly, ongoing and increasing energy demand globally necessitates the continued extraction of oil and gas in the short-to-medium term. Secondly, government policies, especially the UK's renewed focus on licensing, aim to enhance energy security and boost domestic energy production. Thirdly, technological advancements, such as enhanced oil recovery (EOR) techniques and digitalization, continually improve efficiency and access to previously unreachable reserves. Finally, geopolitical events can significantly influence supply and demand. These four factors are interconnected, and a fluctuation in any one of these can have a ripple effect on the growth rate.
Challenges in the North Sea Oil and Gas Upstream Industry Sector
The North Sea oil and gas upstream industry faces significant challenges. Declining reserves, along with increasing operational costs, present hurdles to maintaining production levels. Stringent environmental regulations and growing pressure to reduce emissions impact investment decisions and operational practices. Furthermore, the industry faces competition from renewable energy sources and increasing focus on energy transition. These factors cumulatively constrain the growth potential of the sector in the long term. Supply chain vulnerabilities may also cause production delays and increased costs.
Emerging Opportunities in North Sea Oil and Gas Upstream Industry
Emerging opportunities exist for companies adopting innovative technologies like Carbon Capture and Storage (CCS) and enhanced oil recovery techniques. Further development and expansion of offshore wind energy infrastructure, including potential integration with oil and gas platforms, present further possibilities. The strategic focus on energy security in response to geopolitical events offers potential for increased investments in exploration and production activities. Finally, the development of the hydrogen economy presents a potential avenue for diversification and growth for players in the oil and gas sector.
Leading Players in the North Sea Oil and Gas Upstream Industry Market
Key Developments in North Sea Oil and Gas Upstream Industry Industry
- February 2022: Six new oil and gas fields in the North Sea received UK government approval, accelerating energy production.
- October 2022: The British government restarted the North Sea oil and gas exploration licensing process, boosting domestic energy security and job creation while aiming for environmentally responsible practices.
Strategic Outlook for North Sea Oil and Gas Upstream Industry Market
The North Sea oil and gas upstream industry faces a complex future. While continued energy demand and government support offer short-to-medium-term growth potential, the long-term outlook necessitates adaptation and innovation. Investment in CCS and other emission-reducing technologies is crucial for long-term viability. Strategic alliances, technological advancements and adaptation to a changing energy landscape will define the success of operators in the years ahead. The industry's future hinges on balancing energy security needs with the transition towards a lower-carbon energy system.
North Sea Oil and Gas Upstream Industry Segmentation
- 1. Production Analysis
- 2. Consumption Analysis
- 3. Import Market Analysis (Value & Volume)
- 4. Export Market Analysis (Value & Volume)
- 5. Price Trend Analysis
North Sea Oil and Gas Upstream Industry Segmentation By Geography
- 1. United Kingdom
- 2. Norway
- 3. Other Countries
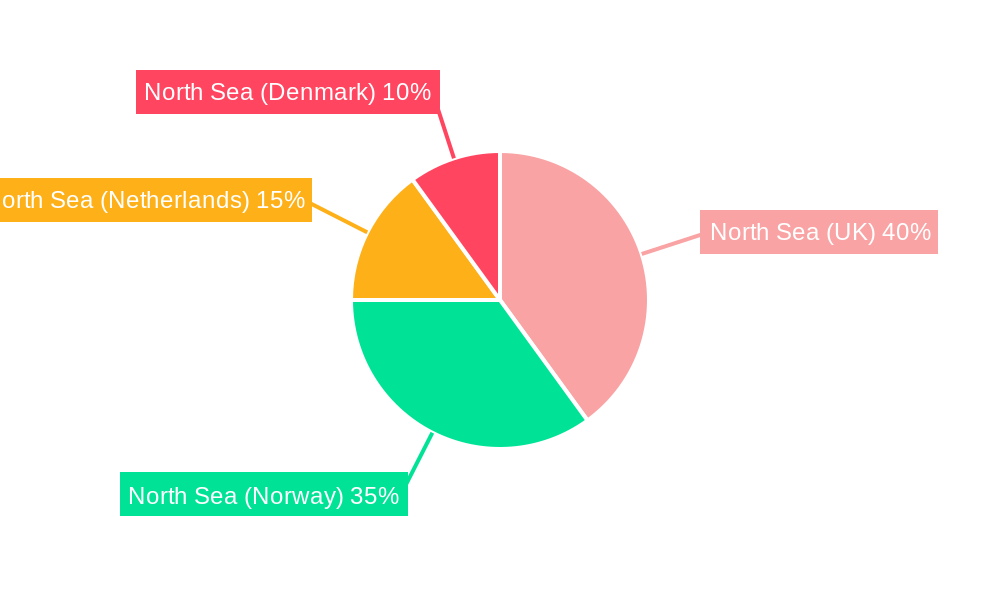
North Sea Oil and Gas Upstream Industry Regional Market Share
Geographic Coverage of North Sea Oil and Gas Upstream Industry
North Sea Oil and Gas Upstream Industry REPORT HIGHLIGHTS
| Aspects | Details |
|---|---|
| Study Period | 2020-2034 |
| Base Year | 2025 |
| Estimated Year | 2026 |
| Forecast Period | 2026-2034 |
| Historical Period | 2020-2025 |
| Growth Rate | CAGR of 1.35% from 2020-2034 |
| Segmentation |
|
Table of Contents
- 1. Introduction
- 1.1. Research Scope
- 1.2. Market Segmentation
- 1.3. Research Objective
- 1.4. Definitions and Assumptions
- 2. Executive Summary
- 2.1. Market Snapshot
- 3. Market Dynamics
- 3.1. Market Drivers
- 3.2. Market Restrains
- 3.3. Market Trends
- 3.4. Market Opportunities
- 4. Market Factor Analysis
- 4.1. Porters Five Forces
- 4.1.1. Bargaining Power of Suppliers
- 4.1.2. Bargaining Power of Buyers
- 4.1.3. Threat of New Entrants
- 4.1.4. Threat of Substitutes
- 4.1.5. Competitive Rivalry
- 4.2. PESTEL analysis
- 4.3. BCG Analysis
- 4.3.1. Stars (High Growth, High Market Share)
- 4.3.2. Cash Cows (Low Growth, High Market Share)
- 4.3.3. Question Mark (High Growth, Low Market Share)
- 4.3.4. Dogs (Low Growth, Low Market Share)
- 4.4. Ansoff Matrix Analysis
- 4.5. Supply Chain Analysis
- 4.6. Regulatory Landscape
- 4.7. Current Market Potential and Opportunity Assessment (TAM–SAM–SOM Framework)
- 4.8. RAX Analyst Note
- 4.1. Porters Five Forces
- 5. Market Analysis, Insights and Forecast 2021-2033
- 5.1. Market Analysis, Insights and Forecast - by Production Analysis
- 5.2. Market Analysis, Insights and Forecast - by Consumption Analysis
- 5.3. Market Analysis, Insights and Forecast - by Import Market Analysis (Value & Volume)
- 5.4. Market Analysis, Insights and Forecast - by Export Market Analysis (Value & Volume)
- 5.5. Market Analysis, Insights and Forecast - by Price Trend Analysis
- 5.6. Market Analysis, Insights and Forecast - by Region
- 5.6.1. United Kingdom
- 5.6.2. Norway
- 5.6.3. Other Countries
- 6. Global North Sea Oil and Gas Upstream Industry Analysis, Insights and Forecast, 2021-2033
- 6.1. Market Analysis, Insights and Forecast - by Production Analysis
- 6.2. Market Analysis, Insights and Forecast - by Consumption Analysis
- 6.3. Market Analysis, Insights and Forecast - by Import Market Analysis (Value & Volume)
- 6.4. Market Analysis, Insights and Forecast - by Export Market Analysis (Value & Volume)
- 6.5. Market Analysis, Insights and Forecast - by Price Trend Analysis
- 7. United Kingdom North Sea Oil and Gas Upstream Industry Analysis, Insights and Forecast, 2020-2032
- 7.1. Market Analysis, Insights and Forecast - by Production Analysis
- 7.2. Market Analysis, Insights and Forecast - by Consumption Analysis
- 7.3. Market Analysis, Insights and Forecast - by Import Market Analysis (Value & Volume)
- 7.4. Market Analysis, Insights and Forecast - by Export Market Analysis (Value & Volume)
- 7.5. Market Analysis, Insights and Forecast - by Price Trend Analysis
- 8. Norway North Sea Oil and Gas Upstream Industry Analysis, Insights and Forecast, 2020-2032
- 8.1. Market Analysis, Insights and Forecast - by Production Analysis
- 8.2. Market Analysis, Insights and Forecast - by Consumption Analysis
- 8.3. Market Analysis, Insights and Forecast - by Import Market Analysis (Value & Volume)
- 8.4. Market Analysis, Insights and Forecast - by Export Market Analysis (Value & Volume)
- 8.5. Market Analysis, Insights and Forecast - by Price Trend Analysis
- 9. Other Countries North Sea Oil and Gas Upstream Industry Analysis, Insights and Forecast, 2020-2032
- 9.1. Market Analysis, Insights and Forecast - by Production Analysis
- 9.2. Market Analysis, Insights and Forecast - by Consumption Analysis
- 9.3. Market Analysis, Insights and Forecast - by Import Market Analysis (Value & Volume)
- 9.4. Market Analysis, Insights and Forecast - by Export Market Analysis (Value & Volume)
- 9.5. Market Analysis, Insights and Forecast - by Price Trend Analysis
- 10. Competitive Analysis
- 10.1. Company Profiles
- 10.1.1 Equinor ASA
- 10.1.1.1. Company Overview
- 10.1.1.2. Products
- 10.1.1.3. Company Financials
- 10.1.1.4. SWOT Analysis
- 10.1.2 Total SA
- 10.1.2.1. Company Overview
- 10.1.2.2. Products
- 10.1.2.3. Company Financials
- 10.1.2.4. SWOT Analysis
- 10.1.3 UK Oil & Gas PLC
- 10.1.3.1. Company Overview
- 10.1.3.2. Products
- 10.1.3.3. Company Financials
- 10.1.3.4. SWOT Analysis
- 10.1.4 ExxonMobil Corporation
- 10.1.4.1. Company Overview
- 10.1.4.2. Products
- 10.1.4.3. Company Financials
- 10.1.4.4. SWOT Analysis
- 10.1.5 Transocean Ltd*List Not Exhaustive
- 10.1.5.1. Company Overview
- 10.1.5.2. Products
- 10.1.5.3. Company Financials
- 10.1.5.4. SWOT Analysis
- 10.1.6 Royal Dutch Shell PLC
- 10.1.6.1. Company Overview
- 10.1.6.2. Products
- 10.1.6.3. Company Financials
- 10.1.6.4. SWOT Analysis
- 10.1.7 Eni SpA
- 10.1.7.1. Company Overview
- 10.1.7.2. Products
- 10.1.7.3. Company Financials
- 10.1.7.4. SWOT Analysis
- 10.1.8 BP PLC
- 10.1.8.1. Company Overview
- 10.1.8.2. Products
- 10.1.8.3. Company Financials
- 10.1.8.4. SWOT Analysis
- 10.1.9 Schlumberger Limited
- 10.1.9.1. Company Overview
- 10.1.9.2. Products
- 10.1.9.3. Company Financials
- 10.1.9.4. SWOT Analysis
- 10.1.1 Equinor ASA
- 10.2. Market Entropy
- 10.2.1 Company's Key Areas Served
- 10.2.2 Recent Developments
- 10.3. Company Market Share Analysis 2025
- 10.3.1 Top 5 Companies Market Share Analysis
- 10.3.2 Top 3 Companies Market Share Analysis
- 10.4. List of Potential Customers
- 11. Research Methodology
List of Figures
- Figure 1: Global North Sea Oil and Gas Upstream Industry Revenue Breakdown (billion, %) by Region 2025 & 2033
- Figure 2: United Kingdom North Sea Oil and Gas Upstream Industry Revenue (billion), by Production Analysis 2025 & 2033
- Figure 3: United Kingdom North Sea Oil and Gas Upstream Industry Revenue Share (%), by Production Analysis 2025 & 2033
- Figure 4: United Kingdom North Sea Oil and Gas Upstream Industry Revenue (billion), by Consumption Analysis 2025 & 2033
- Figure 5: United Kingdom North Sea Oil and Gas Upstream Industry Revenue Share (%), by Consumption Analysis 2025 & 2033
- Figure 6: United Kingdom North Sea Oil and Gas Upstream Industry Revenue (billion), by Import Market Analysis (Value & Volume) 2025 & 2033
- Figure 7: United Kingdom North Sea Oil and Gas Upstream Industry Revenue Share (%), by Import Market Analysis (Value & Volume) 2025 & 2033
- Figure 8: United Kingdom North Sea Oil and Gas Upstream Industry Revenue (billion), by Export Market Analysis (Value & Volume) 2025 & 2033
- Figure 9: United Kingdom North Sea Oil and Gas Upstream Industry Revenue Share (%), by Export Market Analysis (Value & Volume) 2025 & 2033
- Figure 10: United Kingdom North Sea Oil and Gas Upstream Industry Revenue (billion), by Price Trend Analysis 2025 & 2033
- Figure 11: United Kingdom North Sea Oil and Gas Upstream Industry Revenue Share (%), by Price Trend Analysis 2025 & 2033
- Figure 12: United Kingdom North Sea Oil and Gas Upstream Industry Revenue (billion), by Country 2025 & 2033
- Figure 13: United Kingdom North Sea Oil and Gas Upstream Industry Revenue Share (%), by Country 2025 & 2033
- Figure 14: Norway North Sea Oil and Gas Upstream Industry Revenue (billion), by Production Analysis 2025 & 2033
- Figure 15: Norway North Sea Oil and Gas Upstream Industry Revenue Share (%), by Production Analysis 2025 & 2033
- Figure 16: Norway North Sea Oil and Gas Upstream Industry Revenue (billion), by Consumption Analysis 2025 & 2033
- Figure 17: Norway North Sea Oil and Gas Upstream Industry Revenue Share (%), by Consumption Analysis 2025 & 2033
- Figure 18: Norway North Sea Oil and Gas Upstream Industry Revenue (billion), by Import Market Analysis (Value & Volume) 2025 & 2033
- Figure 19: Norway North Sea Oil and Gas Upstream Industry Revenue Share (%), by Import Market Analysis (Value & Volume) 2025 & 2033
- Figure 20: Norway North Sea Oil and Gas Upstream Industry Revenue (billion), by Export Market Analysis (Value & Volume) 2025 & 2033
- Figure 21: Norway North Sea Oil and Gas Upstream Industry Revenue Share (%), by Export Market Analysis (Value & Volume) 2025 & 2033
- Figure 22: Norway North Sea Oil and Gas Upstream Industry Revenue (billion), by Price Trend Analysis 2025 & 2033
- Figure 23: Norway North Sea Oil and Gas Upstream Industry Revenue Share (%), by Price Trend Analysis 2025 & 2033
- Figure 24: Norway North Sea Oil and Gas Upstream Industry Revenue (billion), by Country 2025 & 2033
- Figure 25: Norway North Sea Oil and Gas Upstream Industry Revenue Share (%), by Country 2025 & 2033
- Figure 26: Other Countries North Sea Oil and Gas Upstream Industry Revenue (billion), by Production Analysis 2025 & 2033
- Figure 27: Other Countries North Sea Oil and Gas Upstream Industry Revenue Share (%), by Production Analysis 2025 & 2033
- Figure 28: Other Countries North Sea Oil and Gas Upstream Industry Revenue (billion), by Consumption Analysis 2025 & 2033
- Figure 29: Other Countries North Sea Oil and Gas Upstream Industry Revenue Share (%), by Consumption Analysis 2025 & 2033
- Figure 30: Other Countries North Sea Oil and Gas Upstream Industry Revenue (billion), by Import Market Analysis (Value & Volume) 2025 & 2033
- Figure 31: Other Countries North Sea Oil and Gas Upstream Industry Revenue Share (%), by Import Market Analysis (Value & Volume) 2025 & 2033
- Figure 32: Other Countries North Sea Oil and Gas Upstream Industry Revenue (billion), by Export Market Analysis (Value & Volume) 2025 & 2033
- Figure 33: Other Countries North Sea Oil and Gas Upstream Industry Revenue Share (%), by Export Market Analysis (Value & Volume) 2025 & 2033
- Figure 34: Other Countries North Sea Oil and Gas Upstream Industry Revenue (billion), by Price Trend Analysis 2025 & 2033
- Figure 35: Other Countries North Sea Oil and Gas Upstream Industry Revenue Share (%), by Price Trend Analysis 2025 & 2033
- Figure 36: Other Countries North Sea Oil and Gas Upstream Industry Revenue (billion), by Country 2025 & 2033
- Figure 37: Other Countries North Sea Oil and Gas Upstream Industry Revenue Share (%), by Country 2025 & 2033
List of Tables
- Table 1: Global North Sea Oil and Gas Upstream Industry Revenue billion Forecast, by Production Analysis 2020 & 2033
- Table 2: Global North Sea Oil and Gas Upstream Industry Revenue billion Forecast, by Consumption Analysis 2020 & 2033
- Table 3: Global North Sea Oil and Gas Upstream Industry Revenue billion Forecast, by Import Market Analysis (Value & Volume) 2020 & 2033
- Table 4: Global North Sea Oil and Gas Upstream Industry Revenue billion Forecast, by Export Market Analysis (Value & Volume) 2020 & 2033
- Table 5: Global North Sea Oil and Gas Upstream Industry Revenue billion Forecast, by Price Trend Analysis 2020 & 2033
- Table 6: Global North Sea Oil and Gas Upstream Industry Revenue billion Forecast, by Region 2020 & 2033
- Table 7: Global North Sea Oil and Gas Upstream Industry Revenue billion Forecast, by Production Analysis 2020 & 2033
- Table 8: Global North Sea Oil and Gas Upstream Industry Revenue billion Forecast, by Consumption Analysis 2020 & 2033
- Table 9: Global North Sea Oil and Gas Upstream Industry Revenue billion Forecast, by Import Market Analysis (Value & Volume) 2020 & 2033
- Table 10: Global North Sea Oil and Gas Upstream Industry Revenue billion Forecast, by Export Market Analysis (Value & Volume) 2020 & 2033
- Table 11: Global North Sea Oil and Gas Upstream Industry Revenue billion Forecast, by Price Trend Analysis 2020 & 2033
- Table 12: Global North Sea Oil and Gas Upstream Industry Revenue billion Forecast, by Country 2020 & 2033
- Table 13: Global North Sea Oil and Gas Upstream Industry Revenue billion Forecast, by Production Analysis 2020 & 2033
- Table 14: Global North Sea Oil and Gas Upstream Industry Revenue billion Forecast, by Consumption Analysis 2020 & 2033
- Table 15: Global North Sea Oil and Gas Upstream Industry Revenue billion Forecast, by Import Market Analysis (Value & Volume) 2020 & 2033
- Table 16: Global North Sea Oil and Gas Upstream Industry Revenue billion Forecast, by Export Market Analysis (Value & Volume) 2020 & 2033
- Table 17: Global North Sea Oil and Gas Upstream Industry Revenue billion Forecast, by Price Trend Analysis 2020 & 2033
- Table 18: Global North Sea Oil and Gas Upstream Industry Revenue billion Forecast, by Country 2020 & 2033
- Table 19: Global North Sea Oil and Gas Upstream Industry Revenue billion Forecast, by Production Analysis 2020 & 2033
- Table 20: Global North Sea Oil and Gas Upstream Industry Revenue billion Forecast, by Consumption Analysis 2020 & 2033
- Table 21: Global North Sea Oil and Gas Upstream Industry Revenue billion Forecast, by Import Market Analysis (Value & Volume) 2020 & 2033
- Table 22: Global North Sea Oil and Gas Upstream Industry Revenue billion Forecast, by Export Market Analysis (Value & Volume) 2020 & 2033
- Table 23: Global North Sea Oil and Gas Upstream Industry Revenue billion Forecast, by Price Trend Analysis 2020 & 2033
- Table 24: Global North Sea Oil and Gas Upstream Industry Revenue billion Forecast, by Country 2020 & 2033
Frequently Asked Questions
1. What is the projected Compound Annual Growth Rate (CAGR) of the North Sea Oil and Gas Upstream Industry?
The projected CAGR is approximately 1.35%.
2. Which companies are prominent players in the North Sea Oil and Gas Upstream Industry?
Key companies in the market include Equinor ASA, Total SA, UK Oil & Gas PLC, ExxonMobil Corporation, Transocean Ltd*List Not Exhaustive, Royal Dutch Shell PLC, Eni SpA, BP PLC, Schlumberger Limited.
3. What are the main segments of the North Sea Oil and Gas Upstream Industry?
The market segments include Production Analysis, Consumption Analysis, Import Market Analysis (Value & Volume), Export Market Analysis (Value & Volume), Price Trend Analysis.
4. Can you provide details about the market size?
The market size is estimated to be USD 323.83 billion as of 2022.
5. What are some drivers contributing to market growth?
4.; Increasing Demand for Wood Pellets in Clean Energy Generation4.; Growing Wood Pellet Manufacturing Infrastructure.
6. What are the notable trends driving market growth?
Shallow Water Segment Expected to See Significant Market Growth.
7. Are there any restraints impacting market growth?
4.; The Adoption and Increasing Deployment of Alternative Renewable Energy.
8. Can you provide examples of recent developments in the market?
In February 2022, six new oil and gas fields in the North Sea received approval from the UK government. The finance department pushed the senior authorities to fast-track the licenses for constructing these six energy areas.
9. What pricing options are available for accessing the report?
Pricing options include single-user, multi-user, and enterprise licenses priced at USD 4750, USD 5250, and USD 8750 respectively.
10. Is the market size provided in terms of value or volume?
The market size is provided in terms of value, measured in billion.
11. Are there any specific market keywords associated with the report?
Yes, the market keyword associated with the report is "North Sea Oil and Gas Upstream Industry," which aids in identifying and referencing the specific market segment covered.
12. How do I determine which pricing option suits my needs best?
The pricing options vary based on user requirements and access needs. Individual users may opt for single-user licenses, while businesses requiring broader access may choose multi-user or enterprise licenses for cost-effective access to the report.
13. Are there any additional resources or data provided in the North Sea Oil and Gas Upstream Industry report?
While the report offers comprehensive insights, it's advisable to review the specific contents or supplementary materials provided to ascertain if additional resources or data are available.
14. How can I stay updated on further developments or reports in the North Sea Oil and Gas Upstream Industry?
To stay informed about further developments, trends, and reports in the North Sea Oil and Gas Upstream Industry, consider subscribing to industry newsletters, following relevant companies and organizations, or regularly checking reputable industry news sources and publications.
Methodology
Step 1 - Identification of Relevant Samples Size from Population Database


Step 2 - Approaches for Defining Global Market Size (Value, Volume* & Price*)

Note*: In applicable scenarios
Step 3 - Data Sources
Primary Research
- Web Analytics
- Survey Reports
- Research Institute
- Latest Research Reports
- Opinion Leaders
Secondary Research
- Annual Reports
- White Paper
- Latest Press Release
- Industry Association
- Paid Database
- Investor Presentations

Step 4 - Data Triangulation
Involves using different sources of information in order to increase the validity of a study
These sources are likely to be stakeholders in a program - participants, other researchers, program staff, other community members, and so on.
Then we put all data in single framework & apply various statistical tools to find out the dynamic on the market.
During the analysis stage, feedback from the stakeholder groups would be compared to determine areas of agreement as well as areas of divergence