

Key Insights
The Nuclear Power Plant Equipment market is poised for substantial expansion, with a projected market size of 47.43 billion by 2025. The sector is expected to grow at a Compound Annual Growth Rate (CAGR) of 3.5% from 2025 to 2033. This growth trajectory is underpinned by several key drivers. First, escalating global demand for reliable, low-carbon energy sources is intensifying investment in nuclear power generation. Governments worldwide are prioritizing nuclear energy to enhance energy security and meet decarbonization targets, thereby stimulating new construction and modernization projects for nuclear power plants. Second, technological advancements, including the development of safer and more efficient reactor designs like Small Modular Reactors (SMRs), are bolstering market expansion. These innovations address historical safety concerns and improve the economic feasibility of nuclear energy. Third, the growing need for grid stability and consistent baseload power generation, especially in regions with limited renewable energy options, is further augmenting market demand. However, the market faces potential restraints, such as stringent regulatory frameworks, significant initial capital expenditure for nuclear facility construction, and public perception concerning nuclear safety.
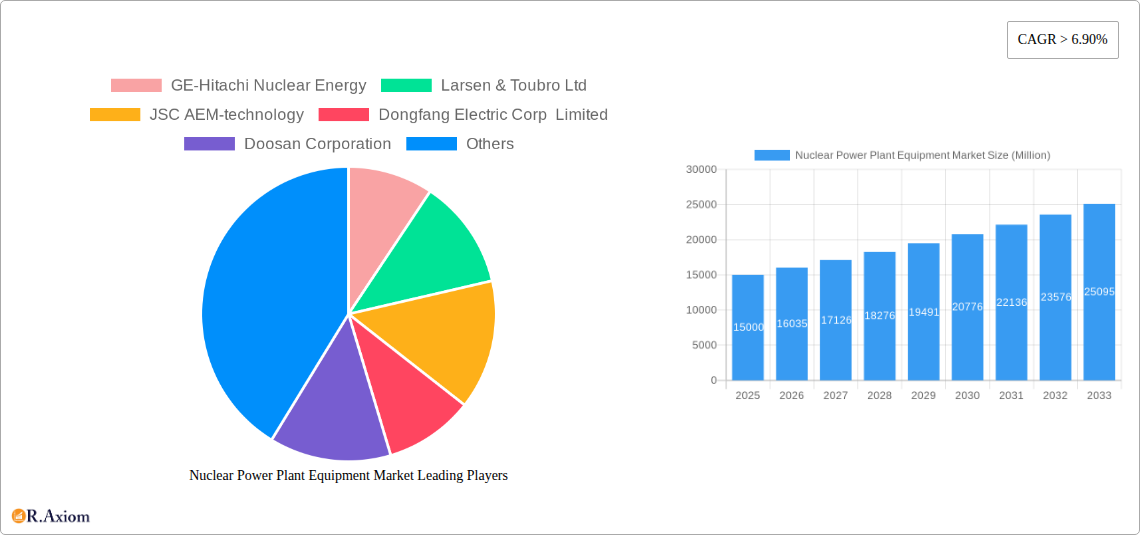
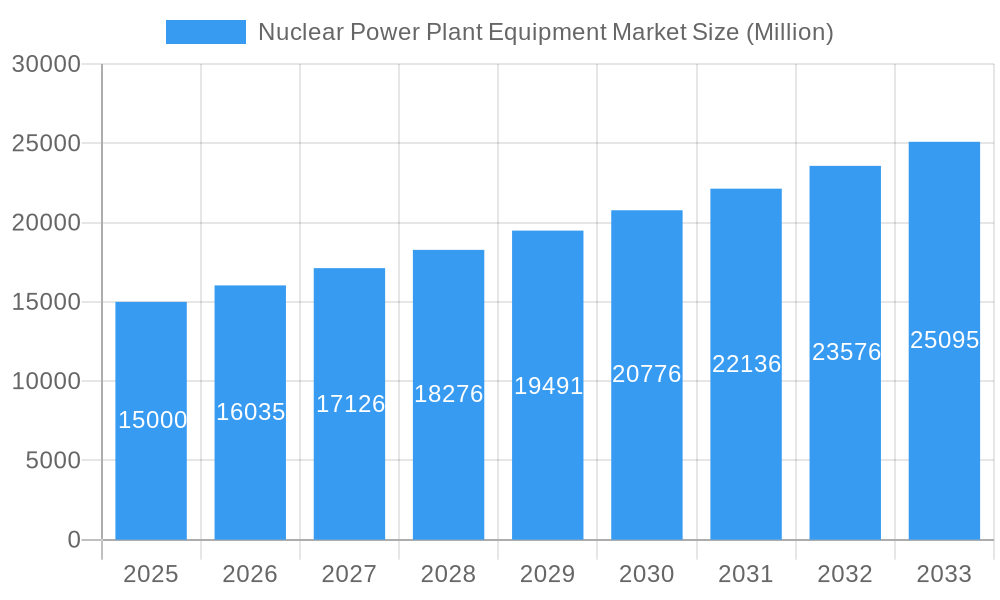
Nuclear Power Plant Equipment Market Market Size (In Billion)
Market segmentation reveals a diverse range of offerings. Pressurized Water Reactors (PWRs) and Boiling Water Reactors (BWRs) currently dominate product types due to their proven reliability and widespread adoption. Nevertheless, emerging technologies such as High-Temperature Gas-Cooled Reactors (HTGRs) and Liquid Metal Fast Breeder Reactors (LMFBRs) are anticipated to gain prominence, offering enhanced safety and improved fuel efficiency. The carrier type segment is also varied, with Island Equipment and Auxiliary Equipment constituting major market shares. Geographically, North America, Asia Pacific, and Europe are projected to be the leading regions for market growth, with China, India, and the United States driving regional demand. The competitive landscape features key players including GE-Hitachi Nuclear Energy, Larsen & Toubro, and Westinghouse, who are actively pursuing technological innovations and strategic alliances to solidify their market positions. The forecast period (2025-2033) presents significant growth opportunities for entities adept at navigating market complexities and leveraging evolving trends within the nuclear power sector.
Nuclear Power Plant Equipment Market Company Market Share
Nuclear Power Plant Equipment Market: A Comprehensive Report (2019-2033)
This detailed report provides a comprehensive analysis of the Nuclear Power Plant Equipment Market, offering invaluable insights for industry stakeholders, investors, and strategic decision-makers. Covering the period from 2019 to 2033, with a focus on 2025, this report dissects market dynamics, technological advancements, and competitive landscapes to provide a clear understanding of current trends and future growth trajectories. The market is segmented by product type (Pressurized Water Reactor, Pressurized Heavy Water Reactor, Boiling Water Reactor, High-temperature Gas Cooled Reactor, Liquid Metal Fast Breeder Reactor, Other Reactors) and carrier type (Island Equipment, Auxiliary Equipment). Key players such as GE-Hitachi Nuclear Energy, Larsen & Toubro Ltd, and Westinghouse Electric Company LLC are analyzed in detail.
Nuclear Power Plant Equipment Market Market Concentration & Innovation
The Nuclear Power Plant Equipment market exhibits a moderately concentrated structure, with a few major players holding significant market share. While precise market share figures for each company are unavailable without further research, GE-Hitachi Nuclear Energy, Westinghouse Electric Company LLC, and Mitsubishi Heavy Industries Ltd are among the leading players, commanding substantial portions of the global market. Innovation within the sector is driven by the need for increased efficiency, safety, and reduced operational costs. Stringent regulatory frameworks, particularly concerning nuclear safety and waste management, play a crucial role in shaping technological advancements and market entry barriers. Product substitutes are limited due to the specialized nature of nuclear power plant equipment; however, advancements in renewable energy technologies present indirect competition. End-user trends focus on enhanced safety features, longevity of equipment, and minimized environmental impact. The M&A landscape has seen moderate activity in recent years, with deal values fluctuating based on market conditions and strategic objectives. Examples include specific mergers which are unavailable in this current document. Overall, the market's concentration is shaped by the interplay of technological innovation, regulatory compliance, and strategic acquisitions.
Nuclear Power Plant Equipment Market Industry Trends & Insights
The Nuclear Power Plant Equipment market is projected to experience steady growth throughout the forecast period (2025-2033). While the precise CAGR is unavailable without dedicated data analysis, factors contributing to this growth include increasing global energy demand, a growing focus on carbon reduction strategies, and the ongoing development of new nuclear power plants globally. However, challenges remain including the high capital investment required for nuclear power projects, public perception concerns regarding nuclear safety, and the complexities associated with nuclear waste management. These factors can temper growth rates. Technological disruptions are mainly driven by the development of advanced reactor designs such as Small Modular Reactors (SMRs), which offer enhanced safety features, improved efficiency, and reduced capital costs. Furthermore, advancements in materials science and digital technologies contribute to improved performance and longevity of equipment. The market penetration of advanced technologies is likely to increase gradually, driven by cost reductions and improved reliability.
Dominant Markets & Segments in Nuclear Power Plant Equipment Market
Leading Region/Country: While specific regional dominance requires further data analysis, Asia-Pacific is expected to hold a significant share due to ongoing expansion of nuclear power capacity in countries like China and India. Europe also holds a substantial market share due to an established nuclear power infrastructure and ongoing refurbishment of existing plants. North America remains a significant contributor but with lower growth projections compared to Asia.
Dominant Product Type: Pressurized Water Reactors (PWRs) currently represent the largest segment within the market due to their wide-spread adoption and established technological maturity. However, the share of other reactor types, including SMRs, is likely to grow in the coming years due to technological advancements and economic factors.
Dominant Carrier Type: Island equipment typically holds a larger market share compared to auxiliary equipment because of their critical role in the core functioning of nuclear power plants.
Key Drivers:
- Economic policies: Government support and incentives for nuclear power development, including tax benefits and subsidies.
- Infrastructure: Investment in new nuclear power plants and upgrades to existing infrastructure.
- Energy security: Reliance on nuclear power for stable and secure energy supply.
Nuclear Power Plant Equipment Market Product Developments
Recent product innovations focus on improving the safety, efficiency, and longevity of nuclear power plant equipment. Advancements in materials science have led to the development of more resistant and durable components, while digital technologies enable enhanced monitoring and predictive maintenance capabilities. These advancements cater to the market's demand for increased reliability and reduced operational costs. The development of SMRs represents a significant technological shift, providing a more modular, scalable, and potentially safer approach to nuclear power generation. This trend is likely to gain significant traction in the coming years.
Report Scope & Segmentation Analysis
This report segments the Nuclear Power Plant Equipment Market based on product type, encompassing Pressurized Water Reactor (PWR), Pressurized Heavy Water Reactor (PHWR), Boiling Water Reactor (BWR), High-temperature Gas-cooled Reactor (HTGR), Liquid Metal Fast Breeder Reactor (LMFBR), and Other Reactors. Each segment's market size, growth projections, and competitive dynamics are analyzed. The market is further divided by carrier type: Island Equipment, and Auxiliary Equipment, detailing their respective market sizes, growth rates and competitive analysis. The report provides projections for each segment's growth through 2033.
Key Drivers of Nuclear Power Plant Equipment Market Growth
Several factors drive the growth of the Nuclear Power Plant Equipment Market. The increasing global demand for electricity, coupled with concerns about climate change and the need for carbon-neutral energy sources, is a major catalyst. Government policies promoting nuclear power and providing financial incentives for plant development and upgrades significantly influence market expansion. Technological advancements, especially the development of advanced reactor designs, such as SMRs, present significant growth opportunities. Furthermore, the aging infrastructure of existing nuclear power plants necessitates significant investments in equipment upgrades and replacements, fueling market growth.
Challenges in the Nuclear Power Plant Equipment Market Sector
The nuclear power equipment sector faces several challenges. Stringent safety regulations and licensing requirements pose significant hurdles for manufacturers and operators. High upfront capital costs for nuclear power projects often restrict investment and limit market expansion. The complexity of the nuclear fuel cycle and the management of radioactive waste contribute to both cost and risk. The increasing competition from renewable energy technologies and fluctuations in the global energy market also influence the sector's growth trajectory. Finally, supply chain disruptions can cause significant delays and cost increases in project timelines.
Emerging Opportunities in Nuclear Power Plant Equipment Market
The Nuclear Power Plant Equipment Market presents several promising opportunities. The growing interest in SMRs offers significant potential for technological advancements and market growth. The development of advanced materials and digital technologies enhances the efficiency, safety, and longevity of equipment, leading to new market avenues. Emerging economies with growing energy demands present significant potential for new projects and infrastructure development. Finally, initiatives promoting the use of nuclear power for desalination and other non-electric applications offer alternative opportunities to expand the market.
Leading Players in the Nuclear Power Plant Equipment Market Market
- GE-Hitachi Nuclear Energy
- Larsen & Toubro Ltd
- JSC AEM-technology
- Dongfang Electric Corp Limited
- Doosan Corporation
- Babcock & Wilcox Company
- Areva SA
- Korea Electric Power Corporation (KEPCO)
- Westinghouse Electric Company LLC
- JSC ATOMSTROYEXPORT
- Mitsubishi Heavy Industries Ltd
Key Developments in Nuclear Power Plant Equipment Market Industry
- May 2020: Russia's Atommash shipped components for the Turkish Akkuyu nuclear power plant, highlighting the ongoing expansion of nuclear power globally.
- June 29, 2020: Closure of France's Fessenheim nuclear power plant demonstrates the life cycle of nuclear facilities and the resulting demand for refurbishment or replacement equipment.
- June 30, 2020: Hungary's Paks II Ltd submitted a construction license application for new nuclear units, indicating continued investment in the sector.
Strategic Outlook for Nuclear Power Plant Equipment Market Market
The future of the Nuclear Power Plant Equipment Market is promising, driven by the growing demand for reliable and low-carbon energy sources. Technological advancements, especially in SMR technology, are poised to unlock significant growth opportunities. Government policies supportive of nuclear energy and ongoing investments in new and existing infrastructure are expected to fuel market expansion. However, addressing challenges related to safety, cost, and waste management will be crucial for sustained growth and wider market adoption. The market is expected to see substantial expansion, particularly in regions with strong government support for nuclear power and growing energy demands.
Nuclear Power Plant Equipment Market Segmentation
-
1. Product Type
- 1.1. Pressurized Water Reactor
- 1.2. Pressurized Heavy Water Reactor
- 1.3. Boiling Water Reactor
- 1.4. High-temperature Gas Cooled Reactor
- 1.5. Liquid Metal Fast Breeder Reactor
- 1.6. Other Reactors
-
2. Carrier Type
- 2.1. Island Equipment
- 2.2. Auxiliary Equipment
Nuclear Power Plant Equipment Market Segmentation By Geography
-
1. North America
- 1.1. United States
- 1.2. Canada
- 1.3. Rest of North America
-
2. Asia Pacific
- 2.1. China
- 2.2. India
- 2.3. Japan
- 2.4. South Korea
- 2.5. Rest of Asia Pacific
-
3. Europe
- 3.1. Germany
- 3.2. United Kingdom
- 3.3. Russia
- 3.4. France
- 3.5. Rest of Europe
-
4. Middle East and Africa
- 4.1. United Arab Emirates
- 4.2. Saudi Arabia
- 4.3. South Africa
- 4.4. Iran
- 4.5. Rest of Middle East and Africa
-
5. South America
- 5.1. Brazil
- 5.2. Argentina
- 5.3. Rest of South America
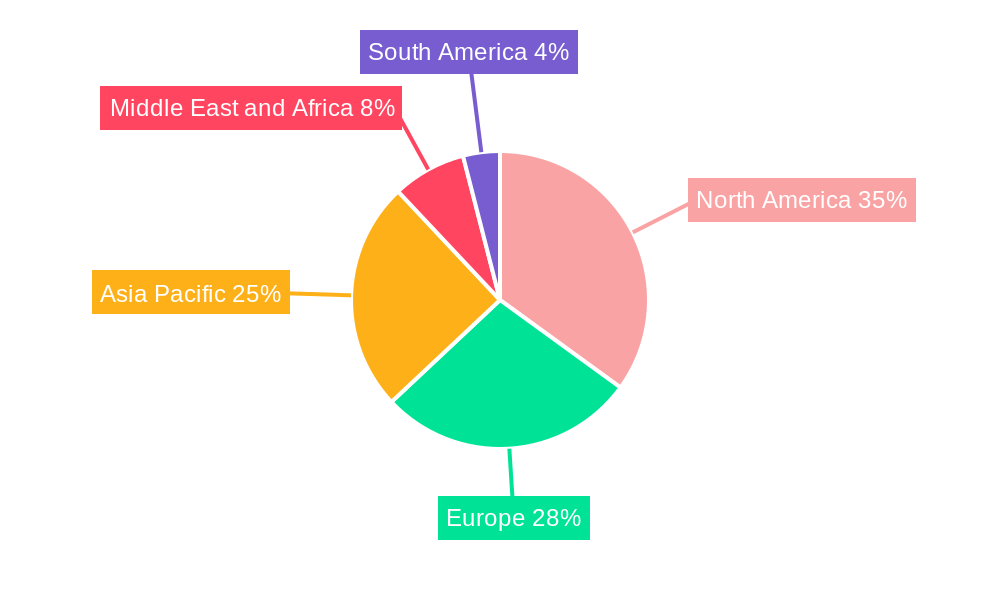
Nuclear Power Plant Equipment Market Regional Market Share
Geographic Coverage of Nuclear Power Plant Equipment Market
Nuclear Power Plant Equipment Market REPORT HIGHLIGHTS
| Aspects | Details |
|---|---|
| Study Period | 2020-2034 |
| Base Year | 2025 |
| Estimated Year | 2026 |
| Forecast Period | 2026-2034 |
| Historical Period | 2020-2025 |
| Growth Rate | CAGR of 3.5% from 2020-2034 |
| Segmentation |
|
Table of Contents
- 1. Introduction
- 1.1. Research Scope
- 1.2. Market Segmentation
- 1.3. Research Objective
- 1.4. Definitions and Assumptions
- 2. Executive Summary
- 2.1. Market Snapshot
- 3. Market Dynamics
- 3.1. Market Drivers
- 3.2. Market Restrains
- 3.3. Market Trends
- 3.4. Market Opportunities
- 4. Market Factor Analysis
- 4.1. Porters Five Forces
- 4.1.1. Bargaining Power of Suppliers
- 4.1.2. Bargaining Power of Buyers
- 4.1.3. Threat of New Entrants
- 4.1.4. Threat of Substitutes
- 4.1.5. Competitive Rivalry
- 4.2. PESTEL analysis
- 4.3. BCG Analysis
- 4.3.1. Stars (High Growth, High Market Share)
- 4.3.2. Cash Cows (Low Growth, High Market Share)
- 4.3.3. Question Mark (High Growth, Low Market Share)
- 4.3.4. Dogs (Low Growth, Low Market Share)
- 4.4. Ansoff Matrix Analysis
- 4.5. Supply Chain Analysis
- 4.6. Regulatory Landscape
- 4.7. Current Market Potential and Opportunity Assessment (TAM–SAM–SOM Framework)
- 4.8. RAX Analyst Note
- 4.1. Porters Five Forces
- 5. Market Analysis, Insights and Forecast 2021-2033
- 5.1. Market Analysis, Insights and Forecast - by Product Type
- 5.1.1. Pressurized Water Reactor
- 5.1.2. Pressurized Heavy Water Reactor
- 5.1.3. Boiling Water Reactor
- 5.1.4. High-temperature Gas Cooled Reactor
- 5.1.5. Liquid Metal Fast Breeder Reactor
- 5.1.6. Other Reactors
- 5.2. Market Analysis, Insights and Forecast - by Carrier Type
- 5.2.1. Island Equipment
- 5.2.2. Auxiliary Equipment
- 5.3. Market Analysis, Insights and Forecast - by Region
- 5.3.1. North America
- 5.3.2. Asia Pacific
- 5.3.3. Europe
- 5.3.4. Middle East and Africa
- 5.3.5. South America
- 5.1. Market Analysis, Insights and Forecast - by Product Type
- 6. Global Nuclear Power Plant Equipment Market Analysis, Insights and Forecast, 2021-2033
- 6.1. Market Analysis, Insights and Forecast - by Product Type
- 6.1.1. Pressurized Water Reactor
- 6.1.2. Pressurized Heavy Water Reactor
- 6.1.3. Boiling Water Reactor
- 6.1.4. High-temperature Gas Cooled Reactor
- 6.1.5. Liquid Metal Fast Breeder Reactor
- 6.1.6. Other Reactors
- 6.2. Market Analysis, Insights and Forecast - by Carrier Type
- 6.2.1. Island Equipment
- 6.2.2. Auxiliary Equipment
- 6.1. Market Analysis, Insights and Forecast - by Product Type
- 7. North America Nuclear Power Plant Equipment Market Analysis, Insights and Forecast, 2020-2032
- 7.1. Market Analysis, Insights and Forecast - by Product Type
- 7.1.1. Pressurized Water Reactor
- 7.1.2. Pressurized Heavy Water Reactor
- 7.1.3. Boiling Water Reactor
- 7.1.4. High-temperature Gas Cooled Reactor
- 7.1.5. Liquid Metal Fast Breeder Reactor
- 7.1.6. Other Reactors
- 7.2. Market Analysis, Insights and Forecast - by Carrier Type
- 7.2.1. Island Equipment
- 7.2.2. Auxiliary Equipment
- 7.1. Market Analysis, Insights and Forecast - by Product Type
- 8. Asia Pacific Nuclear Power Plant Equipment Market Analysis, Insights and Forecast, 2020-2032
- 8.1. Market Analysis, Insights and Forecast - by Product Type
- 8.1.1. Pressurized Water Reactor
- 8.1.2. Pressurized Heavy Water Reactor
- 8.1.3. Boiling Water Reactor
- 8.1.4. High-temperature Gas Cooled Reactor
- 8.1.5. Liquid Metal Fast Breeder Reactor
- 8.1.6. Other Reactors
- 8.2. Market Analysis, Insights and Forecast - by Carrier Type
- 8.2.1. Island Equipment
- 8.2.2. Auxiliary Equipment
- 8.1. Market Analysis, Insights and Forecast - by Product Type
- 9. Europe Nuclear Power Plant Equipment Market Analysis, Insights and Forecast, 2020-2032
- 9.1. Market Analysis, Insights and Forecast - by Product Type
- 9.1.1. Pressurized Water Reactor
- 9.1.2. Pressurized Heavy Water Reactor
- 9.1.3. Boiling Water Reactor
- 9.1.4. High-temperature Gas Cooled Reactor
- 9.1.5. Liquid Metal Fast Breeder Reactor
- 9.1.6. Other Reactors
- 9.2. Market Analysis, Insights and Forecast - by Carrier Type
- 9.2.1. Island Equipment
- 9.2.2. Auxiliary Equipment
- 9.1. Market Analysis, Insights and Forecast - by Product Type
- 10. Middle East and Africa Nuclear Power Plant Equipment Market Analysis, Insights and Forecast, 2020-2032
- 10.1. Market Analysis, Insights and Forecast - by Product Type
- 10.1.1. Pressurized Water Reactor
- 10.1.2. Pressurized Heavy Water Reactor
- 10.1.3. Boiling Water Reactor
- 10.1.4. High-temperature Gas Cooled Reactor
- 10.1.5. Liquid Metal Fast Breeder Reactor
- 10.1.6. Other Reactors
- 10.2. Market Analysis, Insights and Forecast - by Carrier Type
- 10.2.1. Island Equipment
- 10.2.2. Auxiliary Equipment
- 10.1. Market Analysis, Insights and Forecast - by Product Type
- 11. South America Nuclear Power Plant Equipment Market Analysis, Insights and Forecast, 2020-2032
- 11.1. Market Analysis, Insights and Forecast - by Product Type
- 11.1.1. Pressurized Water Reactor
- 11.1.2. Pressurized Heavy Water Reactor
- 11.1.3. Boiling Water Reactor
- 11.1.4. High-temperature Gas Cooled Reactor
- 11.1.5. Liquid Metal Fast Breeder Reactor
- 11.1.6. Other Reactors
- 11.2. Market Analysis, Insights and Forecast - by Carrier Type
- 11.2.1. Island Equipment
- 11.2.2. Auxiliary Equipment
- 11.1. Market Analysis, Insights and Forecast - by Product Type
- 12. Competitive Analysis
- 12.1. Company Profiles
- 12.1.1 GE-Hitachi Nuclear Energy
- 12.1.1.1. Company Overview
- 12.1.1.2. Products
- 12.1.1.3. Company Financials
- 12.1.1.4. SWOT Analysis
- 12.1.2 Larsen & Toubro Ltd
- 12.1.2.1. Company Overview
- 12.1.2.2. Products
- 12.1.2.3. Company Financials
- 12.1.2.4. SWOT Analysis
- 12.1.3 JSC AEM-technology
- 12.1.3.1. Company Overview
- 12.1.3.2. Products
- 12.1.3.3. Company Financials
- 12.1.3.4. SWOT Analysis
- 12.1.4 Dongfang Electric Corp Limited
- 12.1.4.1. Company Overview
- 12.1.4.2. Products
- 12.1.4.3. Company Financials
- 12.1.4.4. SWOT Analysis
- 12.1.5 Doosan Corporation
- 12.1.5.1. Company Overview
- 12.1.5.2. Products
- 12.1.5.3. Company Financials
- 12.1.5.4. SWOT Analysis
- 12.1.6 Babcock & Wilcox Company
- 12.1.6.1. Company Overview
- 12.1.6.2. Products
- 12.1.6.3. Company Financials
- 12.1.6.4. SWOT Analysis
- 12.1.7 Areva SA
- 12.1.7.1. Company Overview
- 12.1.7.2. Products
- 12.1.7.3. Company Financials
- 12.1.7.4. SWOT Analysis
- 12.1.8 Korea Electric Power Corporation (KEPCO)
- 12.1.8.1. Company Overview
- 12.1.8.2. Products
- 12.1.8.3. Company Financials
- 12.1.8.4. SWOT Analysis
- 12.1.9 Westinghouse Electric Company LLC
- 12.1.9.1. Company Overview
- 12.1.9.2. Products
- 12.1.9.3. Company Financials
- 12.1.9.4. SWOT Analysis
- 12.1.10 JSC ATOMSTROYEXPORT
- 12.1.10.1. Company Overview
- 12.1.10.2. Products
- 12.1.10.3. Company Financials
- 12.1.10.4. SWOT Analysis
- 12.1.11 Mitsubishi Heavy Industries Ltd
- 12.1.11.1. Company Overview
- 12.1.11.2. Products
- 12.1.11.3. Company Financials
- 12.1.11.4. SWOT Analysis
- 12.1.1 GE-Hitachi Nuclear Energy
- 12.2. Market Entropy
- 12.2.1 Company's Key Areas Served
- 12.2.2 Recent Developments
- 12.3. Company Market Share Analysis 2025
- 12.3.1 Top 5 Companies Market Share Analysis
- 12.3.2 Top 3 Companies Market Share Analysis
- 12.4. List of Potential Customers
- 13. Research Methodology
List of Figures
- Figure 1: Global Nuclear Power Plant Equipment Market Revenue Breakdown (billion, %) by Region 2025 & 2033
- Figure 2: Global Nuclear Power Plant Equipment Market Volume Breakdown (K Units, %) by Region 2025 & 2033
- Figure 3: North America Nuclear Power Plant Equipment Market Revenue (billion), by Product Type 2025 & 2033
- Figure 4: North America Nuclear Power Plant Equipment Market Volume (K Units), by Product Type 2025 & 2033
- Figure 5: North America Nuclear Power Plant Equipment Market Revenue Share (%), by Product Type 2025 & 2033
- Figure 6: North America Nuclear Power Plant Equipment Market Volume Share (%), by Product Type 2025 & 2033
- Figure 7: North America Nuclear Power Plant Equipment Market Revenue (billion), by Carrier Type 2025 & 2033
- Figure 8: North America Nuclear Power Plant Equipment Market Volume (K Units), by Carrier Type 2025 & 2033
- Figure 9: North America Nuclear Power Plant Equipment Market Revenue Share (%), by Carrier Type 2025 & 2033
- Figure 10: North America Nuclear Power Plant Equipment Market Volume Share (%), by Carrier Type 2025 & 2033
- Figure 11: North America Nuclear Power Plant Equipment Market Revenue (billion), by Country 2025 & 2033
- Figure 12: North America Nuclear Power Plant Equipment Market Volume (K Units), by Country 2025 & 2033
- Figure 13: North America Nuclear Power Plant Equipment Market Revenue Share (%), by Country 2025 & 2033
- Figure 14: North America Nuclear Power Plant Equipment Market Volume Share (%), by Country 2025 & 2033
- Figure 15: Asia Pacific Nuclear Power Plant Equipment Market Revenue (billion), by Product Type 2025 & 2033
- Figure 16: Asia Pacific Nuclear Power Plant Equipment Market Volume (K Units), by Product Type 2025 & 2033
- Figure 17: Asia Pacific Nuclear Power Plant Equipment Market Revenue Share (%), by Product Type 2025 & 2033
- Figure 18: Asia Pacific Nuclear Power Plant Equipment Market Volume Share (%), by Product Type 2025 & 2033
- Figure 19: Asia Pacific Nuclear Power Plant Equipment Market Revenue (billion), by Carrier Type 2025 & 2033
- Figure 20: Asia Pacific Nuclear Power Plant Equipment Market Volume (K Units), by Carrier Type 2025 & 2033
- Figure 21: Asia Pacific Nuclear Power Plant Equipment Market Revenue Share (%), by Carrier Type 2025 & 2033
- Figure 22: Asia Pacific Nuclear Power Plant Equipment Market Volume Share (%), by Carrier Type 2025 & 2033
- Figure 23: Asia Pacific Nuclear Power Plant Equipment Market Revenue (billion), by Country 2025 & 2033
- Figure 24: Asia Pacific Nuclear Power Plant Equipment Market Volume (K Units), by Country 2025 & 2033
- Figure 25: Asia Pacific Nuclear Power Plant Equipment Market Revenue Share (%), by Country 2025 & 2033
- Figure 26: Asia Pacific Nuclear Power Plant Equipment Market Volume Share (%), by Country 2025 & 2033
- Figure 27: Europe Nuclear Power Plant Equipment Market Revenue (billion), by Product Type 2025 & 2033
- Figure 28: Europe Nuclear Power Plant Equipment Market Volume (K Units), by Product Type 2025 & 2033
- Figure 29: Europe Nuclear Power Plant Equipment Market Revenue Share (%), by Product Type 2025 & 2033
- Figure 30: Europe Nuclear Power Plant Equipment Market Volume Share (%), by Product Type 2025 & 2033
- Figure 31: Europe Nuclear Power Plant Equipment Market Revenue (billion), by Carrier Type 2025 & 2033
- Figure 32: Europe Nuclear Power Plant Equipment Market Volume (K Units), by Carrier Type 2025 & 2033
- Figure 33: Europe Nuclear Power Plant Equipment Market Revenue Share (%), by Carrier Type 2025 & 2033
- Figure 34: Europe Nuclear Power Plant Equipment Market Volume Share (%), by Carrier Type 2025 & 2033
- Figure 35: Europe Nuclear Power Plant Equipment Market Revenue (billion), by Country 2025 & 2033
- Figure 36: Europe Nuclear Power Plant Equipment Market Volume (K Units), by Country 2025 & 2033
- Figure 37: Europe Nuclear Power Plant Equipment Market Revenue Share (%), by Country 2025 & 2033
- Figure 38: Europe Nuclear Power Plant Equipment Market Volume Share (%), by Country 2025 & 2033
- Figure 39: Middle East and Africa Nuclear Power Plant Equipment Market Revenue (billion), by Product Type 2025 & 2033
- Figure 40: Middle East and Africa Nuclear Power Plant Equipment Market Volume (K Units), by Product Type 2025 & 2033
- Figure 41: Middle East and Africa Nuclear Power Plant Equipment Market Revenue Share (%), by Product Type 2025 & 2033
- Figure 42: Middle East and Africa Nuclear Power Plant Equipment Market Volume Share (%), by Product Type 2025 & 2033
- Figure 43: Middle East and Africa Nuclear Power Plant Equipment Market Revenue (billion), by Carrier Type 2025 & 2033
- Figure 44: Middle East and Africa Nuclear Power Plant Equipment Market Volume (K Units), by Carrier Type 2025 & 2033
- Figure 45: Middle East and Africa Nuclear Power Plant Equipment Market Revenue Share (%), by Carrier Type 2025 & 2033
- Figure 46: Middle East and Africa Nuclear Power Plant Equipment Market Volume Share (%), by Carrier Type 2025 & 2033
- Figure 47: Middle East and Africa Nuclear Power Plant Equipment Market Revenue (billion), by Country 2025 & 2033
- Figure 48: Middle East and Africa Nuclear Power Plant Equipment Market Volume (K Units), by Country 2025 & 2033
- Figure 49: Middle East and Africa Nuclear Power Plant Equipment Market Revenue Share (%), by Country 2025 & 2033
- Figure 50: Middle East and Africa Nuclear Power Plant Equipment Market Volume Share (%), by Country 2025 & 2033
- Figure 51: South America Nuclear Power Plant Equipment Market Revenue (billion), by Product Type 2025 & 2033
- Figure 52: South America Nuclear Power Plant Equipment Market Volume (K Units), by Product Type 2025 & 2033
- Figure 53: South America Nuclear Power Plant Equipment Market Revenue Share (%), by Product Type 2025 & 2033
- Figure 54: South America Nuclear Power Plant Equipment Market Volume Share (%), by Product Type 2025 & 2033
- Figure 55: South America Nuclear Power Plant Equipment Market Revenue (billion), by Carrier Type 2025 & 2033
- Figure 56: South America Nuclear Power Plant Equipment Market Volume (K Units), by Carrier Type 2025 & 2033
- Figure 57: South America Nuclear Power Plant Equipment Market Revenue Share (%), by Carrier Type 2025 & 2033
- Figure 58: South America Nuclear Power Plant Equipment Market Volume Share (%), by Carrier Type 2025 & 2033
- Figure 59: South America Nuclear Power Plant Equipment Market Revenue (billion), by Country 2025 & 2033
- Figure 60: South America Nuclear Power Plant Equipment Market Volume (K Units), by Country 2025 & 2033
- Figure 61: South America Nuclear Power Plant Equipment Market Revenue Share (%), by Country 2025 & 2033
- Figure 62: South America Nuclear Power Plant Equipment Market Volume Share (%), by Country 2025 & 2033
List of Tables
- Table 1: Global Nuclear Power Plant Equipment Market Revenue billion Forecast, by Product Type 2020 & 2033
- Table 2: Global Nuclear Power Plant Equipment Market Volume K Units Forecast, by Product Type 2020 & 2033
- Table 3: Global Nuclear Power Plant Equipment Market Revenue billion Forecast, by Carrier Type 2020 & 2033
- Table 4: Global Nuclear Power Plant Equipment Market Volume K Units Forecast, by Carrier Type 2020 & 2033
- Table 5: Global Nuclear Power Plant Equipment Market Revenue billion Forecast, by Region 2020 & 2033
- Table 6: Global Nuclear Power Plant Equipment Market Volume K Units Forecast, by Region 2020 & 2033
- Table 7: Global Nuclear Power Plant Equipment Market Revenue billion Forecast, by Product Type 2020 & 2033
- Table 8: Global Nuclear Power Plant Equipment Market Volume K Units Forecast, by Product Type 2020 & 2033
- Table 9: Global Nuclear Power Plant Equipment Market Revenue billion Forecast, by Carrier Type 2020 & 2033
- Table 10: Global Nuclear Power Plant Equipment Market Volume K Units Forecast, by Carrier Type 2020 & 2033
- Table 11: Global Nuclear Power Plant Equipment Market Revenue billion Forecast, by Country 2020 & 2033
- Table 12: Global Nuclear Power Plant Equipment Market Volume K Units Forecast, by Country 2020 & 2033
- Table 13: United States Nuclear Power Plant Equipment Market Revenue (billion) Forecast, by Application 2020 & 2033
- Table 14: United States Nuclear Power Plant Equipment Market Volume (K Units) Forecast, by Application 2020 & 2033
- Table 15: Canada Nuclear Power Plant Equipment Market Revenue (billion) Forecast, by Application 2020 & 2033
- Table 16: Canada Nuclear Power Plant Equipment Market Volume (K Units) Forecast, by Application 2020 & 2033
- Table 17: Rest of North America Nuclear Power Plant Equipment Market Revenue (billion) Forecast, by Application 2020 & 2033
- Table 18: Rest of North America Nuclear Power Plant Equipment Market Volume (K Units) Forecast, by Application 2020 & 2033
- Table 19: Global Nuclear Power Plant Equipment Market Revenue billion Forecast, by Product Type 2020 & 2033
- Table 20: Global Nuclear Power Plant Equipment Market Volume K Units Forecast, by Product Type 2020 & 2033
- Table 21: Global Nuclear Power Plant Equipment Market Revenue billion Forecast, by Carrier Type 2020 & 2033
- Table 22: Global Nuclear Power Plant Equipment Market Volume K Units Forecast, by Carrier Type 2020 & 2033
- Table 23: Global Nuclear Power Plant Equipment Market Revenue billion Forecast, by Country 2020 & 2033
- Table 24: Global Nuclear Power Plant Equipment Market Volume K Units Forecast, by Country 2020 & 2033
- Table 25: China Nuclear Power Plant Equipment Market Revenue (billion) Forecast, by Application 2020 & 2033
- Table 26: China Nuclear Power Plant Equipment Market Volume (K Units) Forecast, by Application 2020 & 2033
- Table 27: India Nuclear Power Plant Equipment Market Revenue (billion) Forecast, by Application 2020 & 2033
- Table 28: India Nuclear Power Plant Equipment Market Volume (K Units) Forecast, by Application 2020 & 2033
- Table 29: Japan Nuclear Power Plant Equipment Market Revenue (billion) Forecast, by Application 2020 & 2033
- Table 30: Japan Nuclear Power Plant Equipment Market Volume (K Units) Forecast, by Application 2020 & 2033
- Table 31: South Korea Nuclear Power Plant Equipment Market Revenue (billion) Forecast, by Application 2020 & 2033
- Table 32: South Korea Nuclear Power Plant Equipment Market Volume (K Units) Forecast, by Application 2020 & 2033
- Table 33: Rest of Asia Pacific Nuclear Power Plant Equipment Market Revenue (billion) Forecast, by Application 2020 & 2033
- Table 34: Rest of Asia Pacific Nuclear Power Plant Equipment Market Volume (K Units) Forecast, by Application 2020 & 2033
- Table 35: Global Nuclear Power Plant Equipment Market Revenue billion Forecast, by Product Type 2020 & 2033
- Table 36: Global Nuclear Power Plant Equipment Market Volume K Units Forecast, by Product Type 2020 & 2033
- Table 37: Global Nuclear Power Plant Equipment Market Revenue billion Forecast, by Carrier Type 2020 & 2033
- Table 38: Global Nuclear Power Plant Equipment Market Volume K Units Forecast, by Carrier Type 2020 & 2033
- Table 39: Global Nuclear Power Plant Equipment Market Revenue billion Forecast, by Country 2020 & 2033
- Table 40: Global Nuclear Power Plant Equipment Market Volume K Units Forecast, by Country 2020 & 2033
- Table 41: Germany Nuclear Power Plant Equipment Market Revenue (billion) Forecast, by Application 2020 & 2033
- Table 42: Germany Nuclear Power Plant Equipment Market Volume (K Units) Forecast, by Application 2020 & 2033
- Table 43: United Kingdom Nuclear Power Plant Equipment Market Revenue (billion) Forecast, by Application 2020 & 2033
- Table 44: United Kingdom Nuclear Power Plant Equipment Market Volume (K Units) Forecast, by Application 2020 & 2033
- Table 45: Russia Nuclear Power Plant Equipment Market Revenue (billion) Forecast, by Application 2020 & 2033
- Table 46: Russia Nuclear Power Plant Equipment Market Volume (K Units) Forecast, by Application 2020 & 2033
- Table 47: France Nuclear Power Plant Equipment Market Revenue (billion) Forecast, by Application 2020 & 2033
- Table 48: France Nuclear Power Plant Equipment Market Volume (K Units) Forecast, by Application 2020 & 2033
- Table 49: Rest of Europe Nuclear Power Plant Equipment Market Revenue (billion) Forecast, by Application 2020 & 2033
- Table 50: Rest of Europe Nuclear Power Plant Equipment Market Volume (K Units) Forecast, by Application 2020 & 2033
- Table 51: Global Nuclear Power Plant Equipment Market Revenue billion Forecast, by Product Type 2020 & 2033
- Table 52: Global Nuclear Power Plant Equipment Market Volume K Units Forecast, by Product Type 2020 & 2033
- Table 53: Global Nuclear Power Plant Equipment Market Revenue billion Forecast, by Carrier Type 2020 & 2033
- Table 54: Global Nuclear Power Plant Equipment Market Volume K Units Forecast, by Carrier Type 2020 & 2033
- Table 55: Global Nuclear Power Plant Equipment Market Revenue billion Forecast, by Country 2020 & 2033
- Table 56: Global Nuclear Power Plant Equipment Market Volume K Units Forecast, by Country 2020 & 2033
- Table 57: United Arab Emirates Nuclear Power Plant Equipment Market Revenue (billion) Forecast, by Application 2020 & 2033
- Table 58: United Arab Emirates Nuclear Power Plant Equipment Market Volume (K Units) Forecast, by Application 2020 & 2033
- Table 59: Saudi Arabia Nuclear Power Plant Equipment Market Revenue (billion) Forecast, by Application 2020 & 2033
- Table 60: Saudi Arabia Nuclear Power Plant Equipment Market Volume (K Units) Forecast, by Application 2020 & 2033
- Table 61: South Africa Nuclear Power Plant Equipment Market Revenue (billion) Forecast, by Application 2020 & 2033
- Table 62: South Africa Nuclear Power Plant Equipment Market Volume (K Units) Forecast, by Application 2020 & 2033
- Table 63: Iran Nuclear Power Plant Equipment Market Revenue (billion) Forecast, by Application 2020 & 2033
- Table 64: Iran Nuclear Power Plant Equipment Market Volume (K Units) Forecast, by Application 2020 & 2033
- Table 65: Rest of Middle East and Africa Nuclear Power Plant Equipment Market Revenue (billion) Forecast, by Application 2020 & 2033
- Table 66: Rest of Middle East and Africa Nuclear Power Plant Equipment Market Volume (K Units) Forecast, by Application 2020 & 2033
- Table 67: Global Nuclear Power Plant Equipment Market Revenue billion Forecast, by Product Type 2020 & 2033
- Table 68: Global Nuclear Power Plant Equipment Market Volume K Units Forecast, by Product Type 2020 & 2033
- Table 69: Global Nuclear Power Plant Equipment Market Revenue billion Forecast, by Carrier Type 2020 & 2033
- Table 70: Global Nuclear Power Plant Equipment Market Volume K Units Forecast, by Carrier Type 2020 & 2033
- Table 71: Global Nuclear Power Plant Equipment Market Revenue billion Forecast, by Country 2020 & 2033
- Table 72: Global Nuclear Power Plant Equipment Market Volume K Units Forecast, by Country 2020 & 2033
- Table 73: Brazil Nuclear Power Plant Equipment Market Revenue (billion) Forecast, by Application 2020 & 2033
- Table 74: Brazil Nuclear Power Plant Equipment Market Volume (K Units) Forecast, by Application 2020 & 2033
- Table 75: Argentina Nuclear Power Plant Equipment Market Revenue (billion) Forecast, by Application 2020 & 2033
- Table 76: Argentina Nuclear Power Plant Equipment Market Volume (K Units) Forecast, by Application 2020 & 2033
- Table 77: Rest of South America Nuclear Power Plant Equipment Market Revenue (billion) Forecast, by Application 2020 & 2033
- Table 78: Rest of South America Nuclear Power Plant Equipment Market Volume (K Units) Forecast, by Application 2020 & 2033
Frequently Asked Questions
1. What is the projected Compound Annual Growth Rate (CAGR) of the Nuclear Power Plant Equipment Market?
The projected CAGR is approximately 3.5%.
2. Which companies are prominent players in the Nuclear Power Plant Equipment Market?
Key companies in the market include GE-Hitachi Nuclear Energy, Larsen & Toubro Ltd, JSC AEM-technology, Dongfang Electric Corp Limited, Doosan Corporation, Babcock & Wilcox Company, Areva SA, Korea Electric Power Corporation (KEPCO), Westinghouse Electric Company LLC, JSC ATOMSTROYEXPORT, Mitsubishi Heavy Industries Ltd.
3. What are the main segments of the Nuclear Power Plant Equipment Market?
The market segments include Product Type, Carrier Type.
4. Can you provide details about the market size?
The market size is estimated to be USD 47.43 billion as of 2022.
5. What are some drivers contributing to market growth?
4.; Growing Vehicle Ownership4.; Government Initiatives.
6. What are the notable trends driving market growth?
Pressurized Water Reactor to Dominate the Market.
7. Are there any restraints impacting market growth?
4.; Volatile Crude Oil Prices.
8. Can you provide examples of recent developments in the market?
In May 2020, Russia's Atommash shipped the first components for the Turkish Akkuyu nuclear power plant, which was being built by the state nuclear corporation Rosatom. Rosatom said it stepped up the training of staff for the Akkuyu project, and it is carrying out the exercise in conjunction with a nuclear utility, Rosenergoatom.
9. What pricing options are available for accessing the report?
Pricing options include single-user, multi-user, and enterprise licenses priced at USD 4750, USD 5250, and USD 8750 respectively.
10. Is the market size provided in terms of value or volume?
The market size is provided in terms of value, measured in billion and volume, measured in K Units.
11. Are there any specific market keywords associated with the report?
Yes, the market keyword associated with the report is "Nuclear Power Plant Equipment Market," which aids in identifying and referencing the specific market segment covered.
12. How do I determine which pricing option suits my needs best?
The pricing options vary based on user requirements and access needs. Individual users may opt for single-user licenses, while businesses requiring broader access may choose multi-user or enterprise licenses for cost-effective access to the report.
13. Are there any additional resources or data provided in the Nuclear Power Plant Equipment Market report?
While the report offers comprehensive insights, it's advisable to review the specific contents or supplementary materials provided to ascertain if additional resources or data are available.
14. How can I stay updated on further developments or reports in the Nuclear Power Plant Equipment Market?
To stay informed about further developments, trends, and reports in the Nuclear Power Plant Equipment Market, consider subscribing to industry newsletters, following relevant companies and organizations, or regularly checking reputable industry news sources and publications.
Methodology
Step 1 - Identification of Relevant Samples Size from Population Database


Step 2 - Approaches for Defining Global Market Size (Value, Volume* & Price*)

Note*: In applicable scenarios
Step 3 - Data Sources
Primary Research
- Web Analytics
- Survey Reports
- Research Institute
- Latest Research Reports
- Opinion Leaders
Secondary Research
- Annual Reports
- White Paper
- Latest Press Release
- Industry Association
- Paid Database
- Investor Presentations

Step 4 - Data Triangulation
Involves using different sources of information in order to increase the validity of a study
These sources are likely to be stakeholders in a program - participants, other researchers, program staff, other community members, and so on.
Then we put all data in single framework & apply various statistical tools to find out the dynamic on the market.
During the analysis stage, feedback from the stakeholder groups would be compared to determine areas of agreement as well as areas of divergence