

Key Insights
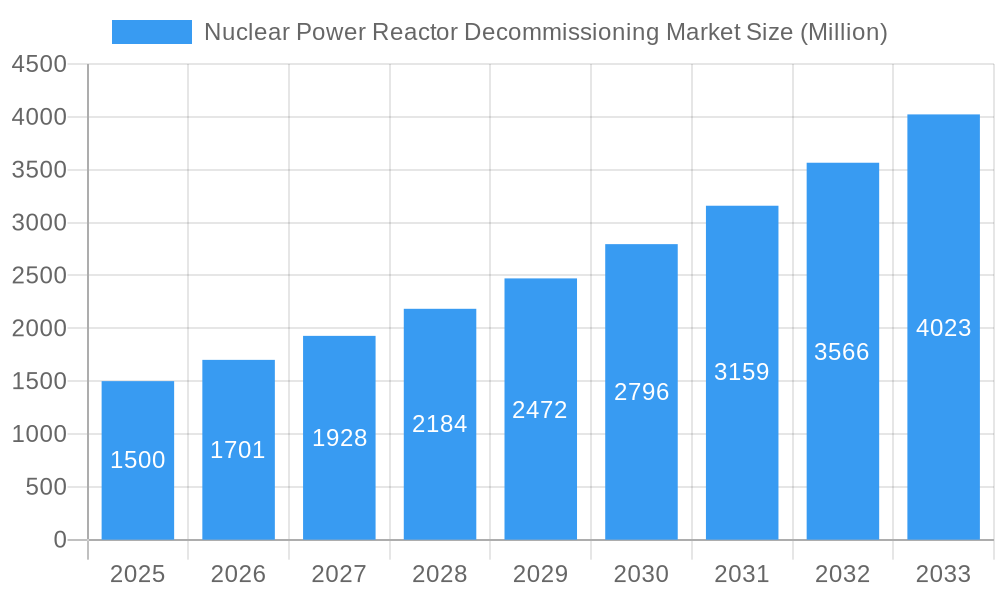
The global Nuclear Power Reactor Decommissioning market is poised for significant expansion, driven by the aging infrastructure of existing nuclear power plants and increasingly stringent regulatory mandates for safe and efficient closure. The market, valued at $8170.1 million in the base year of 2023, is projected to grow at a Compound Annual Growth Rate (CAGR) of 4%. This growth is supported by heightened public awareness of nuclear waste management, the imperative for sustainable solutions for spent fuel, and advancements in decommissioning technologies like robotics and sophisticated waste processing. The market is segmented by reactor type (e.g., Pressurized Water Reactor, Pressurized Heavy Water Reactor), application (Commercial, Prototype, Research), and capacity (Below 100 MW, 100-1000 MW, Above 1000 MW). North America currently leads the market, with Asia-Pacific and Europe demonstrating substantial growth potential.
Nuclear Power Reactor Decommissioning Market Market Size (In Billion)
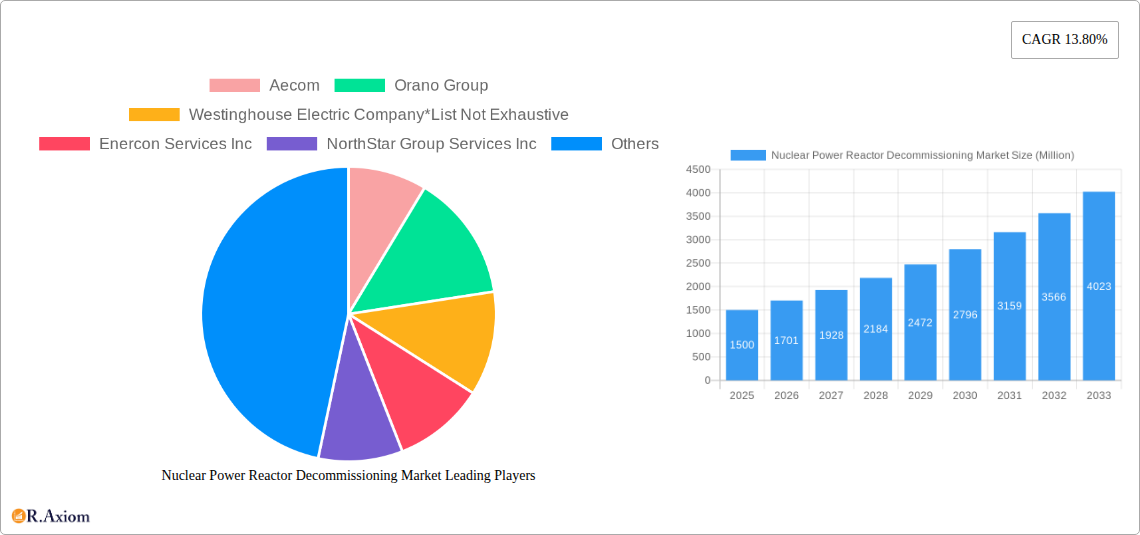
Key industry players, including Aecom, Orano Group, and Westinghouse Electric Company, are strategically investing in research and development to enhance decommissioning expertise and expand service portfolios. Intensifying competition is characterized by strategic collaborations and acquisitions aimed at market consolidation. Despite challenges such as high decommissioning costs and the complexities of radioactive waste management, the long-term outlook for the Nuclear Power Reactor Decommissioning market is robust, fueled by the ongoing need to retire aging nuclear facilities globally and ensure responsible nuclear waste stewardship. A growing focus on environmental protection and regulatory compliance will further accelerate market development.
Nuclear Power Reactor Decommissioning Market Company Market Share
Nuclear Power Reactor Decommissioning Market: A Comprehensive Report (2019-2033)
This in-depth report provides a comprehensive analysis of the global Nuclear Power Reactor Decommissioning Market, offering invaluable insights for industry stakeholders, investors, and strategic decision-makers. The study covers the period from 2019 to 2033, with 2025 serving as the base and estimated year. The forecast period spans from 2025 to 2033, encompassing historical data from 2019 to 2024. Key players analyzed include Aecom, Orano Group, Westinghouse Electric Company, Enercon Services Inc, NorthStar Group Services Inc, GE Hitachi Nuclear Services, James Fisher & Sons PLC, Bechtel Group Inc, Fluor Corporation, Babcock International Group PLC, and Studsvik AB. The market is segmented by reactor type, application, and capacity, providing a granular understanding of market dynamics. The report's projected market value in 2033 is xx Million.
Nuclear Power Reactor Decommissioning Market Market Concentration & Innovation
The Nuclear Power Reactor Decommissioning market exhibits a moderately concentrated landscape, with a few major players holding significant market share. While exact figures are proprietary to the full report, analysis reveals a trend towards consolidation through mergers and acquisitions (M&A). Several high-value M&A deals, exceeding xx Million each, have been observed in recent years, driving increased market concentration and impacting the competitive dynamics.
Market Concentration Metrics:
- Market share of top 5 players: xx% (2025 Estimate)
- Average deal value (M&A): xx Million (2019-2024)
Innovation Drivers:
- Technological advancements in dismantling techniques and waste management.
- Development of robotics and automation for safer and efficient decommissioning processes.
- Increased focus on minimizing environmental impact and optimizing waste disposal.
Regulatory Frameworks:
Stringent regulatory compliance requirements significantly influence the market, requiring specialized expertise and meticulous planning. Variations in regulations across different countries impact operational strategies and investment decisions.
Product Substitutes & End-User Trends:
Limited direct substitutes exist for the specialized services offered within this market. However, the increasing emphasis on safety, sustainability, and cost-effectiveness drives demand for innovative solutions and influences end-user preferences towards experienced and reliable service providers.
Nuclear Power Reactor Decommissioning Market Industry Trends & Insights
The Nuclear Power Reactor Decommissioning market is experiencing robust growth, driven by the aging global nuclear power plant fleet and the increasing need for safe and efficient decommissioning. The market is projected to witness a Compound Annual Growth Rate (CAGR) of xx% during the forecast period (2025-2033). This growth is fueled by several factors, including:
- Increased number of reactors nearing the end of their operational lifespan.
- Stringent government regulations mandating safe and environmentally sound decommissioning.
- Rising awareness of the potential environmental and health hazards associated with improper decommissioning.
- Technological advancements leading to improved decommissioning techniques and reduced costs.
Market penetration of advanced technologies like robotics and remote handling systems is gradually increasing, enhancing safety and efficiency. Consumer preferences are shifting towards companies offering comprehensive and sustainable solutions, including waste management and site restoration. Competitive dynamics are characterized by both collaboration and competition among market players, with strategic alliances and partnerships becoming increasingly common.
Dominant Markets & Segments in Nuclear Power Reactor Decommissioning Market
The North American region currently holds the largest market share, driven by a substantial number of aging reactors requiring decommissioning. However, Asia Pacific is projected to experience significant growth due to an increasing number of operational reactors approaching the end of their lifespan.
Leading Segments:
- By Reactor Type: Pressurized Water Reactor (PWR) dominates due to its widespread use globally.
- By Application: Commercial Power Reactors constitute the largest segment, representing the majority of decommissioning projects.
- By Capacity: The 100-1000 MW capacity segment holds a substantial market share, reflecting the size of many existing reactors.
Key Drivers:
- Economic Policies: Government incentives and funding for safe decommissioning practices.
- Infrastructure: Existing infrastructure and skilled workforce availability.
- Regulatory Landscape: Stringent safety and environmental regulations.
Dominance Analysis:
The dominance of certain regions and segments stems from a combination of factors. The high concentration of aging reactors in specific regions drives demand, while the prevalence of certain reactor types influences project volume and complexity. Technological advancements and government policies further shape market trends and segment dominance.
Nuclear Power Reactor Decommissioning Market Product Developments
Recent product innovations have focused on enhancing safety, efficiency, and sustainability in decommissioning processes. This includes the development of advanced robotics, remote-controlled equipment, and improved waste management technologies. These developments cater to the growing demand for safer and environmentally responsible decommissioning practices. Competition within the sector is intense, driving companies to constantly innovate and improve their offerings to remain competitive. The market is also witnessing a trend toward integrated solutions that encompass the entire decommissioning lifecycle, from planning and dismantling to site restoration.
Report Scope & Segmentation Analysis
This report provides a detailed segmentation of the Nuclear Power Reactor Decommissioning market based on reactor type (PWR, PHWR, BWR, HTGR, LMFBR, Other), application (Commercial, Prototype, Research), and capacity (Below 100 MW, 100-1000 MW, Above 1000 MW). Each segment's growth projections, market size, and competitive dynamics are analyzed, offering a comprehensive overview of market opportunities and challenges. For example, the PWR segment is expected to exhibit strong growth due to its large installed base, while the above 1000 MW capacity segment presents significant challenges and opportunities due to project complexity.
Key Drivers of Nuclear Power Reactor Decommissioning Market Growth
The growth of this market is primarily driven by technological advancements in decommissioning techniques, increasing numbers of aging nuclear power plants requiring decommissioning, stringent government regulations promoting safe practices, and growing awareness of environmental and health risks. Economic factors, such as government incentives and funding for decommissioning projects, also play a crucial role.
Challenges in the Nuclear Power Reactor Decommissioning Market Sector
Significant challenges include the high cost and complexity of decommissioning, the need for specialized expertise and equipment, and the potential for regulatory hurdles and delays. Supply chain disruptions related to specialized components and materials can also impact project timelines and budgets. Intense competition among established players further complicates the market dynamics. The overall cost of decommissioning can amount to xx Million per reactor depending on size and technology, representing a considerable barrier to entry.
Emerging Opportunities in Nuclear Power Reactor Decommissioning Market
Emerging opportunities lie in the development and deployment of innovative technologies, such as advanced robotics and automation, to enhance safety and reduce costs. The growing focus on sustainable practices and waste minimization offers opportunities for companies specializing in environmentally friendly solutions. Expanding into new markets with a large number of aging reactors presents significant growth potential. Furthermore, the development of specialized decommissioning services tailored to specific reactor types can lead to new market niches and revenue streams.
Leading Players in the Nuclear Power Reactor Decommissioning Market Market
- Aecom
- Orano Group
- Westinghouse Electric Company
- Enercon Services Inc
- NorthStar Group Services Inc
- GE Hitachi Nuclear Services
- James Fisher & Sons PLC
- Bechtel Group Inc
- Fluor Corporation
- Babcock International Group PLC
- Studsvik AB
Key Developments in Nuclear Power Reactor Decommissioning Market Industry
- Jan 2023: NorthStar Group announces a major contract for decommissioning a PWR reactor in the US.
- May 2022: Orano Group invests in the development of advanced robotics for decommissioning.
- Oct 2021: A consortium of companies wins a significant contract for decommissioning a research reactor in Europe. (Further developments will be included in the full report)
Strategic Outlook for Nuclear Power Reactor Decommissioning Market Market
The Nuclear Power Reactor Decommissioning market is poised for continued growth, driven by a combination of factors including the increasing number of aging reactors, technological advancements, and stringent regulatory requirements. The focus on safety, sustainability, and cost-effectiveness will continue to shape market trends, creating opportunities for innovative companies to emerge and capture market share. The future outlook remains positive, with significant growth potential in various regions and market segments.
Nuclear Power Reactor Decommissioning Market Segmentation
-
1. Reactor Type
- 1.1. Pressurized Water Reactor
- 1.2. Pressurized Heavy Water Reactor
- 1.3. Boiling Water Reactor
- 1.4. High-temperature Gas-cooled Reactor
- 1.5. Liquid Metal Fast Breeder Reactor
- 1.6. Other Reactor Types
-
2. Application
- 2.1. Commercial Power Reactor
- 2.2. Prototype Power Reactor
- 2.3. Research Reactor
-
3. Capacity
- 3.1. Below 100 MW
- 3.2. 100-1000 MW
- 3.3. Above 1000 MW
Nuclear Power Reactor Decommissioning Market Segmentation By Geography
- 1. North America
- 2. Asia Pacific
- 3. Europe
- 4. South America
- 5. Middle East and Africa
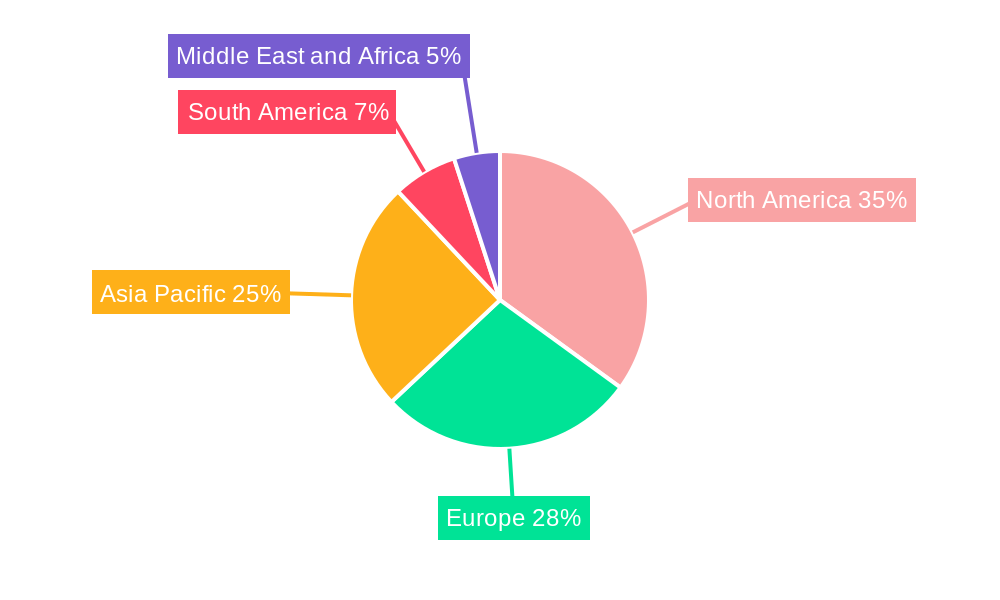
Nuclear Power Reactor Decommissioning Market Regional Market Share
Geographic Coverage of Nuclear Power Reactor Decommissioning Market
Nuclear Power Reactor Decommissioning Market REPORT HIGHLIGHTS
| Aspects | Details |
|---|---|
| Study Period | 2020-2034 |
| Base Year | 2025 |
| Estimated Year | 2026 |
| Forecast Period | 2026-2034 |
| Historical Period | 2020-2025 |
| Growth Rate | CAGR of 4% from 2020-2034 |
| Segmentation |
|
Table of Contents
- 1. Introduction
- 1.1. Research Scope
- 1.2. Market Segmentation
- 1.3. Research Objective
- 1.4. Definitions and Assumptions
- 2. Executive Summary
- 2.1. Market Snapshot
- 3. Market Dynamics
- 3.1. Market Drivers
- 3.2. Market Restrains
- 3.3. Market Trends
- 3.4. Market Opportunities
- 4. Market Factor Analysis
- 4.1. Porters Five Forces
- 4.1.1. Bargaining Power of Suppliers
- 4.1.2. Bargaining Power of Buyers
- 4.1.3. Threat of New Entrants
- 4.1.4. Threat of Substitutes
- 4.1.5. Competitive Rivalry
- 4.2. PESTEL analysis
- 4.3. BCG Analysis
- 4.3.1. Stars (High Growth, High Market Share)
- 4.3.2. Cash Cows (Low Growth, High Market Share)
- 4.3.3. Question Mark (High Growth, Low Market Share)
- 4.3.4. Dogs (Low Growth, Low Market Share)
- 4.4. Ansoff Matrix Analysis
- 4.5. Supply Chain Analysis
- 4.6. Regulatory Landscape
- 4.7. Current Market Potential and Opportunity Assessment (TAM–SAM–SOM Framework)
- 4.8. RAX Analyst Note
- 4.1. Porters Five Forces
- 5. Market Analysis, Insights and Forecast 2021-2033
- 5.1. Market Analysis, Insights and Forecast - by Reactor Type
- 5.1.1. Pressurized Water Reactor
- 5.1.2. Pressurized Heavy Water Reactor
- 5.1.3. Boiling Water Reactor
- 5.1.4. High-temperature Gas-cooled Reactor
- 5.1.5. Liquid Metal Fast Breeder Reactor
- 5.1.6. Other Reactor Types
- 5.2. Market Analysis, Insights and Forecast - by Application
- 5.2.1. Commercial Power Reactor
- 5.2.2. Prototype Power Reactor
- 5.2.3. Research Reactor
- 5.3. Market Analysis, Insights and Forecast - by Capacity
- 5.3.1. Below 100 MW
- 5.3.2. 100-1000 MW
- 5.3.3. Above 1000 MW
- 5.4. Market Analysis, Insights and Forecast - by Region
- 5.4.1. North America
- 5.4.2. Asia Pacific
- 5.4.3. Europe
- 5.4.4. South America
- 5.4.5. Middle East and Africa
- 5.1. Market Analysis, Insights and Forecast - by Reactor Type
- 6. Global Nuclear Power Reactor Decommissioning Market Analysis, Insights and Forecast, 2021-2033
- 6.1. Market Analysis, Insights and Forecast - by Reactor Type
- 6.1.1. Pressurized Water Reactor
- 6.1.2. Pressurized Heavy Water Reactor
- 6.1.3. Boiling Water Reactor
- 6.1.4. High-temperature Gas-cooled Reactor
- 6.1.5. Liquid Metal Fast Breeder Reactor
- 6.1.6. Other Reactor Types
- 6.2. Market Analysis, Insights and Forecast - by Application
- 6.2.1. Commercial Power Reactor
- 6.2.2. Prototype Power Reactor
- 6.2.3. Research Reactor
- 6.3. Market Analysis, Insights and Forecast - by Capacity
- 6.3.1. Below 100 MW
- 6.3.2. 100-1000 MW
- 6.3.3. Above 1000 MW
- 6.1. Market Analysis, Insights and Forecast - by Reactor Type
- 7. North America Nuclear Power Reactor Decommissioning Market Analysis, Insights and Forecast, 2020-2032
- 7.1. Market Analysis, Insights and Forecast - by Reactor Type
- 7.1.1. Pressurized Water Reactor
- 7.1.2. Pressurized Heavy Water Reactor
- 7.1.3. Boiling Water Reactor
- 7.1.4. High-temperature Gas-cooled Reactor
- 7.1.5. Liquid Metal Fast Breeder Reactor
- 7.1.6. Other Reactor Types
- 7.2. Market Analysis, Insights and Forecast - by Application
- 7.2.1. Commercial Power Reactor
- 7.2.2. Prototype Power Reactor
- 7.2.3. Research Reactor
- 7.3. Market Analysis, Insights and Forecast - by Capacity
- 7.3.1. Below 100 MW
- 7.3.2. 100-1000 MW
- 7.3.3. Above 1000 MW
- 7.1. Market Analysis, Insights and Forecast - by Reactor Type
- 8. Asia Pacific Nuclear Power Reactor Decommissioning Market Analysis, Insights and Forecast, 2020-2032
- 8.1. Market Analysis, Insights and Forecast - by Reactor Type
- 8.1.1. Pressurized Water Reactor
- 8.1.2. Pressurized Heavy Water Reactor
- 8.1.3. Boiling Water Reactor
- 8.1.4. High-temperature Gas-cooled Reactor
- 8.1.5. Liquid Metal Fast Breeder Reactor
- 8.1.6. Other Reactor Types
- 8.2. Market Analysis, Insights and Forecast - by Application
- 8.2.1. Commercial Power Reactor
- 8.2.2. Prototype Power Reactor
- 8.2.3. Research Reactor
- 8.3. Market Analysis, Insights and Forecast - by Capacity
- 8.3.1. Below 100 MW
- 8.3.2. 100-1000 MW
- 8.3.3. Above 1000 MW
- 8.1. Market Analysis, Insights and Forecast - by Reactor Type
- 9. Europe Nuclear Power Reactor Decommissioning Market Analysis, Insights and Forecast, 2020-2032
- 9.1. Market Analysis, Insights and Forecast - by Reactor Type
- 9.1.1. Pressurized Water Reactor
- 9.1.2. Pressurized Heavy Water Reactor
- 9.1.3. Boiling Water Reactor
- 9.1.4. High-temperature Gas-cooled Reactor
- 9.1.5. Liquid Metal Fast Breeder Reactor
- 9.1.6. Other Reactor Types
- 9.2. Market Analysis, Insights and Forecast - by Application
- 9.2.1. Commercial Power Reactor
- 9.2.2. Prototype Power Reactor
- 9.2.3. Research Reactor
- 9.3. Market Analysis, Insights and Forecast - by Capacity
- 9.3.1. Below 100 MW
- 9.3.2. 100-1000 MW
- 9.3.3. Above 1000 MW
- 9.1. Market Analysis, Insights and Forecast - by Reactor Type
- 10. South America Nuclear Power Reactor Decommissioning Market Analysis, Insights and Forecast, 2020-2032
- 10.1. Market Analysis, Insights and Forecast - by Reactor Type
- 10.1.1. Pressurized Water Reactor
- 10.1.2. Pressurized Heavy Water Reactor
- 10.1.3. Boiling Water Reactor
- 10.1.4. High-temperature Gas-cooled Reactor
- 10.1.5. Liquid Metal Fast Breeder Reactor
- 10.1.6. Other Reactor Types
- 10.2. Market Analysis, Insights and Forecast - by Application
- 10.2.1. Commercial Power Reactor
- 10.2.2. Prototype Power Reactor
- 10.2.3. Research Reactor
- 10.3. Market Analysis, Insights and Forecast - by Capacity
- 10.3.1. Below 100 MW
- 10.3.2. 100-1000 MW
- 10.3.3. Above 1000 MW
- 10.1. Market Analysis, Insights and Forecast - by Reactor Type
- 11. Middle East and Africa Nuclear Power Reactor Decommissioning Market Analysis, Insights and Forecast, 2020-2032
- 11.1. Market Analysis, Insights and Forecast - by Reactor Type
- 11.1.1. Pressurized Water Reactor
- 11.1.2. Pressurized Heavy Water Reactor
- 11.1.3. Boiling Water Reactor
- 11.1.4. High-temperature Gas-cooled Reactor
- 11.1.5. Liquid Metal Fast Breeder Reactor
- 11.1.6. Other Reactor Types
- 11.2. Market Analysis, Insights and Forecast - by Application
- 11.2.1. Commercial Power Reactor
- 11.2.2. Prototype Power Reactor
- 11.2.3. Research Reactor
- 11.3. Market Analysis, Insights and Forecast - by Capacity
- 11.3.1. Below 100 MW
- 11.3.2. 100-1000 MW
- 11.3.3. Above 1000 MW
- 11.1. Market Analysis, Insights and Forecast - by Reactor Type
- 12. Competitive Analysis
- 12.1. Company Profiles
- 12.1.1 Aecom
- 12.1.1.1. Company Overview
- 12.1.1.2. Products
- 12.1.1.3. Company Financials
- 12.1.1.4. SWOT Analysis
- 12.1.2 Orano Group
- 12.1.2.1. Company Overview
- 12.1.2.2. Products
- 12.1.2.3. Company Financials
- 12.1.2.4. SWOT Analysis
- 12.1.3 Westinghouse Electric Company*List Not Exhaustive
- 12.1.3.1. Company Overview
- 12.1.3.2. Products
- 12.1.3.3. Company Financials
- 12.1.3.4. SWOT Analysis
- 12.1.4 Enercon Services Inc
- 12.1.4.1. Company Overview
- 12.1.4.2. Products
- 12.1.4.3. Company Financials
- 12.1.4.4. SWOT Analysis
- 12.1.5 NorthStar Group Services Inc
- 12.1.5.1. Company Overview
- 12.1.5.2. Products
- 12.1.5.3. Company Financials
- 12.1.5.4. SWOT Analysis
- 12.1.6 GE Hitachi Nuclear Services
- 12.1.6.1. Company Overview
- 12.1.6.2. Products
- 12.1.6.3. Company Financials
- 12.1.6.4. SWOT Analysis
- 12.1.7 James Fisher & Sons PLC
- 12.1.7.1. Company Overview
- 12.1.7.2. Products
- 12.1.7.3. Company Financials
- 12.1.7.4. SWOT Analysis
- 12.1.8 Bechtel Group Inc
- 12.1.8.1. Company Overview
- 12.1.8.2. Products
- 12.1.8.3. Company Financials
- 12.1.8.4. SWOT Analysis
- 12.1.9 Fluor Corporation
- 12.1.9.1. Company Overview
- 12.1.9.2. Products
- 12.1.9.3. Company Financials
- 12.1.9.4. SWOT Analysis
- 12.1.10 Babcock International Group PLC
- 12.1.10.1. Company Overview
- 12.1.10.2. Products
- 12.1.10.3. Company Financials
- 12.1.10.4. SWOT Analysis
- 12.1.11 Studsvik AB
- 12.1.11.1. Company Overview
- 12.1.11.2. Products
- 12.1.11.3. Company Financials
- 12.1.11.4. SWOT Analysis
- 12.1.1 Aecom
- 12.2. Market Entropy
- 12.2.1 Company's Key Areas Served
- 12.2.2 Recent Developments
- 12.3. Company Market Share Analysis 2025
- 12.3.1 Top 5 Companies Market Share Analysis
- 12.3.2 Top 3 Companies Market Share Analysis
- 12.4. List of Potential Customers
- 13. Research Methodology
List of Figures
- Figure 1: Global Nuclear Power Reactor Decommissioning Market Revenue Breakdown (million, %) by Region 2025 & 2033
- Figure 2: North America Nuclear Power Reactor Decommissioning Market Revenue (million), by Reactor Type 2025 & 2033
- Figure 3: North America Nuclear Power Reactor Decommissioning Market Revenue Share (%), by Reactor Type 2025 & 2033
- Figure 4: North America Nuclear Power Reactor Decommissioning Market Revenue (million), by Application 2025 & 2033
- Figure 5: North America Nuclear Power Reactor Decommissioning Market Revenue Share (%), by Application 2025 & 2033
- Figure 6: North America Nuclear Power Reactor Decommissioning Market Revenue (million), by Capacity 2025 & 2033
- Figure 7: North America Nuclear Power Reactor Decommissioning Market Revenue Share (%), by Capacity 2025 & 2033
- Figure 8: North America Nuclear Power Reactor Decommissioning Market Revenue (million), by Country 2025 & 2033
- Figure 9: North America Nuclear Power Reactor Decommissioning Market Revenue Share (%), by Country 2025 & 2033
- Figure 10: Asia Pacific Nuclear Power Reactor Decommissioning Market Revenue (million), by Reactor Type 2025 & 2033
- Figure 11: Asia Pacific Nuclear Power Reactor Decommissioning Market Revenue Share (%), by Reactor Type 2025 & 2033
- Figure 12: Asia Pacific Nuclear Power Reactor Decommissioning Market Revenue (million), by Application 2025 & 2033
- Figure 13: Asia Pacific Nuclear Power Reactor Decommissioning Market Revenue Share (%), by Application 2025 & 2033
- Figure 14: Asia Pacific Nuclear Power Reactor Decommissioning Market Revenue (million), by Capacity 2025 & 2033
- Figure 15: Asia Pacific Nuclear Power Reactor Decommissioning Market Revenue Share (%), by Capacity 2025 & 2033
- Figure 16: Asia Pacific Nuclear Power Reactor Decommissioning Market Revenue (million), by Country 2025 & 2033
- Figure 17: Asia Pacific Nuclear Power Reactor Decommissioning Market Revenue Share (%), by Country 2025 & 2033
- Figure 18: Europe Nuclear Power Reactor Decommissioning Market Revenue (million), by Reactor Type 2025 & 2033
- Figure 19: Europe Nuclear Power Reactor Decommissioning Market Revenue Share (%), by Reactor Type 2025 & 2033
- Figure 20: Europe Nuclear Power Reactor Decommissioning Market Revenue (million), by Application 2025 & 2033
- Figure 21: Europe Nuclear Power Reactor Decommissioning Market Revenue Share (%), by Application 2025 & 2033
- Figure 22: Europe Nuclear Power Reactor Decommissioning Market Revenue (million), by Capacity 2025 & 2033
- Figure 23: Europe Nuclear Power Reactor Decommissioning Market Revenue Share (%), by Capacity 2025 & 2033
- Figure 24: Europe Nuclear Power Reactor Decommissioning Market Revenue (million), by Country 2025 & 2033
- Figure 25: Europe Nuclear Power Reactor Decommissioning Market Revenue Share (%), by Country 2025 & 2033
- Figure 26: South America Nuclear Power Reactor Decommissioning Market Revenue (million), by Reactor Type 2025 & 2033
- Figure 27: South America Nuclear Power Reactor Decommissioning Market Revenue Share (%), by Reactor Type 2025 & 2033
- Figure 28: South America Nuclear Power Reactor Decommissioning Market Revenue (million), by Application 2025 & 2033
- Figure 29: South America Nuclear Power Reactor Decommissioning Market Revenue Share (%), by Application 2025 & 2033
- Figure 30: South America Nuclear Power Reactor Decommissioning Market Revenue (million), by Capacity 2025 & 2033
- Figure 31: South America Nuclear Power Reactor Decommissioning Market Revenue Share (%), by Capacity 2025 & 2033
- Figure 32: South America Nuclear Power Reactor Decommissioning Market Revenue (million), by Country 2025 & 2033
- Figure 33: South America Nuclear Power Reactor Decommissioning Market Revenue Share (%), by Country 2025 & 2033
- Figure 34: Middle East and Africa Nuclear Power Reactor Decommissioning Market Revenue (million), by Reactor Type 2025 & 2033
- Figure 35: Middle East and Africa Nuclear Power Reactor Decommissioning Market Revenue Share (%), by Reactor Type 2025 & 2033
- Figure 36: Middle East and Africa Nuclear Power Reactor Decommissioning Market Revenue (million), by Application 2025 & 2033
- Figure 37: Middle East and Africa Nuclear Power Reactor Decommissioning Market Revenue Share (%), by Application 2025 & 2033
- Figure 38: Middle East and Africa Nuclear Power Reactor Decommissioning Market Revenue (million), by Capacity 2025 & 2033
- Figure 39: Middle East and Africa Nuclear Power Reactor Decommissioning Market Revenue Share (%), by Capacity 2025 & 2033
- Figure 40: Middle East and Africa Nuclear Power Reactor Decommissioning Market Revenue (million), by Country 2025 & 2033
- Figure 41: Middle East and Africa Nuclear Power Reactor Decommissioning Market Revenue Share (%), by Country 2025 & 2033
List of Tables
- Table 1: Global Nuclear Power Reactor Decommissioning Market Revenue million Forecast, by Reactor Type 2020 & 2033
- Table 2: Global Nuclear Power Reactor Decommissioning Market Revenue million Forecast, by Application 2020 & 2033
- Table 3: Global Nuclear Power Reactor Decommissioning Market Revenue million Forecast, by Capacity 2020 & 2033
- Table 4: Global Nuclear Power Reactor Decommissioning Market Revenue million Forecast, by Region 2020 & 2033
- Table 5: Global Nuclear Power Reactor Decommissioning Market Revenue million Forecast, by Reactor Type 2020 & 2033
- Table 6: Global Nuclear Power Reactor Decommissioning Market Revenue million Forecast, by Application 2020 & 2033
- Table 7: Global Nuclear Power Reactor Decommissioning Market Revenue million Forecast, by Capacity 2020 & 2033
- Table 8: Global Nuclear Power Reactor Decommissioning Market Revenue million Forecast, by Country 2020 & 2033
- Table 9: Global Nuclear Power Reactor Decommissioning Market Revenue million Forecast, by Reactor Type 2020 & 2033
- Table 10: Global Nuclear Power Reactor Decommissioning Market Revenue million Forecast, by Application 2020 & 2033
- Table 11: Global Nuclear Power Reactor Decommissioning Market Revenue million Forecast, by Capacity 2020 & 2033
- Table 12: Global Nuclear Power Reactor Decommissioning Market Revenue million Forecast, by Country 2020 & 2033
- Table 13: Global Nuclear Power Reactor Decommissioning Market Revenue million Forecast, by Reactor Type 2020 & 2033
- Table 14: Global Nuclear Power Reactor Decommissioning Market Revenue million Forecast, by Application 2020 & 2033
- Table 15: Global Nuclear Power Reactor Decommissioning Market Revenue million Forecast, by Capacity 2020 & 2033
- Table 16: Global Nuclear Power Reactor Decommissioning Market Revenue million Forecast, by Country 2020 & 2033
- Table 17: Global Nuclear Power Reactor Decommissioning Market Revenue million Forecast, by Reactor Type 2020 & 2033
- Table 18: Global Nuclear Power Reactor Decommissioning Market Revenue million Forecast, by Application 2020 & 2033
- Table 19: Global Nuclear Power Reactor Decommissioning Market Revenue million Forecast, by Capacity 2020 & 2033
- Table 20: Global Nuclear Power Reactor Decommissioning Market Revenue million Forecast, by Country 2020 & 2033
- Table 21: Global Nuclear Power Reactor Decommissioning Market Revenue million Forecast, by Reactor Type 2020 & 2033
- Table 22: Global Nuclear Power Reactor Decommissioning Market Revenue million Forecast, by Application 2020 & 2033
- Table 23: Global Nuclear Power Reactor Decommissioning Market Revenue million Forecast, by Capacity 2020 & 2033
- Table 24: Global Nuclear Power Reactor Decommissioning Market Revenue million Forecast, by Country 2020 & 2033
Frequently Asked Questions
1. What is the projected Compound Annual Growth Rate (CAGR) of the Nuclear Power Reactor Decommissioning Market?
The projected CAGR is approximately 4%.
2. Which companies are prominent players in the Nuclear Power Reactor Decommissioning Market?
Key companies in the market include Aecom, Orano Group, Westinghouse Electric Company*List Not Exhaustive, Enercon Services Inc, NorthStar Group Services Inc, GE Hitachi Nuclear Services, James Fisher & Sons PLC, Bechtel Group Inc, Fluor Corporation, Babcock International Group PLC, Studsvik AB.
3. What are the main segments of the Nuclear Power Reactor Decommissioning Market?
The market segments include Reactor Type, Application, Capacity.
4. Can you provide details about the market size?
The market size is estimated to be USD 8170.1 million as of 2022.
5. What are some drivers contributing to market growth?
4.; Presence of Strict Government Regulations to Control Air Pollution.
6. What are the notable trends driving market growth?
Commercial Reactors Segment is Expected to Dominate the Market.
7. Are there any restraints impacting market growth?
4.; Increasing Adoption of Renewable Energy.
8. Can you provide examples of recent developments in the market?
N/A
9. What pricing options are available for accessing the report?
Pricing options include single-user, multi-user, and enterprise licenses priced at USD 4750, USD 5250, and USD 8750 respectively.
10. Is the market size provided in terms of value or volume?
The market size is provided in terms of value, measured in million.
11. Are there any specific market keywords associated with the report?
Yes, the market keyword associated with the report is "Nuclear Power Reactor Decommissioning Market," which aids in identifying and referencing the specific market segment covered.
12. How do I determine which pricing option suits my needs best?
The pricing options vary based on user requirements and access needs. Individual users may opt for single-user licenses, while businesses requiring broader access may choose multi-user or enterprise licenses for cost-effective access to the report.
13. Are there any additional resources or data provided in the Nuclear Power Reactor Decommissioning Market report?
While the report offers comprehensive insights, it's advisable to review the specific contents or supplementary materials provided to ascertain if additional resources or data are available.
14. How can I stay updated on further developments or reports in the Nuclear Power Reactor Decommissioning Market?
To stay informed about further developments, trends, and reports in the Nuclear Power Reactor Decommissioning Market, consider subscribing to industry newsletters, following relevant companies and organizations, or regularly checking reputable industry news sources and publications.
Methodology
Step 1 - Identification of Relevant Samples Size from Population Database


Step 2 - Approaches for Defining Global Market Size (Value, Volume* & Price*)

Note*: In applicable scenarios
Step 3 - Data Sources
Primary Research
- Web Analytics
- Survey Reports
- Research Institute
- Latest Research Reports
- Opinion Leaders
Secondary Research
- Annual Reports
- White Paper
- Latest Press Release
- Industry Association
- Paid Database
- Investor Presentations

Step 4 - Data Triangulation
Involves using different sources of information in order to increase the validity of a study
These sources are likely to be stakeholders in a program - participants, other researchers, program staff, other community members, and so on.
Then we put all data in single framework & apply various statistical tools to find out the dynamic on the market.
During the analysis stage, feedback from the stakeholder groups would be compared to determine areas of agreement as well as areas of divergence