
Key Insights
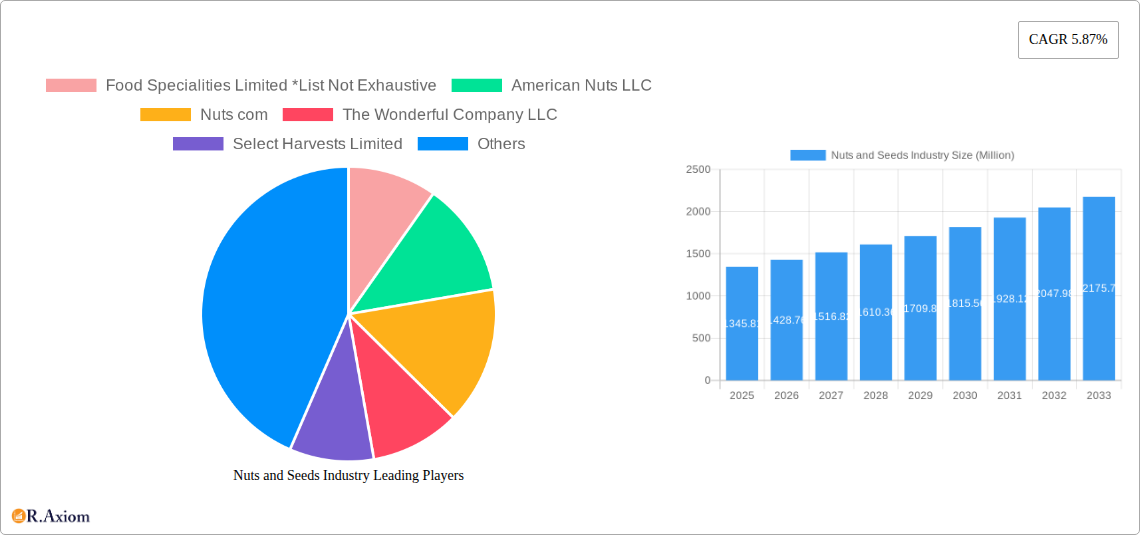
The global nuts and seeds market, valued at $1345.81 million in 2025, is projected to experience robust growth, driven by several key factors. The rising consumer awareness of the health benefits associated with nuts and seeds, including their high protein, fiber, and essential fatty acid content, fuels strong demand. This is further amplified by the growing popularity of plant-based diets and veganism, positioning nuts and seeds as crucial protein sources and healthy alternatives. The increasing incorporation of nuts and seeds into various food and beverage products, such as snack bars, breakfast cereals, and bakery items, significantly contributes to market expansion. Furthermore, the burgeoning health and wellness sector, coupled with the increasing demand for functional foods and nutraceuticals, is propelling growth within the pharmaceutical, cosmetic, and personal care segments. Geographic expansion, particularly within developing economies experiencing rising disposable incomes and changing dietary habits, presents significant opportunities for market growth. However, price volatility associated with raw material sourcing and potential supply chain disruptions remain challenges.
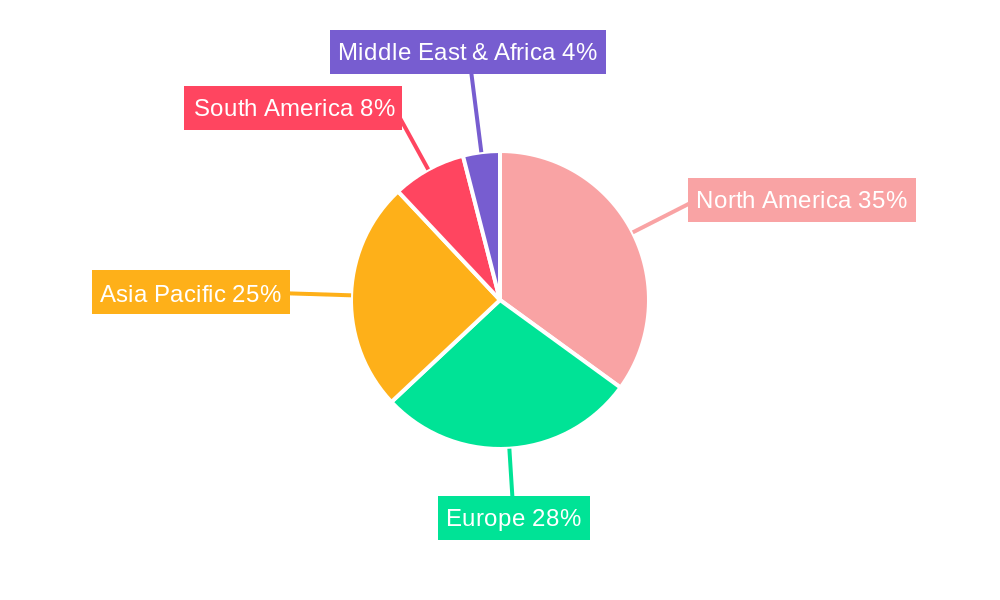
The market segmentation reveals key opportunities. The "whole" form of nuts and seeds dominates the market, followed by pieces and powdered forms. The food and beverage application segment holds the largest market share, driven by the aforementioned trends. Within the retail sector, packaged nuts and seeds and trail mixes continue to be popular choices, while the pharmaceutical, cosmetic, and personal care segments are exhibiting promising growth trajectories. Key players such as Food Specialities Limited, American Nuts LLC, and The Wonderful Company LLC are driving innovation and expansion, focusing on product diversification and strategic partnerships to enhance market penetration. The regional breakdown indicates significant potential in the Asia Pacific region, driven by increasing urbanization and changing consumer preferences. North America and Europe, while already established markets, continue to offer promising growth prospects, particularly through premium and specialized product offerings. Future growth will likely be influenced by factors like sustainable sourcing practices, innovative product development, and effective marketing strategies that highlight the health benefits of nuts and seeds.
Nuts and Seeds Industry: A Comprehensive Market Report (2019-2033)
This in-depth report provides a comprehensive analysis of the global nuts and seeds industry, offering valuable insights for stakeholders across the value chain. The report covers the period 2019-2033, with a focus on the forecast period 2025-2033 and a base year of 2025. It analyzes market size, growth drivers, challenges, and emerging opportunities, while profiling key players and significant industry developments. The total market value is projected to reach xx Million by 2033.
Nuts and Seeds Industry Market Concentration & Innovation
The nuts and seeds industry exhibits a moderately concentrated market structure, with a few large multinational players holding significant market share. Companies like Cargill Inc, Archer Daniels Midland Company, and Olam Group dominate the global landscape, controlling a combined xx% of the market in 2025. However, smaller, specialized companies like Food Specialities Limited, American Nuts LLC, Nuts.com, The Wonderful Company LLC, Select Harvests Limited, HBS Foods Ltd, and Kanegrade Ltd also play crucial roles, particularly in niche segments or specific geographical regions.
Innovation within the industry is driven by several factors, including:
- Health and Wellness Trends: Growing consumer demand for healthy snacks and nutritious ingredients fuels innovation in product formats (e.g., powdered nuts, nut butters) and formulations (e.g., organic, non-GMO options).
- Technological Advancements: Improved processing technologies enhance product quality, shelf life, and efficiency, while automation improves production capacity and reduces costs.
- Sustainable Sourcing and Production: Increasing consumer awareness of environmental and social responsibility is driving innovation in sustainable farming practices and supply chain management.
Regulatory frameworks concerning food safety and labeling influence product development and marketing. Product substitutes, such as plant-based protein sources, pose a competitive challenge, although nuts and seeds retain a strong position due to their unique nutritional profile and taste. Mergers and acquisitions (M&A) activity is relatively frequent, with larger players acquiring smaller companies to expand their product portfolios and geographic reach. The total value of M&A deals in the industry from 2019 to 2024 amounted to approximately xx Million.
Nuts and Seeds Industry Industry Trends & Insights
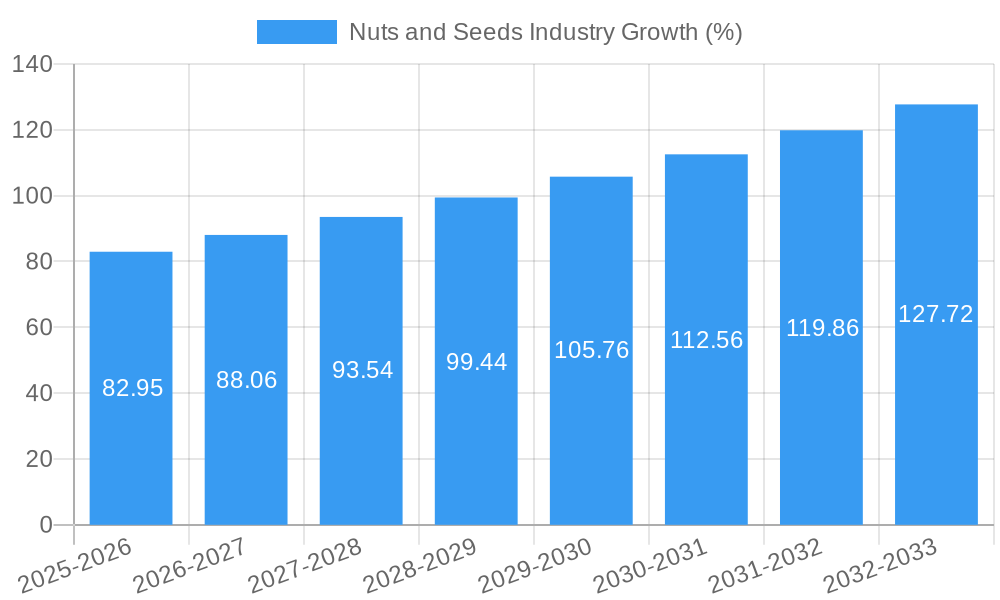
The nuts and seeds industry is experiencing robust growth, driven by several key trends. The global market is projected to achieve a CAGR of xx% during the forecast period (2025-2033), reaching a projected value of xx Million by 2033. Rising disposable incomes, particularly in emerging economies, are boosting demand for premium and convenient snack options. Health-conscious consumers are increasingly incorporating nuts and seeds into their diets due to their rich nutritional content, leading to higher market penetration. Technological disruptions, such as precision agriculture and advanced processing techniques, are enhancing efficiency and sustainability.
Consumer preferences are shifting towards healthier, ethically sourced products. This is evident in the growing demand for organic, non-GMO, and sustainably produced nuts and seeds. Competitive dynamics are shaped by factors such as pricing pressures, innovation, branding, and distribution channels. The industry's strong growth prospects are threatened by factors like fluctuating raw material prices, climate change impacts on crop yields, and potential supply chain disruptions.
Dominant Markets & Segments in Nuts and Seeds Industry
The North American region currently dominates the global nuts and seeds market, followed by Europe and Asia-Pacific. Within North America, the United States holds the largest market share due to high consumption rates and a well-established distribution network.
Key drivers for regional dominance include:
- Strong Consumer Demand: High per capita consumption of nuts and seeds, driven by health-conscious lifestyles and readily available products.
- Robust Infrastructure: Efficient supply chains, processing facilities, and distribution networks support market growth.
- Favorable Economic Conditions: High disposable incomes and a large consumer base create strong market demand.
In terms of product type, nuts currently hold a larger market share than seeds, with almonds, cashews, and walnuts being the most popular varieties. The whole nuts segment dominates in terms of form, followed by pieces and powdered forms. Food and beverage applications account for the largest share of overall consumption, with significant demand from the bakery and confectionery, snack bar, and breakfast cereal industries. Packaged nuts & seeds and trail mixes are leading retail segments. The industrial segment is experiencing significant growth, especially within the dairy and dairy alternative industry.
Nuts and Seeds Industry Product Developments
Recent product innovations focus on convenience, health, and sustainability. Powdered nut butters, such as PB2 Cashew Powder, cater to the growing demand for low-calorie, high-protein options. The development of almond powder and almond oil products expands the applications of almonds beyond whole nuts. These innovations reflect industry trends toward healthier ingredients and increased convenience, and cater to the growing demand for versatile and easily incorporated nut and seed products within a wide range of applications.
Report Scope & Segmentation Analysis
This report comprehensively segments the nuts and seeds market based on Product Type (Nuts, Seeds), Form (Whole, Pieces & Powdered, Oils, Other Forms), and Application (Food and Beverages, Industrial, Retail). Each segment's growth projection, market size (in Millions), and competitive dynamics are analyzed. For example, the Food and Beverage application segment is expected to experience robust growth, driven by increasing demand from the snack food and confectionery industries. Conversely, the Retail segment's growth is projected to be driven by the rise of health-conscious consumers seeking convenient and nutritious snacking options.
Key Drivers of Nuts and Seeds Industry Growth
The nuts and seeds industry's growth is propelled by several key factors. Rising consumer awareness of the health benefits of nuts and seeds (e.g., high protein, fiber, and healthy fats) is fueling demand. The increasing prevalence of health-conscious lifestyles and the growth of the vegan and vegetarian population contributes to this trend. Technological advancements in processing and packaging are enhancing product quality and shelf life, leading to increased market accessibility.
Challenges in the Nuts and Seeds Industry Sector
The industry faces several challenges, including fluctuating raw material prices due to weather patterns and global supply chain vulnerabilities. Regulatory hurdles related to food safety and labeling add to the complexity of operations. Intense competition from other snack food categories and substitute ingredients creates pressure on pricing and margins. These factors combine to create substantial risk in the growth and stability of the nuts and seeds industry.
Emerging Opportunities in Nuts and Seeds Industry
The industry presents significant emerging opportunities. The growing demand for functional foods and nutraceuticals opens avenues for innovative product development. Expansion into new markets, particularly in developing economies, presents substantial growth potential. Exploring new applications in areas such as pharmaceuticals and cosmetics offers diversification and revenue streams. Leveraging technological advancements, such as personalized nutrition and precision agriculture, offers opportunities for improved sustainability and efficiency.
Leading Players in the Nuts and Seeds Industry Market
- Food Specialities Limited
- American Nuts LLC
- Nuts.com
- The Wonderful Company LLC
- Select Harvests Limited
- Archer Daniels Midland Company
- Cargill Inc
- Olam Group
- HBS Foods Ltd
- Kanegrade Ltd
Key Developments in Nuts and Seeds Industry Industry
- March 2022: PB2 Foods launched PB2 Cashew Powder, a non-GMO, kosher, vegan, and gluten-free product. This launch expands the powdered nut butter market and caters to health-conscious consumers.
- February 2022: Olam Nuts partnered with Adobe Inc. to implement a digital strategy, enabling them to efficiently supply smaller volumes to businesses like bakeries and caterers. This illustrates the industry's adoption of digital technologies to improve efficiency and reach smaller clients.
- September 2020: Harris Woolf Almonds launched almond powder and almond oil products, expanding the applications of almonds and highlighting the market's drive towards ingredient diversification.
Strategic Outlook for Nuts and Seeds Industry Market
The nuts and seeds industry is poised for continued growth, driven by increasing health awareness, evolving consumer preferences, and technological advancements. Opportunities exist in expanding into new product formats, leveraging sustainable sourcing practices, and exploring innovative applications. Strategic partnerships and investments in research and development will be crucial for maintaining competitiveness and capitalizing on emerging market trends. The long-term outlook for the industry remains positive, with substantial potential for growth and expansion.
Nuts and Seeds Industry Segmentation
-
1. Product Type
- 1.1. Nuts
- 1.2. Seeds
-
2. Form
- 2.1. Whole
- 2.2. Pieces & Powdered
- 2.3. Oils
- 2.4. Other Forms
-
3. Application
-
3.1. Food and Beverages
-
3.1.1. Industrial
- 3.1.1.1. Bakery and Confectionery
- 3.1.1.2. Dairy & Dairy Alternatives
- 3.1.1.3. Edible Oils
- 3.1.1.4. Snack Bars
- 3.1.1.5. Breakfast Cereals
- 3.1.1.6. Others
-
3.1.2. Retail
- 3.1.2.1. Packaged Nuts & Seeds
- 3.1.2.2. Trail Mixes
-
3.1.1. Industrial
- 3.2. Pharmaceutical
- 3.3. Cosmetics & Personal Care
- 3.4. Other Applications
-
3.1. Food and Beverages
Nuts and Seeds Industry Segmentation By Geography
-
1. North America
- 1.1. United States
- 1.2. Canada
- 1.3. Mexico
- 1.4. Rest of North America
-
2. Europe
- 2.1. United Kingdom
- 2.2. Germany
- 2.3. Spain
- 2.4. France
- 2.5. Italy
- 2.6. Russia
- 2.7. Rest of Europe
-
3. Asia Pacific
- 3.1. China
- 3.2. Japan
- 3.3. India
- 3.4. Australia
- 3.5. Rest of Asia Pacific
-
4. South America
- 4.1. Brazil
- 4.2. Argentina
- 4.3. Rest of South America
- 5. Middle East
-
6. United Arab Emirates
- 6.1. South Africa
- 6.2. Rest of Middle East
Nuts and Seeds Industry REPORT HIGHLIGHTS
| Aspects | Details |
|---|---|
| Study Period | 2019-2033 |
| Base Year | 2024 |
| Estimated Year | 2025 |
| Forecast Period | 2025-2033 |
| Historical Period | 2019-2024 |
| Growth Rate | CAGR of 5.87% from 2019-2033 |
| Segmentation |
|
Table of Contents
- 1. Introduction
- 1.1. Research Scope
- 1.2. Market Segmentation
- 1.3. Research Methodology
- 1.4. Definitions and Assumptions
- 2. Executive Summary
- 2.1. Introduction
- 3. Market Dynamics
- 3.1. Introduction
- 3.2. Market Drivers
- 3.2.1. Increasing Demand For Convenience & Processed Food
- 3.3. Market Restrains
- 3.3.1. Increased Consumer Awareness On Side-Effects Of Chemical Additives
- 3.4. Market Trends
- 3.4.1. Increasing Healthy Snack Demand is Fostering the Nuts and Seeds Market
- 4. Market Factor Analysis
- 4.1. Porters Five Forces
- 4.2. Supply/Value Chain
- 4.3. PESTEL analysis
- 4.4. Market Entropy
- 4.5. Patent/Trademark Analysis
- 5. Global Nuts and Seeds Industry Analysis, Insights and Forecast, 2019-2031
- 5.1. Market Analysis, Insights and Forecast - by Product Type
- 5.1.1. Nuts
- 5.1.2. Seeds
- 5.2. Market Analysis, Insights and Forecast - by Form
- 5.2.1. Whole
- 5.2.2. Pieces & Powdered
- 5.2.3. Oils
- 5.2.4. Other Forms
- 5.3. Market Analysis, Insights and Forecast - by Application
- 5.3.1. Food and Beverages
- 5.3.1.1. Industrial
- 5.3.1.1.1. Bakery and Confectionery
- 5.3.1.1.2. Dairy & Dairy Alternatives
- 5.3.1.1.3. Edible Oils
- 5.3.1.1.4. Snack Bars
- 5.3.1.1.5. Breakfast Cereals
- 5.3.1.1.6. Others
- 5.3.1.2. Retail
- 5.3.1.2.1. Packaged Nuts & Seeds
- 5.3.1.2.2. Trail Mixes
- 5.3.1.1. Industrial
- 5.3.2. Pharmaceutical
- 5.3.3. Cosmetics & Personal Care
- 5.3.4. Other Applications
- 5.3.1. Food and Beverages
- 5.4. Market Analysis, Insights and Forecast - by Region
- 5.4.1. North America
- 5.4.2. Europe
- 5.4.3. Asia Pacific
- 5.4.4. South America
- 5.4.5. Middle East
- 5.4.6. United Arab Emirates
- 5.1. Market Analysis, Insights and Forecast - by Product Type
- 6. North America Nuts and Seeds Industry Analysis, Insights and Forecast, 2019-2031
- 6.1. Market Analysis, Insights and Forecast - by Product Type
- 6.1.1. Nuts
- 6.1.2. Seeds
- 6.2. Market Analysis, Insights and Forecast - by Form
- 6.2.1. Whole
- 6.2.2. Pieces & Powdered
- 6.2.3. Oils
- 6.2.4. Other Forms
- 6.3. Market Analysis, Insights and Forecast - by Application
- 6.3.1. Food and Beverages
- 6.3.1.1. Industrial
- 6.3.1.1.1. Bakery and Confectionery
- 6.3.1.1.2. Dairy & Dairy Alternatives
- 6.3.1.1.3. Edible Oils
- 6.3.1.1.4. Snack Bars
- 6.3.1.1.5. Breakfast Cereals
- 6.3.1.1.6. Others
- 6.3.1.2. Retail
- 6.3.1.2.1. Packaged Nuts & Seeds
- 6.3.1.2.2. Trail Mixes
- 6.3.1.1. Industrial
- 6.3.2. Pharmaceutical
- 6.3.3. Cosmetics & Personal Care
- 6.3.4. Other Applications
- 6.3.1. Food and Beverages
- 6.1. Market Analysis, Insights and Forecast - by Product Type
- 7. Europe Nuts and Seeds Industry Analysis, Insights and Forecast, 2019-2031
- 7.1. Market Analysis, Insights and Forecast - by Product Type
- 7.1.1. Nuts
- 7.1.2. Seeds
- 7.2. Market Analysis, Insights and Forecast - by Form
- 7.2.1. Whole
- 7.2.2. Pieces & Powdered
- 7.2.3. Oils
- 7.2.4. Other Forms
- 7.3. Market Analysis, Insights and Forecast - by Application
- 7.3.1. Food and Beverages
- 7.3.1.1. Industrial
- 7.3.1.1.1. Bakery and Confectionery
- 7.3.1.1.2. Dairy & Dairy Alternatives
- 7.3.1.1.3. Edible Oils
- 7.3.1.1.4. Snack Bars
- 7.3.1.1.5. Breakfast Cereals
- 7.3.1.1.6. Others
- 7.3.1.2. Retail
- 7.3.1.2.1. Packaged Nuts & Seeds
- 7.3.1.2.2. Trail Mixes
- 7.3.1.1. Industrial
- 7.3.2. Pharmaceutical
- 7.3.3. Cosmetics & Personal Care
- 7.3.4. Other Applications
- 7.3.1. Food and Beverages
- 7.1. Market Analysis, Insights and Forecast - by Product Type
- 8. Asia Pacific Nuts and Seeds Industry Analysis, Insights and Forecast, 2019-2031
- 8.1. Market Analysis, Insights and Forecast - by Product Type
- 8.1.1. Nuts
- 8.1.2. Seeds
- 8.2. Market Analysis, Insights and Forecast - by Form
- 8.2.1. Whole
- 8.2.2. Pieces & Powdered
- 8.2.3. Oils
- 8.2.4. Other Forms
- 8.3. Market Analysis, Insights and Forecast - by Application
- 8.3.1. Food and Beverages
- 8.3.1.1. Industrial
- 8.3.1.1.1. Bakery and Confectionery
- 8.3.1.1.2. Dairy & Dairy Alternatives
- 8.3.1.1.3. Edible Oils
- 8.3.1.1.4. Snack Bars
- 8.3.1.1.5. Breakfast Cereals
- 8.3.1.1.6. Others
- 8.3.1.2. Retail
- 8.3.1.2.1. Packaged Nuts & Seeds
- 8.3.1.2.2. Trail Mixes
- 8.3.1.1. Industrial
- 8.3.2. Pharmaceutical
- 8.3.3. Cosmetics & Personal Care
- 8.3.4. Other Applications
- 8.3.1. Food and Beverages
- 8.1. Market Analysis, Insights and Forecast - by Product Type
- 9. South America Nuts and Seeds Industry Analysis, Insights and Forecast, 2019-2031
- 9.1. Market Analysis, Insights and Forecast - by Product Type
- 9.1.1. Nuts
- 9.1.2. Seeds
- 9.2. Market Analysis, Insights and Forecast - by Form
- 9.2.1. Whole
- 9.2.2. Pieces & Powdered
- 9.2.3. Oils
- 9.2.4. Other Forms
- 9.3. Market Analysis, Insights and Forecast - by Application
- 9.3.1. Food and Beverages
- 9.3.1.1. Industrial
- 9.3.1.1.1. Bakery and Confectionery
- 9.3.1.1.2. Dairy & Dairy Alternatives
- 9.3.1.1.3. Edible Oils
- 9.3.1.1.4. Snack Bars
- 9.3.1.1.5. Breakfast Cereals
- 9.3.1.1.6. Others
- 9.3.1.2. Retail
- 9.3.1.2.1. Packaged Nuts & Seeds
- 9.3.1.2.2. Trail Mixes
- 9.3.1.1. Industrial
- 9.3.2. Pharmaceutical
- 9.3.3. Cosmetics & Personal Care
- 9.3.4. Other Applications
- 9.3.1. Food and Beverages
- 9.1. Market Analysis, Insights and Forecast - by Product Type
- 10. Middle East Nuts and Seeds Industry Analysis, Insights and Forecast, 2019-2031
- 10.1. Market Analysis, Insights and Forecast - by Product Type
- 10.1.1. Nuts
- 10.1.2. Seeds
- 10.2. Market Analysis, Insights and Forecast - by Form
- 10.2.1. Whole
- 10.2.2. Pieces & Powdered
- 10.2.3. Oils
- 10.2.4. Other Forms
- 10.3. Market Analysis, Insights and Forecast - by Application
- 10.3.1. Food and Beverages
- 10.3.1.1. Industrial
- 10.3.1.1.1. Bakery and Confectionery
- 10.3.1.1.2. Dairy & Dairy Alternatives
- 10.3.1.1.3. Edible Oils
- 10.3.1.1.4. Snack Bars
- 10.3.1.1.5. Breakfast Cereals
- 10.3.1.1.6. Others
- 10.3.1.2. Retail
- 10.3.1.2.1. Packaged Nuts & Seeds
- 10.3.1.2.2. Trail Mixes
- 10.3.1.1. Industrial
- 10.3.2. Pharmaceutical
- 10.3.3. Cosmetics & Personal Care
- 10.3.4. Other Applications
- 10.3.1. Food and Beverages
- 10.1. Market Analysis, Insights and Forecast - by Product Type
- 11. United Arab Emirates Nuts and Seeds Industry Analysis, Insights and Forecast, 2019-2031
- 11.1. Market Analysis, Insights and Forecast - by Product Type
- 11.1.1. Nuts
- 11.1.2. Seeds
- 11.2. Market Analysis, Insights and Forecast - by Form
- 11.2.1. Whole
- 11.2.2. Pieces & Powdered
- 11.2.3. Oils
- 11.2.4. Other Forms
- 11.3. Market Analysis, Insights and Forecast - by Application
- 11.3.1. Food and Beverages
- 11.3.1.1. Industrial
- 11.3.1.1.1. Bakery and Confectionery
- 11.3.1.1.2. Dairy & Dairy Alternatives
- 11.3.1.1.3. Edible Oils
- 11.3.1.1.4. Snack Bars
- 11.3.1.1.5. Breakfast Cereals
- 11.3.1.1.6. Others
- 11.3.1.2. Retail
- 11.3.1.2.1. Packaged Nuts & Seeds
- 11.3.1.2.2. Trail Mixes
- 11.3.1.1. Industrial
- 11.3.2. Pharmaceutical
- 11.3.3. Cosmetics & Personal Care
- 11.3.4. Other Applications
- 11.3.1. Food and Beverages
- 11.1. Market Analysis, Insights and Forecast - by Product Type
- 12. North America Nuts and Seeds Industry Analysis, Insights and Forecast, 2019-2031
- 12.1. Market Analysis, Insights and Forecast - By Country/Sub-region
- 12.1.1 United States
- 12.1.2 Canada
- 12.1.3 Mexico
- 12.1.4 Rest of North America
- 13. Europe Nuts and Seeds Industry Analysis, Insights and Forecast, 2019-2031
- 13.1. Market Analysis, Insights and Forecast - By Country/Sub-region
- 13.1.1 United Kingdom
- 13.1.2 Germany
- 13.1.3 Spain
- 13.1.4 France
- 13.1.5 Italy
- 13.1.6 Russia
- 13.1.7 Rest of Europe
- 14. Asia Pacific Nuts and Seeds Industry Analysis, Insights and Forecast, 2019-2031
- 14.1. Market Analysis, Insights and Forecast - By Country/Sub-region
- 14.1.1 China
- 14.1.2 Japan
- 14.1.3 India
- 14.1.4 Australia
- 14.1.5 Rest of Asia Pacific
- 15. South America Nuts and Seeds Industry Analysis, Insights and Forecast, 2019-2031
- 15.1. Market Analysis, Insights and Forecast - By Country/Sub-region
- 15.1.1 Brazil
- 15.1.2 Argentina
- 15.1.3 Rest of South America
- 16. Middle East & Africa Nuts and Seeds Industry Analysis, Insights and Forecast, 2019-2031
- 16.1. Market Analysis, Insights and Forecast - By Country/Sub-region
- 16.1.1 UAE
- 16.1.2 South Africa
- 16.1.3 Saudi Arabia
- 16.1.4 Rest of MEA
- 17. United Arab Emirates Nuts and Seeds Industry Analysis, Insights and Forecast, 2019-2031
- 17.1. Market Analysis, Insights and Forecast - By Country/Sub-region
- 17.1.1 South Africa
- 17.1.2 Rest of Middle East
- 18. Competitive Analysis
- 18.1. Global Market Share Analysis 2024
- 18.2. Company Profiles
- 18.2.1 Food Specialities Limited *List Not Exhaustive
- 18.2.1.1. Overview
- 18.2.1.2. Products
- 18.2.1.3. SWOT Analysis
- 18.2.1.4. Recent Developments
- 18.2.1.5. Financials (Based on Availability)
- 18.2.2 American Nuts LLC
- 18.2.2.1. Overview
- 18.2.2.2. Products
- 18.2.2.3. SWOT Analysis
- 18.2.2.4. Recent Developments
- 18.2.2.5. Financials (Based on Availability)
- 18.2.3 Nuts com
- 18.2.3.1. Overview
- 18.2.3.2. Products
- 18.2.3.3. SWOT Analysis
- 18.2.3.4. Recent Developments
- 18.2.3.5. Financials (Based on Availability)
- 18.2.4 The Wonderful Company LLC
- 18.2.4.1. Overview
- 18.2.4.2. Products
- 18.2.4.3. SWOT Analysis
- 18.2.4.4. Recent Developments
- 18.2.4.5. Financials (Based on Availability)
- 18.2.5 Select Harvests Limited
- 18.2.5.1. Overview
- 18.2.5.2. Products
- 18.2.5.3. SWOT Analysis
- 18.2.5.4. Recent Developments
- 18.2.5.5. Financials (Based on Availability)
- 18.2.6 Archer Daniels Midland Company
- 18.2.6.1. Overview
- 18.2.6.2. Products
- 18.2.6.3. SWOT Analysis
- 18.2.6.4. Recent Developments
- 18.2.6.5. Financials (Based on Availability)
- 18.2.7 Cargill Inc
- 18.2.7.1. Overview
- 18.2.7.2. Products
- 18.2.7.3. SWOT Analysis
- 18.2.7.4. Recent Developments
- 18.2.7.5. Financials (Based on Availability)
- 18.2.8 Olam Group
- 18.2.8.1. Overview
- 18.2.8.2. Products
- 18.2.8.3. SWOT Analysis
- 18.2.8.4. Recent Developments
- 18.2.8.5. Financials (Based on Availability)
- 18.2.9 HBS Foods Ltd
- 18.2.9.1. Overview
- 18.2.9.2. Products
- 18.2.9.3. SWOT Analysis
- 18.2.9.4. Recent Developments
- 18.2.9.5. Financials (Based on Availability)
- 18.2.10 Kanegrade Ltd
- 18.2.10.1. Overview
- 18.2.10.2. Products
- 18.2.10.3. SWOT Analysis
- 18.2.10.4. Recent Developments
- 18.2.10.5. Financials (Based on Availability)
- 18.2.1 Food Specialities Limited *List Not Exhaustive
List of Figures
- Figure 1: Global Nuts and Seeds Industry Revenue Breakdown (Million, %) by Region 2024 & 2032
- Figure 2: Global Nuts and Seeds Industry Volume Breakdown (K Tons, %) by Region 2024 & 2032
- Figure 3: North America Nuts and Seeds Industry Revenue (Million), by Country 2024 & 2032
- Figure 4: North America Nuts and Seeds Industry Volume (K Tons), by Country 2024 & 2032
- Figure 5: North America Nuts and Seeds Industry Revenue Share (%), by Country 2024 & 2032
- Figure 6: North America Nuts and Seeds Industry Volume Share (%), by Country 2024 & 2032
- Figure 7: Europe Nuts and Seeds Industry Revenue (Million), by Country 2024 & 2032
- Figure 8: Europe Nuts and Seeds Industry Volume (K Tons), by Country 2024 & 2032
- Figure 9: Europe Nuts and Seeds Industry Revenue Share (%), by Country 2024 & 2032
- Figure 10: Europe Nuts and Seeds Industry Volume Share (%), by Country 2024 & 2032
- Figure 11: Asia Pacific Nuts and Seeds Industry Revenue (Million), by Country 2024 & 2032
- Figure 12: Asia Pacific Nuts and Seeds Industry Volume (K Tons), by Country 2024 & 2032
- Figure 13: Asia Pacific Nuts and Seeds Industry Revenue Share (%), by Country 2024 & 2032
- Figure 14: Asia Pacific Nuts and Seeds Industry Volume Share (%), by Country 2024 & 2032
- Figure 15: South America Nuts and Seeds Industry Revenue (Million), by Country 2024 & 2032
- Figure 16: South America Nuts and Seeds Industry Volume (K Tons), by Country 2024 & 2032
- Figure 17: South America Nuts and Seeds Industry Revenue Share (%), by Country 2024 & 2032
- Figure 18: South America Nuts and Seeds Industry Volume Share (%), by Country 2024 & 2032
- Figure 19: Middle East & Africa Nuts and Seeds Industry Revenue (Million), by Country 2024 & 2032
- Figure 20: Middle East & Africa Nuts and Seeds Industry Volume (K Tons), by Country 2024 & 2032
- Figure 21: Middle East & Africa Nuts and Seeds Industry Revenue Share (%), by Country 2024 & 2032
- Figure 22: Middle East & Africa Nuts and Seeds Industry Volume Share (%), by Country 2024 & 2032
- Figure 23: United Arab Emirates Nuts and Seeds Industry Revenue (Million), by Country 2024 & 2032
- Figure 24: United Arab Emirates Nuts and Seeds Industry Volume (K Tons), by Country 2024 & 2032
- Figure 25: United Arab Emirates Nuts and Seeds Industry Revenue Share (%), by Country 2024 & 2032
- Figure 26: United Arab Emirates Nuts and Seeds Industry Volume Share (%), by Country 2024 & 2032
- Figure 27: North America Nuts and Seeds Industry Revenue (Million), by Product Type 2024 & 2032
- Figure 28: North America Nuts and Seeds Industry Volume (K Tons), by Product Type 2024 & 2032
- Figure 29: North America Nuts and Seeds Industry Revenue Share (%), by Product Type 2024 & 2032
- Figure 30: North America Nuts and Seeds Industry Volume Share (%), by Product Type 2024 & 2032
- Figure 31: North America Nuts and Seeds Industry Revenue (Million), by Form 2024 & 2032
- Figure 32: North America Nuts and Seeds Industry Volume (K Tons), by Form 2024 & 2032
- Figure 33: North America Nuts and Seeds Industry Revenue Share (%), by Form 2024 & 2032
- Figure 34: North America Nuts and Seeds Industry Volume Share (%), by Form 2024 & 2032
- Figure 35: North America Nuts and Seeds Industry Revenue (Million), by Application 2024 & 2032
- Figure 36: North America Nuts and Seeds Industry Volume (K Tons), by Application 2024 & 2032
- Figure 37: North America Nuts and Seeds Industry Revenue Share (%), by Application 2024 & 2032
- Figure 38: North America Nuts and Seeds Industry Volume Share (%), by Application 2024 & 2032
- Figure 39: North America Nuts and Seeds Industry Revenue (Million), by Country 2024 & 2032
- Figure 40: North America Nuts and Seeds Industry Volume (K Tons), by Country 2024 & 2032
- Figure 41: North America Nuts and Seeds Industry Revenue Share (%), by Country 2024 & 2032
- Figure 42: North America Nuts and Seeds Industry Volume Share (%), by Country 2024 & 2032
- Figure 43: Europe Nuts and Seeds Industry Revenue (Million), by Product Type 2024 & 2032
- Figure 44: Europe Nuts and Seeds Industry Volume (K Tons), by Product Type 2024 & 2032
- Figure 45: Europe Nuts and Seeds Industry Revenue Share (%), by Product Type 2024 & 2032
- Figure 46: Europe Nuts and Seeds Industry Volume Share (%), by Product Type 2024 & 2032
- Figure 47: Europe Nuts and Seeds Industry Revenue (Million), by Form 2024 & 2032
- Figure 48: Europe Nuts and Seeds Industry Volume (K Tons), by Form 2024 & 2032
- Figure 49: Europe Nuts and Seeds Industry Revenue Share (%), by Form 2024 & 2032
- Figure 50: Europe Nuts and Seeds Industry Volume Share (%), by Form 2024 & 2032
- Figure 51: Europe Nuts and Seeds Industry Revenue (Million), by Application 2024 & 2032
- Figure 52: Europe Nuts and Seeds Industry Volume (K Tons), by Application 2024 & 2032
- Figure 53: Europe Nuts and Seeds Industry Revenue Share (%), by Application 2024 & 2032
- Figure 54: Europe Nuts and Seeds Industry Volume Share (%), by Application 2024 & 2032
- Figure 55: Europe Nuts and Seeds Industry Revenue (Million), by Country 2024 & 2032
- Figure 56: Europe Nuts and Seeds Industry Volume (K Tons), by Country 2024 & 2032
- Figure 57: Europe Nuts and Seeds Industry Revenue Share (%), by Country 2024 & 2032
- Figure 58: Europe Nuts and Seeds Industry Volume Share (%), by Country 2024 & 2032
- Figure 59: Asia Pacific Nuts and Seeds Industry Revenue (Million), by Product Type 2024 & 2032
- Figure 60: Asia Pacific Nuts and Seeds Industry Volume (K Tons), by Product Type 2024 & 2032
- Figure 61: Asia Pacific Nuts and Seeds Industry Revenue Share (%), by Product Type 2024 & 2032
- Figure 62: Asia Pacific Nuts and Seeds Industry Volume Share (%), by Product Type 2024 & 2032
- Figure 63: Asia Pacific Nuts and Seeds Industry Revenue (Million), by Form 2024 & 2032
- Figure 64: Asia Pacific Nuts and Seeds Industry Volume (K Tons), by Form 2024 & 2032
- Figure 65: Asia Pacific Nuts and Seeds Industry Revenue Share (%), by Form 2024 & 2032
- Figure 66: Asia Pacific Nuts and Seeds Industry Volume Share (%), by Form 2024 & 2032
- Figure 67: Asia Pacific Nuts and Seeds Industry Revenue (Million), by Application 2024 & 2032
- Figure 68: Asia Pacific Nuts and Seeds Industry Volume (K Tons), by Application 2024 & 2032
- Figure 69: Asia Pacific Nuts and Seeds Industry Revenue Share (%), by Application 2024 & 2032
- Figure 70: Asia Pacific Nuts and Seeds Industry Volume Share (%), by Application 2024 & 2032
- Figure 71: Asia Pacific Nuts and Seeds Industry Revenue (Million), by Country 2024 & 2032
- Figure 72: Asia Pacific Nuts and Seeds Industry Volume (K Tons), by Country 2024 & 2032
- Figure 73: Asia Pacific Nuts and Seeds Industry Revenue Share (%), by Country 2024 & 2032
- Figure 74: Asia Pacific Nuts and Seeds Industry Volume Share (%), by Country 2024 & 2032
- Figure 75: South America Nuts and Seeds Industry Revenue (Million), by Product Type 2024 & 2032
- Figure 76: South America Nuts and Seeds Industry Volume (K Tons), by Product Type 2024 & 2032
- Figure 77: South America Nuts and Seeds Industry Revenue Share (%), by Product Type 2024 & 2032
- Figure 78: South America Nuts and Seeds Industry Volume Share (%), by Product Type 2024 & 2032
- Figure 79: South America Nuts and Seeds Industry Revenue (Million), by Form 2024 & 2032
- Figure 80: South America Nuts and Seeds Industry Volume (K Tons), by Form 2024 & 2032
- Figure 81: South America Nuts and Seeds Industry Revenue Share (%), by Form 2024 & 2032
- Figure 82: South America Nuts and Seeds Industry Volume Share (%), by Form 2024 & 2032
- Figure 83: South America Nuts and Seeds Industry Revenue (Million), by Application 2024 & 2032
- Figure 84: South America Nuts and Seeds Industry Volume (K Tons), by Application 2024 & 2032
- Figure 85: South America Nuts and Seeds Industry Revenue Share (%), by Application 2024 & 2032
- Figure 86: South America Nuts and Seeds Industry Volume Share (%), by Application 2024 & 2032
- Figure 87: South America Nuts and Seeds Industry Revenue (Million), by Country 2024 & 2032
- Figure 88: South America Nuts and Seeds Industry Volume (K Tons), by Country 2024 & 2032
- Figure 89: South America Nuts and Seeds Industry Revenue Share (%), by Country 2024 & 2032
- Figure 90: South America Nuts and Seeds Industry Volume Share (%), by Country 2024 & 2032
- Figure 91: Middle East Nuts and Seeds Industry Revenue (Million), by Product Type 2024 & 2032
- Figure 92: Middle East Nuts and Seeds Industry Volume (K Tons), by Product Type 2024 & 2032
- Figure 93: Middle East Nuts and Seeds Industry Revenue Share (%), by Product Type 2024 & 2032
- Figure 94: Middle East Nuts and Seeds Industry Volume Share (%), by Product Type 2024 & 2032
- Figure 95: Middle East Nuts and Seeds Industry Revenue (Million), by Form 2024 & 2032
- Figure 96: Middle East Nuts and Seeds Industry Volume (K Tons), by Form 2024 & 2032
- Figure 97: Middle East Nuts and Seeds Industry Revenue Share (%), by Form 2024 & 2032
- Figure 98: Middle East Nuts and Seeds Industry Volume Share (%), by Form 2024 & 2032
- Figure 99: Middle East Nuts and Seeds Industry Revenue (Million), by Application 2024 & 2032
- Figure 100: Middle East Nuts and Seeds Industry Volume (K Tons), by Application 2024 & 2032
- Figure 101: Middle East Nuts and Seeds Industry Revenue Share (%), by Application 2024 & 2032
- Figure 102: Middle East Nuts and Seeds Industry Volume Share (%), by Application 2024 & 2032
- Figure 103: Middle East Nuts and Seeds Industry Revenue (Million), by Country 2024 & 2032
- Figure 104: Middle East Nuts and Seeds Industry Volume (K Tons), by Country 2024 & 2032
- Figure 105: Middle East Nuts and Seeds Industry Revenue Share (%), by Country 2024 & 2032
- Figure 106: Middle East Nuts and Seeds Industry Volume Share (%), by Country 2024 & 2032
- Figure 107: United Arab Emirates Nuts and Seeds Industry Revenue (Million), by Product Type 2024 & 2032
- Figure 108: United Arab Emirates Nuts and Seeds Industry Volume (K Tons), by Product Type 2024 & 2032
- Figure 109: United Arab Emirates Nuts and Seeds Industry Revenue Share (%), by Product Type 2024 & 2032
- Figure 110: United Arab Emirates Nuts and Seeds Industry Volume Share (%), by Product Type 2024 & 2032
- Figure 111: United Arab Emirates Nuts and Seeds Industry Revenue (Million), by Form 2024 & 2032
- Figure 112: United Arab Emirates Nuts and Seeds Industry Volume (K Tons), by Form 2024 & 2032
- Figure 113: United Arab Emirates Nuts and Seeds Industry Revenue Share (%), by Form 2024 & 2032
- Figure 114: United Arab Emirates Nuts and Seeds Industry Volume Share (%), by Form 2024 & 2032
- Figure 115: United Arab Emirates Nuts and Seeds Industry Revenue (Million), by Application 2024 & 2032
- Figure 116: United Arab Emirates Nuts and Seeds Industry Volume (K Tons), by Application 2024 & 2032
- Figure 117: United Arab Emirates Nuts and Seeds Industry Revenue Share (%), by Application 2024 & 2032
- Figure 118: United Arab Emirates Nuts and Seeds Industry Volume Share (%), by Application 2024 & 2032
- Figure 119: United Arab Emirates Nuts and Seeds Industry Revenue (Million), by Country 2024 & 2032
- Figure 120: United Arab Emirates Nuts and Seeds Industry Volume (K Tons), by Country 2024 & 2032
- Figure 121: United Arab Emirates Nuts and Seeds Industry Revenue Share (%), by Country 2024 & 2032
- Figure 122: United Arab Emirates Nuts and Seeds Industry Volume Share (%), by Country 2024 & 2032
List of Tables
- Table 1: Global Nuts and Seeds Industry Revenue Million Forecast, by Region 2019 & 2032
- Table 2: Global Nuts and Seeds Industry Volume K Tons Forecast, by Region 2019 & 2032
- Table 3: Global Nuts and Seeds Industry Revenue Million Forecast, by Product Type 2019 & 2032
- Table 4: Global Nuts and Seeds Industry Volume K Tons Forecast, by Product Type 2019 & 2032
- Table 5: Global Nuts and Seeds Industry Revenue Million Forecast, by Form 2019 & 2032
- Table 6: Global Nuts and Seeds Industry Volume K Tons Forecast, by Form 2019 & 2032
- Table 7: Global Nuts and Seeds Industry Revenue Million Forecast, by Application 2019 & 2032
- Table 8: Global Nuts and Seeds Industry Volume K Tons Forecast, by Application 2019 & 2032
- Table 9: Global Nuts and Seeds Industry Revenue Million Forecast, by Region 2019 & 2032
- Table 10: Global Nuts and Seeds Industry Volume K Tons Forecast, by Region 2019 & 2032
- Table 11: Global Nuts and Seeds Industry Revenue Million Forecast, by Country 2019 & 2032
- Table 12: Global Nuts and Seeds Industry Volume K Tons Forecast, by Country 2019 & 2032
- Table 13: United States Nuts and Seeds Industry Revenue (Million) Forecast, by Application 2019 & 2032
- Table 14: United States Nuts and Seeds Industry Volume (K Tons) Forecast, by Application 2019 & 2032
- Table 15: Canada Nuts and Seeds Industry Revenue (Million) Forecast, by Application 2019 & 2032
- Table 16: Canada Nuts and Seeds Industry Volume (K Tons) Forecast, by Application 2019 & 2032
- Table 17: Mexico Nuts and Seeds Industry Revenue (Million) Forecast, by Application 2019 & 2032
- Table 18: Mexico Nuts and Seeds Industry Volume (K Tons) Forecast, by Application 2019 & 2032
- Table 19: Rest of North America Nuts and Seeds Industry Revenue (Million) Forecast, by Application 2019 & 2032
- Table 20: Rest of North America Nuts and Seeds Industry Volume (K Tons) Forecast, by Application 2019 & 2032
- Table 21: Global Nuts and Seeds Industry Revenue Million Forecast, by Country 2019 & 2032
- Table 22: Global Nuts and Seeds Industry Volume K Tons Forecast, by Country 2019 & 2032
- Table 23: United Kingdom Nuts and Seeds Industry Revenue (Million) Forecast, by Application 2019 & 2032
- Table 24: United Kingdom Nuts and Seeds Industry Volume (K Tons) Forecast, by Application 2019 & 2032
- Table 25: Germany Nuts and Seeds Industry Revenue (Million) Forecast, by Application 2019 & 2032
- Table 26: Germany Nuts and Seeds Industry Volume (K Tons) Forecast, by Application 2019 & 2032
- Table 27: Spain Nuts and Seeds Industry Revenue (Million) Forecast, by Application 2019 & 2032
- Table 28: Spain Nuts and Seeds Industry Volume (K Tons) Forecast, by Application 2019 & 2032
- Table 29: France Nuts and Seeds Industry Revenue (Million) Forecast, by Application 2019 & 2032
- Table 30: France Nuts and Seeds Industry Volume (K Tons) Forecast, by Application 2019 & 2032
- Table 31: Italy Nuts and Seeds Industry Revenue (Million) Forecast, by Application 2019 & 2032
- Table 32: Italy Nuts and Seeds Industry Volume (K Tons) Forecast, by Application 2019 & 2032
- Table 33: Russia Nuts and Seeds Industry Revenue (Million) Forecast, by Application 2019 & 2032
- Table 34: Russia Nuts and Seeds Industry Volume (K Tons) Forecast, by Application 2019 & 2032
- Table 35: Rest of Europe Nuts and Seeds Industry Revenue (Million) Forecast, by Application 2019 & 2032
- Table 36: Rest of Europe Nuts and Seeds Industry Volume (K Tons) Forecast, by Application 2019 & 2032
- Table 37: Global Nuts and Seeds Industry Revenue Million Forecast, by Country 2019 & 2032
- Table 38: Global Nuts and Seeds Industry Volume K Tons Forecast, by Country 2019 & 2032
- Table 39: China Nuts and Seeds Industry Revenue (Million) Forecast, by Application 2019 & 2032
- Table 40: China Nuts and Seeds Industry Volume (K Tons) Forecast, by Application 2019 & 2032
- Table 41: Japan Nuts and Seeds Industry Revenue (Million) Forecast, by Application 2019 & 2032
- Table 42: Japan Nuts and Seeds Industry Volume (K Tons) Forecast, by Application 2019 & 2032
- Table 43: India Nuts and Seeds Industry Revenue (Million) Forecast, by Application 2019 & 2032
- Table 44: India Nuts and Seeds Industry Volume (K Tons) Forecast, by Application 2019 & 2032
- Table 45: Australia Nuts and Seeds Industry Revenue (Million) Forecast, by Application 2019 & 2032
- Table 46: Australia Nuts and Seeds Industry Volume (K Tons) Forecast, by Application 2019 & 2032
- Table 47: Rest of Asia Pacific Nuts and Seeds Industry Revenue (Million) Forecast, by Application 2019 & 2032
- Table 48: Rest of Asia Pacific Nuts and Seeds Industry Volume (K Tons) Forecast, by Application 2019 & 2032
- Table 49: Global Nuts and Seeds Industry Revenue Million Forecast, by Country 2019 & 2032
- Table 50: Global Nuts and Seeds Industry Volume K Tons Forecast, by Country 2019 & 2032
- Table 51: Brazil Nuts and Seeds Industry Revenue (Million) Forecast, by Application 2019 & 2032
- Table 52: Brazil Nuts and Seeds Industry Volume (K Tons) Forecast, by Application 2019 & 2032
- Table 53: Argentina Nuts and Seeds Industry Revenue (Million) Forecast, by Application 2019 & 2032
- Table 54: Argentina Nuts and Seeds Industry Volume (K Tons) Forecast, by Application 2019 & 2032
- Table 55: Rest of South America Nuts and Seeds Industry Revenue (Million) Forecast, by Application 2019 & 2032
- Table 56: Rest of South America Nuts and Seeds Industry Volume (K Tons) Forecast, by Application 2019 & 2032
- Table 57: Global Nuts and Seeds Industry Revenue Million Forecast, by Country 2019 & 2032
- Table 58: Global Nuts and Seeds Industry Volume K Tons Forecast, by Country 2019 & 2032
- Table 59: UAE Nuts and Seeds Industry Revenue (Million) Forecast, by Application 2019 & 2032
- Table 60: UAE Nuts and Seeds Industry Volume (K Tons) Forecast, by Application 2019 & 2032
- Table 61: South Africa Nuts and Seeds Industry Revenue (Million) Forecast, by Application 2019 & 2032
- Table 62: South Africa Nuts and Seeds Industry Volume (K Tons) Forecast, by Application 2019 & 2032
- Table 63: Saudi Arabia Nuts and Seeds Industry Revenue (Million) Forecast, by Application 2019 & 2032
- Table 64: Saudi Arabia Nuts and Seeds Industry Volume (K Tons) Forecast, by Application 2019 & 2032
- Table 65: Rest of MEA Nuts and Seeds Industry Revenue (Million) Forecast, by Application 2019 & 2032
- Table 66: Rest of MEA Nuts and Seeds Industry Volume (K Tons) Forecast, by Application 2019 & 2032
- Table 67: Global Nuts and Seeds Industry Revenue Million Forecast, by Country 2019 & 2032
- Table 68: Global Nuts and Seeds Industry Volume K Tons Forecast, by Country 2019 & 2032
- Table 69: South Africa Nuts and Seeds Industry Revenue (Million) Forecast, by Application 2019 & 2032
- Table 70: South Africa Nuts and Seeds Industry Volume (K Tons) Forecast, by Application 2019 & 2032
- Table 71: Rest of Middle East Nuts and Seeds Industry Revenue (Million) Forecast, by Application 2019 & 2032
- Table 72: Rest of Middle East Nuts and Seeds Industry Volume (K Tons) Forecast, by Application 2019 & 2032
- Table 73: Global Nuts and Seeds Industry Revenue Million Forecast, by Product Type 2019 & 2032
- Table 74: Global Nuts and Seeds Industry Volume K Tons Forecast, by Product Type 2019 & 2032
- Table 75: Global Nuts and Seeds Industry Revenue Million Forecast, by Form 2019 & 2032
- Table 76: Global Nuts and Seeds Industry Volume K Tons Forecast, by Form 2019 & 2032
- Table 77: Global Nuts and Seeds Industry Revenue Million Forecast, by Application 2019 & 2032
- Table 78: Global Nuts and Seeds Industry Volume K Tons Forecast, by Application 2019 & 2032
- Table 79: Global Nuts and Seeds Industry Revenue Million Forecast, by Country 2019 & 2032
- Table 80: Global Nuts and Seeds Industry Volume K Tons Forecast, by Country 2019 & 2032
- Table 81: United States Nuts and Seeds Industry Revenue (Million) Forecast, by Application 2019 & 2032
- Table 82: United States Nuts and Seeds Industry Volume (K Tons) Forecast, by Application 2019 & 2032
- Table 83: Canada Nuts and Seeds Industry Revenue (Million) Forecast, by Application 2019 & 2032
- Table 84: Canada Nuts and Seeds Industry Volume (K Tons) Forecast, by Application 2019 & 2032
- Table 85: Mexico Nuts and Seeds Industry Revenue (Million) Forecast, by Application 2019 & 2032
- Table 86: Mexico Nuts and Seeds Industry Volume (K Tons) Forecast, by Application 2019 & 2032
- Table 87: Rest of North America Nuts and Seeds Industry Revenue (Million) Forecast, by Application 2019 & 2032
- Table 88: Rest of North America Nuts and Seeds Industry Volume (K Tons) Forecast, by Application 2019 & 2032
- Table 89: Global Nuts and Seeds Industry Revenue Million Forecast, by Product Type 2019 & 2032
- Table 90: Global Nuts and Seeds Industry Volume K Tons Forecast, by Product Type 2019 & 2032
- Table 91: Global Nuts and Seeds Industry Revenue Million Forecast, by Form 2019 & 2032
- Table 92: Global Nuts and Seeds Industry Volume K Tons Forecast, by Form 2019 & 2032
- Table 93: Global Nuts and Seeds Industry Revenue Million Forecast, by Application 2019 & 2032
- Table 94: Global Nuts and Seeds Industry Volume K Tons Forecast, by Application 2019 & 2032
- Table 95: Global Nuts and Seeds Industry Revenue Million Forecast, by Country 2019 & 2032
- Table 96: Global Nuts and Seeds Industry Volume K Tons Forecast, by Country 2019 & 2032
- Table 97: United Kingdom Nuts and Seeds Industry Revenue (Million) Forecast, by Application 2019 & 2032
- Table 98: United Kingdom Nuts and Seeds Industry Volume (K Tons) Forecast, by Application 2019 & 2032
- Table 99: Germany Nuts and Seeds Industry Revenue (Million) Forecast, by Application 2019 & 2032
- Table 100: Germany Nuts and Seeds Industry Volume (K Tons) Forecast, by Application 2019 & 2032
- Table 101: Spain Nuts and Seeds Industry Revenue (Million) Forecast, by Application 2019 & 2032
- Table 102: Spain Nuts and Seeds Industry Volume (K Tons) Forecast, by Application 2019 & 2032
- Table 103: France Nuts and Seeds Industry Revenue (Million) Forecast, by Application 2019 & 2032
- Table 104: France Nuts and Seeds Industry Volume (K Tons) Forecast, by Application 2019 & 2032
- Table 105: Italy Nuts and Seeds Industry Revenue (Million) Forecast, by Application 2019 & 2032
- Table 106: Italy Nuts and Seeds Industry Volume (K Tons) Forecast, by Application 2019 & 2032
- Table 107: Russia Nuts and Seeds Industry Revenue (Million) Forecast, by Application 2019 & 2032
- Table 108: Russia Nuts and Seeds Industry Volume (K Tons) Forecast, by Application 2019 & 2032
- Table 109: Rest of Europe Nuts and Seeds Industry Revenue (Million) Forecast, by Application 2019 & 2032
- Table 110: Rest of Europe Nuts and Seeds Industry Volume (K Tons) Forecast, by Application 2019 & 2032
- Table 111: Global Nuts and Seeds Industry Revenue Million Forecast, by Product Type 2019 & 2032
- Table 112: Global Nuts and Seeds Industry Volume K Tons Forecast, by Product Type 2019 & 2032
- Table 113: Global Nuts and Seeds Industry Revenue Million Forecast, by Form 2019 & 2032
- Table 114: Global Nuts and Seeds Industry Volume K Tons Forecast, by Form 2019 & 2032
- Table 115: Global Nuts and Seeds Industry Revenue Million Forecast, by Application 2019 & 2032
- Table 116: Global Nuts and Seeds Industry Volume K Tons Forecast, by Application 2019 & 2032
- Table 117: Global Nuts and Seeds Industry Revenue Million Forecast, by Country 2019 & 2032
- Table 118: Global Nuts and Seeds Industry Volume K Tons Forecast, by Country 2019 & 2032
- Table 119: China Nuts and Seeds Industry Revenue (Million) Forecast, by Application 2019 & 2032
- Table 120: China Nuts and Seeds Industry Volume (K Tons) Forecast, by Application 2019 & 2032
- Table 121: Japan Nuts and Seeds Industry Revenue (Million) Forecast, by Application 2019 & 2032
- Table 122: Japan Nuts and Seeds Industry Volume (K Tons) Forecast, by Application 2019 & 2032
- Table 123: India Nuts and Seeds Industry Revenue (Million) Forecast, by Application 2019 & 2032
- Table 124: India Nuts and Seeds Industry Volume (K Tons) Forecast, by Application 2019 & 2032
- Table 125: Australia Nuts and Seeds Industry Revenue (Million) Forecast, by Application 2019 & 2032
- Table 126: Australia Nuts and Seeds Industry Volume (K Tons) Forecast, by Application 2019 & 2032
- Table 127: Rest of Asia Pacific Nuts and Seeds Industry Revenue (Million) Forecast, by Application 2019 & 2032
- Table 128: Rest of Asia Pacific Nuts and Seeds Industry Volume (K Tons) Forecast, by Application 2019 & 2032
- Table 129: Global Nuts and Seeds Industry Revenue Million Forecast, by Product Type 2019 & 2032
- Table 130: Global Nuts and Seeds Industry Volume K Tons Forecast, by Product Type 2019 & 2032
- Table 131: Global Nuts and Seeds Industry Revenue Million Forecast, by Form 2019 & 2032
- Table 132: Global Nuts and Seeds Industry Volume K Tons Forecast, by Form 2019 & 2032
- Table 133: Global Nuts and Seeds Industry Revenue Million Forecast, by Application 2019 & 2032
- Table 134: Global Nuts and Seeds Industry Volume K Tons Forecast, by Application 2019 & 2032
- Table 135: Global Nuts and Seeds Industry Revenue Million Forecast, by Country 2019 & 2032
- Table 136: Global Nuts and Seeds Industry Volume K Tons Forecast, by Country 2019 & 2032
- Table 137: Brazil Nuts and Seeds Industry Revenue (Million) Forecast, by Application 2019 & 2032
- Table 138: Brazil Nuts and Seeds Industry Volume (K Tons) Forecast, by Application 2019 & 2032
- Table 139: Argentina Nuts and Seeds Industry Revenue (Million) Forecast, by Application 2019 & 2032
- Table 140: Argentina Nuts and Seeds Industry Volume (K Tons) Forecast, by Application 2019 & 2032
- Table 141: Rest of South America Nuts and Seeds Industry Revenue (Million) Forecast, by Application 2019 & 2032
- Table 142: Rest of South America Nuts and Seeds Industry Volume (K Tons) Forecast, by Application 2019 & 2032
- Table 143: Global Nuts and Seeds Industry Revenue Million Forecast, by Product Type 2019 & 2032
- Table 144: Global Nuts and Seeds Industry Volume K Tons Forecast, by Product Type 2019 & 2032
- Table 145: Global Nuts and Seeds Industry Revenue Million Forecast, by Form 2019 & 2032
- Table 146: Global Nuts and Seeds Industry Volume K Tons Forecast, by Form 2019 & 2032
- Table 147: Global Nuts and Seeds Industry Revenue Million Forecast, by Application 2019 & 2032
- Table 148: Global Nuts and Seeds Industry Volume K Tons Forecast, by Application 2019 & 2032
- Table 149: Global Nuts and Seeds Industry Revenue Million Forecast, by Country 2019 & 2032
- Table 150: Global Nuts and Seeds Industry Volume K Tons Forecast, by Country 2019 & 2032
- Table 151: Global Nuts and Seeds Industry Revenue Million Forecast, by Product Type 2019 & 2032
- Table 152: Global Nuts and Seeds Industry Volume K Tons Forecast, by Product Type 2019 & 2032
- Table 153: Global Nuts and Seeds Industry Revenue Million Forecast, by Form 2019 & 2032
- Table 154: Global Nuts and Seeds Industry Volume K Tons Forecast, by Form 2019 & 2032
- Table 155: Global Nuts and Seeds Industry Revenue Million Forecast, by Application 2019 & 2032
- Table 156: Global Nuts and Seeds Industry Volume K Tons Forecast, by Application 2019 & 2032
- Table 157: Global Nuts and Seeds Industry Revenue Million Forecast, by Country 2019 & 2032
- Table 158: Global Nuts and Seeds Industry Volume K Tons Forecast, by Country 2019 & 2032
- Table 159: South Africa Nuts and Seeds Industry Revenue (Million) Forecast, by Application 2019 & 2032
- Table 160: South Africa Nuts and Seeds Industry Volume (K Tons) Forecast, by Application 2019 & 2032
- Table 161: Rest of Middle East Nuts and Seeds Industry Revenue (Million) Forecast, by Application 2019 & 2032
- Table 162: Rest of Middle East Nuts and Seeds Industry Volume (K Tons) Forecast, by Application 2019 & 2032
Frequently Asked Questions
1. What is the projected Compound Annual Growth Rate (CAGR) of the Nuts and Seeds Industry?
The projected CAGR is approximately 5.87%.
2. Which companies are prominent players in the Nuts and Seeds Industry?
Key companies in the market include Food Specialities Limited *List Not Exhaustive, American Nuts LLC, Nuts com, The Wonderful Company LLC, Select Harvests Limited, Archer Daniels Midland Company, Cargill Inc, Olam Group, HBS Foods Ltd, Kanegrade Ltd.
3. What are the main segments of the Nuts and Seeds Industry?
The market segments include Product Type, Form, Application.
4. Can you provide details about the market size?
The market size is estimated to be USD 1345.81 Million as of 2022.
5. What are some drivers contributing to market growth?
Increasing Demand For Convenience & Processed Food.
6. What are the notable trends driving market growth?
Increasing Healthy Snack Demand is Fostering the Nuts and Seeds Market.
7. Are there any restraints impacting market growth?
Increased Consumer Awareness On Side-Effects Of Chemical Additives.
8. Can you provide examples of recent developments in the market?
In March 2022, PB2 Foods, a renowned player in the powdered nut butter market, introduced PB2 Cashew Powder. The cashew powders were claimed to be manufactured entirely of non-GMO cashews, kosher, vegan, and gluten-free, and included no additional salt, sugar, or preservatives as per the company.
9. What pricing options are available for accessing the report?
Pricing options include single-user, multi-user, and enterprise licenses priced at USD 4750, USD 5250, and USD 8750 respectively.
10. Is the market size provided in terms of value or volume?
The market size is provided in terms of value, measured in Million and volume, measured in K Tons.
11. Are there any specific market keywords associated with the report?
Yes, the market keyword associated with the report is "Nuts and Seeds Industry," which aids in identifying and referencing the specific market segment covered.
12. How do I determine which pricing option suits my needs best?
The pricing options vary based on user requirements and access needs. Individual users may opt for single-user licenses, while businesses requiring broader access may choose multi-user or enterprise licenses for cost-effective access to the report.
13. Are there any additional resources or data provided in the Nuts and Seeds Industry report?
While the report offers comprehensive insights, it's advisable to review the specific contents or supplementary materials provided to ascertain if additional resources or data are available.
14. How can I stay updated on further developments or reports in the Nuts and Seeds Industry?
To stay informed about further developments, trends, and reports in the Nuts and Seeds Industry, consider subscribing to industry newsletters, following relevant companies and organizations, or regularly checking reputable industry news sources and publications.
Methodology
Step 1 - Identification of Relevant Samples Size from Population Database


Step 2 - Approaches for Defining Global Market Size (Value, Volume* & Price*)

Note*: In applicable scenarios
Step 3 - Data Sources
Primary Research
- Web Analytics
- Survey Reports
- Research Institute
- Latest Research Reports
- Opinion Leaders
Secondary Research
- Annual Reports
- White Paper
- Latest Press Release
- Industry Association
- Paid Database
- Investor Presentations

Step 4 - Data Triangulation
Involves using different sources of information in order to increase the validity of a study
These sources are likely to be stakeholders in a program - participants, other researchers, program staff, other community members, and so on.
Then we put all data in single framework & apply various statistical tools to find out the dynamic on the market.
During the analysis stage, feedback from the stakeholder groups would be compared to determine areas of agreement as well as areas of divergence


