

Key Insights
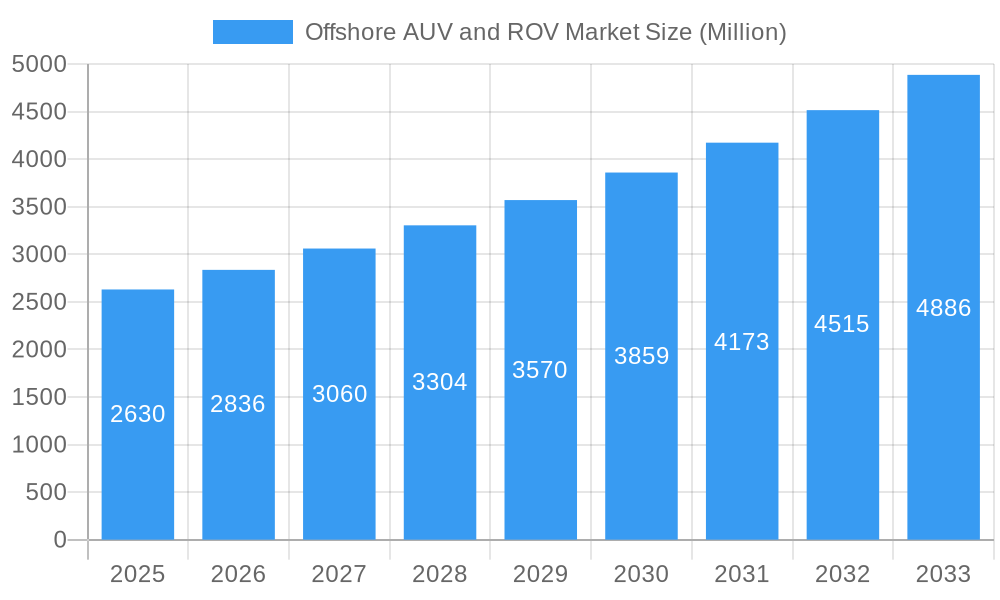
The offshore Autonomous Underwater Vehicle (AUV) and Remotely Operated Vehicle (ROV) market is experiencing robust growth, projected to reach a substantial size driven by increasing offshore energy exploration and production activities, alongside expanding defense and research applications. The market's Compound Annual Growth Rate (CAGR) of 7.69% from 2019 to 2024 indicates a significant upward trajectory, with a market size of $2.63 billion in 2025. This growth is fueled by several key factors: the continuous need for subsea infrastructure inspection, repair, and maintenance; the rising demand for efficient and cost-effective solutions for deep-sea operations; and technological advancements leading to enhanced AUV and ROV capabilities, including improved navigation, sensor technology, and operational autonomy. The oil and gas sector remains the dominant end-user, but the defense and research sectors are experiencing significant growth, further diversifying the market. Key players like DOF Subsea AS, Oceaneering International Inc., and Fugro NV are leading the innovation and market expansion through strategic partnerships, technological advancements, and geographic expansion. The market segmentation across vehicle types (AUV, ROV), vehicle classes (work-class, heavy work-class, observatory-class), and end-user applications provides a granular view of market dynamics, allowing for targeted investment and technological development. The geographic distribution shows strong market presence in North America and Europe, with Asia-Pacific exhibiting rapid growth potential.
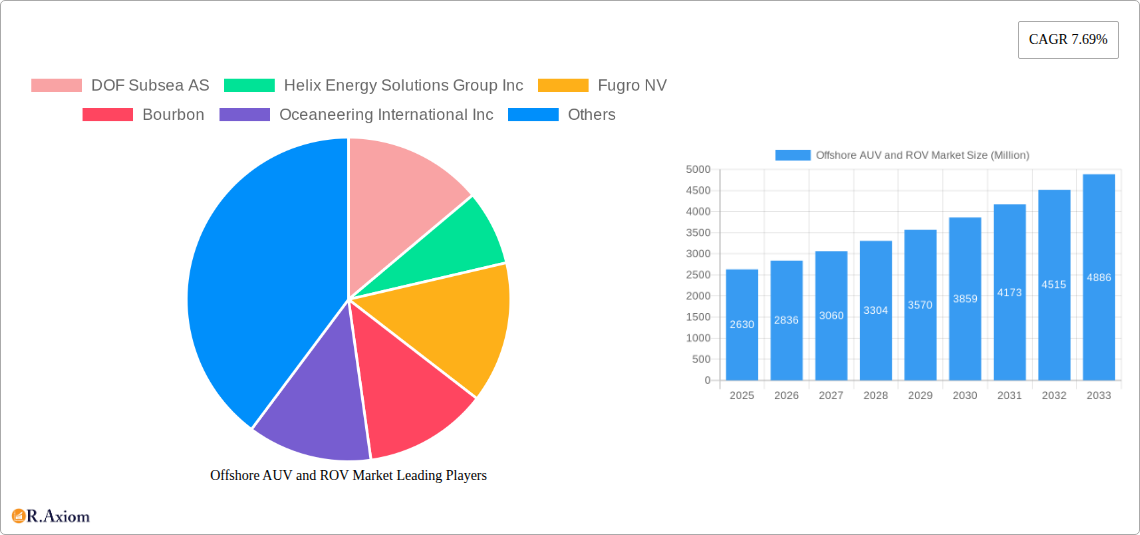
Offshore AUV and ROV Market Market Size (In Billion)
The forecast period of 2025-2033 promises continued expansion, fueled by ongoing investments in offshore renewable energy projects (such as offshore wind farms requiring significant subsea infrastructure assessment), the adoption of AUVs and ROVs for environmental monitoring, and the increasing focus on subsea infrastructure decommissioning. While potential restraints such as high initial investment costs and operational complexities exist, the long-term benefits of increased efficiency, safety, and data acquisition are driving market expansion. Technological innovations, such as improved battery technology for AUVs and enhanced robotic manipulation capabilities for ROVs, are further mitigating these restraints. The market's competitive landscape is characterized by both established players and emerging technology companies, resulting in continuous improvement and the availability of a wider range of solutions tailored to specific applications and operational environments.
Offshore AUV and ROV Market Company Market Share
Offshore AUV and ROV Market: A Comprehensive Report (2019-2033)
This in-depth report provides a comprehensive analysis of the offshore AUV and ROV market, offering valuable insights for industry stakeholders, investors, and researchers. The study period spans from 2019 to 2033, with 2025 serving as the base and estimated year. The report leverages extensive data analysis to forecast market trends and growth projections from 2025 to 2033, examining historical data from 2019 to 2024. The market is segmented by vehicle type (ROV, AUV), vehicle class (work-class, heavy work-class, observatory-class), end-user application (oil and gas, defense, research, other), and activity (drilling and development, construction, inspection, repair and maintenance, decommissioning, other). Key players analyzed include DOF Subsea AS, Helix Energy Solutions Group Inc, Fugro NV, Bourbon, Oceaneering International Inc, Saipem SpA, DeepOcean AS, Subsea 7 SA, Teledyne Technologies Incorporated, TechnipFMC PLC, and others.
Offshore AUV and ROV Market Concentration & Innovation
The offshore AUV and ROV market exhibits a moderately concentrated structure, with a few major players holding significant market share. However, the presence of several smaller, specialized companies indicates a dynamic competitive landscape. Market share data for individual companies is unavailable, but an estimated xx% is held by the top five players. Innovation is a key driver, with ongoing advancements in sensor technology, autonomy, and control systems. The industry is regulated by various national and international bodies concerning safety and environmental standards, impacting operational costs and deployment strategies. Product substitutes, such as remotely operated surface vehicles, are also considered. End-user trends are shaping demand, particularly in the oil and gas sector. M&A activities have been significant, totaling an estimated xx Million USD in deal value over the past five years, driving consolidation and expansion of service offerings.
- Key Innovation Drivers: Advanced sensor technology, AI-powered autonomy, improved communication systems, miniaturization of components.
- Regulatory Frameworks: International Maritime Organization (IMO) guidelines, national safety regulations, environmental impact assessments.
- M&A Activity: Consolidation among major players to enhance service portfolios and geographic reach, with the average deal size exceeding xx Million USD in recent years.
Offshore AUV and ROV Market Industry Trends & Insights
The offshore AUV and ROV market is experiencing robust growth, driven by increased offshore exploration and production activities, particularly in deepwater environments. The Compound Annual Growth Rate (CAGR) during the forecast period (2025-2033) is projected to be xx%, fueled by technological advancements and expansion into new applications. Technological disruptions, such as the adoption of AI and machine learning, enhance operational efficiency and data analysis capabilities. Consumer preference for safer and more efficient subsea operations drives demand for advanced AUV and ROV technologies. The market is witnessing an increase in competition, with new entrants and established players continuously seeking to improve their offerings. Market penetration in specific sectors like renewable energy is also increasing, which is expected to contribute xx Million USD to the market value by 2033.
Dominant Markets & Segments in Offshore AUV and ROV Market
The oil and gas sector remains the dominant end-user application, accounting for approximately xx% of the market. This is primarily due to the extensive use of AUVs and ROVs for inspection, repair, and maintenance of subsea infrastructure. However, the defense and research sectors are witnessing significant growth, driven by increased investment in underwater surveillance and scientific exploration. The geographical dominance shifts across different segments, with certain regions such as the North Sea and the Gulf of Mexico leading in oil & gas operations, while others stand out in defense or research applications. Dominant market segments also vary by vehicle type and class.
- Key Drivers by Segment:
- Oil & Gas: Rising deepwater exploration and production activities, aging subsea infrastructure requiring maintenance.
- Defense: Growing demand for underwater surveillance and mine countermeasures.
- Research: Increased funding for scientific oceanographic research and exploration.
Offshore AUV and ROV Market Product Developments
Recent product developments focus on enhancing operational capabilities, including improved maneuverability, increased payload capacity, and advanced sensor integration. The industry witnesses a trend towards greater autonomy, enabling longer deployments and reduced human intervention. New applications are being explored, including pipeline inspection, cable laying, and environmental monitoring. These advancements are driving increased market competitiveness and leading to the adoption of sophisticated underwater robotic solutions.
Report Scope & Segmentation Analysis
This report provides an in-depth and granular analysis of the global offshore Autonomous Underwater Vehicle (AUV) and Remotely Operated Vehicle (ROV) market, dissecting it across critical segments to offer a comprehensive understanding of market dynamics and future trajectories.
- Vehicle Type: Remotely Operated Vehicles (ROVs) currently hold a dominant market share, underpinned by their established versatility and robust operational capabilities across a wide spectrum of subsea tasks. However, Autonomous Underwater Vehicles (AUVs) are experiencing a notable surge in adoption and interest. This growth is primarily attributed to significant advancements in their autonomy, navigational intelligence, and increasingly competitive cost-efficiency. Projections indicate the ROV segment will achieve a valuation of approximately $XX Million USD by 2033, while the AUV segment is anticipated to reach a substantial $XX Million USD within the same timeframe, reflecting a strong growth trajectory for autonomous systems.
- Vehicle Class: Work-class vehicles represent the largest segment within the market, owing to their widespread application in complex subsea operations. Concurrently, there is a discernible growth trend in the heavy work-class and observatory-class vehicle categories. This expansion is propelled by the escalating requirement for vehicles capable of managing larger payloads, executing more intricate tasks, and gathering extensive data. The heavy work-class segment is forecasted to contribute approximately $XX Million USD to the total market value by 2033, while observatory-class vehicles are expected to secure a significant share, contributing around $XX Million USD, highlighting the demand for specialized and high-capacity subsea platforms.
- End-User Application: The oil and gas industry continues to be the primary and most significant application sector, driving substantial demand for offshore AUVs and ROVs. However, a notable and rapid expansion is being observed in the defense and scientific research segments. These sectors are increasingly leveraging AUVs and ROVs for a variety of missions, including surveillance, environmental monitoring, seabed mapping, and deep-sea exploration, indicating a diversification of the market beyond traditional energy exploration.
- Activity: Inspection, repair, and maintenance (IRM) activities remain the foundational and most prevalent applications across all vehicle types and end-user segments. The critical nature of maintaining subsea infrastructure in harsh environments ensures a continuous demand for these services. Emerging applications such as subsea construction support, data acquisition for resource management, and environmental surveying are also contributing to market growth.
Key Drivers of Offshore AUV and ROV Market Growth
The robust expansion of the offshore AUV and ROV market is propelled by a confluence of powerful driving forces. The escalating demand for intricate subsea operations within the perpetually evolving oil and gas sector, coupled with substantial and sustained government investments in marine research, scientific exploration, and national defense initiatives, are primary catalysts. Furthermore, rapid advancements in enabling technologies, including sophisticated artificial intelligence (AI) algorithms, enhanced machine learning capabilities for predictive analytics and autonomous decision-making, and improvements in sensor technology, are significantly boosting the performance and applicability of these underwater vehicles. The continuous and growing need for highly efficient, reliable, and cost-effective solutions for the inspection, maintenance, and repair of critical subsea infrastructure, including pipelines, cables, and wellheads, further fuels market expansion.
Challenges in the Offshore AUV and ROV Market Sector
Despite its promising growth, the offshore AUV and ROV market faces several persistent challenges that can impact market dynamics. The substantial initial capital investment required for acquiring and deploying advanced AUVs and ROVs, along with their associated support infrastructure, remains a significant barrier for some operators. The complex and often evolving regulatory environment governing underwater operations, including environmental protection mandates and safety standards, can create compliance hurdles and project delays. The inherent risk of equipment malfunction or failure in the unforgiving and high-pressure subsea environment, coupled with the logistical complexities of recovery and repair, adds another layer of challenge. Moreover, the market is characterized by intense competition among a growing number of established players and emerging innovators, which can exert pressure on pricing and profit margins. Persistent global supply chain disruptions can also contribute to increased component costs, extended lead times, and unforeseen project delays, impacting overall market efficiency.
Emerging Opportunities in Offshore AUV and ROV Market
Emerging opportunities exist in expanding applications beyond oil and gas, including renewable energy installations, underwater infrastructure inspection, and environmental monitoring. Advancements in AI and autonomous capabilities will further fuel market growth and open new avenues for underwater robotic applications. The adoption of sustainable and environmentally friendly technologies in the AUV/ROV manufacturing process and operation is also expected to attract more investments.
Leading Players in the Offshore AUV and ROV Market Market
Key Developments in Offshore AUV and ROV Market Industry
- Jan 2024: DeepTech secured a three-year contract with BP Plc for ROV services in Egypt, highlighting the growing demand for ROVs in drilling and subsea operations. This contract, valued at an estimated xx Million USD, reinforces the importance of long-term service agreements in the market.
- Oct 2022: Oceaneering secured numerous contracts totaling USD 300 Million for ROV services, showcasing the significant market potential for subsea intervention and construction activities. This indicates strong demand for ROV services linked to floating drilling rigs and vessels.
- May 2022: Gujarat Police's adoption of ROVs for underwater recovery operations demonstrates the expansion of ROV applications beyond the traditional oil and gas sector, showing the versatility and potential of this technology across industries.
Strategic Outlook for Offshore AUV and ROV Market Market
The offshore AUV and ROV market is poised for significant growth, driven by technological innovation, increasing demand for subsea operations, and expansion into new application areas. The market's future potential is substantial, with continued investments in advanced technologies and the development of new applications likely to accelerate growth in the coming years. The focus on automation and AI-powered solutions will be crucial for driving efficiency and reducing operational costs, which in turn will expand the market potential in diverse sectors.
Offshore AUV and ROV Market Segmentation
-
1. Vehicle Type
- 1.1. ROV
- 1.2. AUV
-
2. Vehicle Class
-
2.1. Work-class Vehicle
- 2.1.1. Light Work-class Vehicle
- 2.1.2. Medium Work-class Vehicle
- 2.1.3. Heavy Work-class Vehicle
- 2.2. Observatory-class Vehicles
-
2.1. Work-class Vehicle
-
3. End-user Application
- 3.1. Oil and Gas
- 3.2. Defense
- 3.3. Research
- 3.4. Other End-user Applications
-
4. Activity
- 4.1. Drilling and Development
- 4.2. Construction
- 4.3. Inspection, Repair, and Maintenance
- 4.4. Decommissioning
- 4.5. Other Activities
Offshore AUV and ROV Market Segmentation By Geography
-
1. North America
- 1.1. United States
- 1.2. Canada
- 1.3. Mexico
-
2. Europe
- 2.1. Germany
- 2.2. United Kingdom
- 2.3. Denmark
- 2.4. Norway
- 2.5. Russia
- 2.6. France
- 2.7. Rest of Europe
-
3. Asia Pacific
- 3.1. China
- 3.2. India
- 3.3. ASEAN Countries
- 3.4. Rest of Asia Pacific
-
4. South America
- 4.1. Brazil
- 4.2. Venezuela
- 4.3. Argentina
- 4.4. Colombia
- 4.5. Rest of South America
-
5. Middle East and Africa
- 5.1. Saudi Arabia
- 5.2. United Arab Emirates
- 5.3. Qatar
- 5.4. Nigeria
- 5.5. Rest of Middle East and Africa
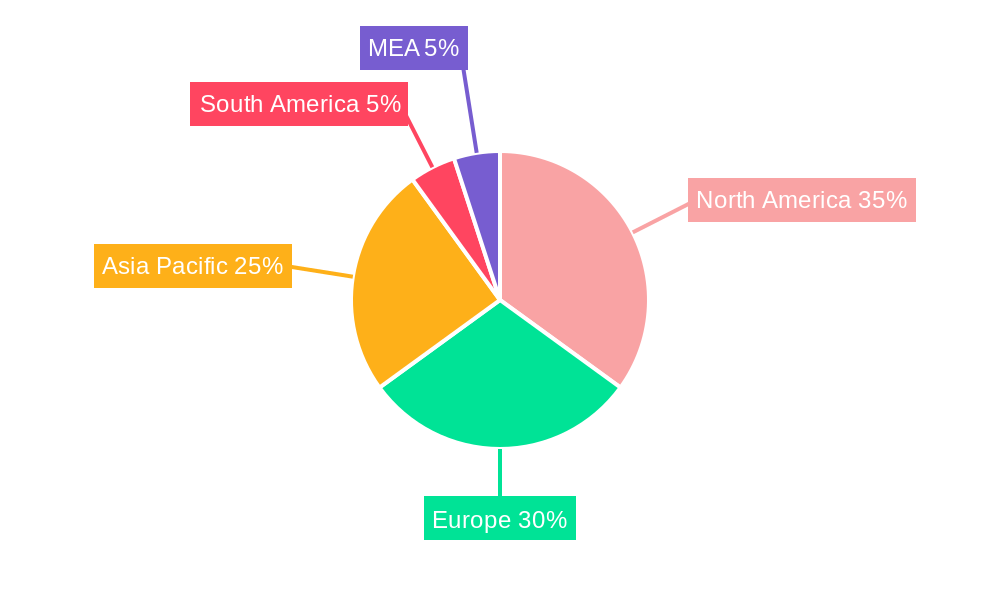
Offshore AUV and ROV Market Regional Market Share
Geographic Coverage of Offshore AUV and ROV Market
Offshore AUV and ROV Market REPORT HIGHLIGHTS
| Aspects | Details |
|---|---|
| Study Period | 2020-2034 |
| Base Year | 2025 |
| Estimated Year | 2026 |
| Forecast Period | 2026-2034 |
| Historical Period | 2020-2025 |
| Growth Rate | CAGR of 7.69% from 2020-2034 |
| Segmentation |
|
Table of Contents
- 1. Introduction
- 1.1. Research Scope
- 1.2. Market Segmentation
- 1.3. Research Objective
- 1.4. Definitions and Assumptions
- 2. Executive Summary
- 2.1. Market Snapshot
- 3. Market Dynamics
- 3.1. Market Drivers
- 3.2. Market Restrains
- 3.3. Market Trends
- 3.4. Market Opportunities
- 4. Market Factor Analysis
- 4.1. Porters Five Forces
- 4.1.1. Bargaining Power of Suppliers
- 4.1.2. Bargaining Power of Buyers
- 4.1.3. Threat of New Entrants
- 4.1.4. Threat of Substitutes
- 4.1.5. Competitive Rivalry
- 4.2. PESTEL analysis
- 4.3. BCG Analysis
- 4.3.1. Stars (High Growth, High Market Share)
- 4.3.2. Cash Cows (Low Growth, High Market Share)
- 4.3.3. Question Mark (High Growth, Low Market Share)
- 4.3.4. Dogs (Low Growth, Low Market Share)
- 4.4. Ansoff Matrix Analysis
- 4.5. Supply Chain Analysis
- 4.6. Regulatory Landscape
- 4.7. Current Market Potential and Opportunity Assessment (TAM–SAM–SOM Framework)
- 4.8. RAX Analyst Note
- 4.1. Porters Five Forces
- 5. Market Analysis, Insights and Forecast 2021-2033
- 5.1. Market Analysis, Insights and Forecast - by Vehicle Type
- 5.1.1. ROV
- 5.1.2. AUV
- 5.2. Market Analysis, Insights and Forecast - by Vehicle Class
- 5.2.1. Work-class Vehicle
- 5.2.1.1. Light Work-class Vehicle
- 5.2.1.2. Medium Work-class Vehicle
- 5.2.1.3. Heavy Work-class Vehicle
- 5.2.2. Observatory-class Vehicles
- 5.2.1. Work-class Vehicle
- 5.3. Market Analysis, Insights and Forecast - by End-user Application
- 5.3.1. Oil and Gas
- 5.3.2. Defense
- 5.3.3. Research
- 5.3.4. Other End-user Applications
- 5.4. Market Analysis, Insights and Forecast - by Activity
- 5.4.1. Drilling and Development
- 5.4.2. Construction
- 5.4.3. Inspection, Repair, and Maintenance
- 5.4.4. Decommissioning
- 5.4.5. Other Activities
- 5.5. Market Analysis, Insights and Forecast - by Region
- 5.5.1. North America
- 5.5.2. Europe
- 5.5.3. Asia Pacific
- 5.5.4. South America
- 5.5.5. Middle East and Africa
- 5.1. Market Analysis, Insights and Forecast - by Vehicle Type
- 6. Global Offshore AUV and ROV Market Analysis, Insights and Forecast, 2021-2033
- 6.1. Market Analysis, Insights and Forecast - by Vehicle Type
- 6.1.1. ROV
- 6.1.2. AUV
- 6.2. Market Analysis, Insights and Forecast - by Vehicle Class
- 6.2.1. Work-class Vehicle
- 6.2.1.1. Light Work-class Vehicle
- 6.2.1.2. Medium Work-class Vehicle
- 6.2.1.3. Heavy Work-class Vehicle
- 6.2.2. Observatory-class Vehicles
- 6.2.1. Work-class Vehicle
- 6.3. Market Analysis, Insights and Forecast - by End-user Application
- 6.3.1. Oil and Gas
- 6.3.2. Defense
- 6.3.3. Research
- 6.3.4. Other End-user Applications
- 6.4. Market Analysis, Insights and Forecast - by Activity
- 6.4.1. Drilling and Development
- 6.4.2. Construction
- 6.4.3. Inspection, Repair, and Maintenance
- 6.4.4. Decommissioning
- 6.4.5. Other Activities
- 6.1. Market Analysis, Insights and Forecast - by Vehicle Type
- 7. North America Offshore AUV and ROV Market Analysis, Insights and Forecast, 2020-2032
- 7.1. Market Analysis, Insights and Forecast - by Vehicle Type
- 7.1.1. ROV
- 7.1.2. AUV
- 7.2. Market Analysis, Insights and Forecast - by Vehicle Class
- 7.2.1. Work-class Vehicle
- 7.2.1.1. Light Work-class Vehicle
- 7.2.1.2. Medium Work-class Vehicle
- 7.2.1.3. Heavy Work-class Vehicle
- 7.2.2. Observatory-class Vehicles
- 7.2.1. Work-class Vehicle
- 7.3. Market Analysis, Insights and Forecast - by End-user Application
- 7.3.1. Oil and Gas
- 7.3.2. Defense
- 7.3.3. Research
- 7.3.4. Other End-user Applications
- 7.4. Market Analysis, Insights and Forecast - by Activity
- 7.4.1. Drilling and Development
- 7.4.2. Construction
- 7.4.3. Inspection, Repair, and Maintenance
- 7.4.4. Decommissioning
- 7.4.5. Other Activities
- 7.1. Market Analysis, Insights and Forecast - by Vehicle Type
- 8. Europe Offshore AUV and ROV Market Analysis, Insights and Forecast, 2020-2032
- 8.1. Market Analysis, Insights and Forecast - by Vehicle Type
- 8.1.1. ROV
- 8.1.2. AUV
- 8.2. Market Analysis, Insights and Forecast - by Vehicle Class
- 8.2.1. Work-class Vehicle
- 8.2.1.1. Light Work-class Vehicle
- 8.2.1.2. Medium Work-class Vehicle
- 8.2.1.3. Heavy Work-class Vehicle
- 8.2.2. Observatory-class Vehicles
- 8.2.1. Work-class Vehicle
- 8.3. Market Analysis, Insights and Forecast - by End-user Application
- 8.3.1. Oil and Gas
- 8.3.2. Defense
- 8.3.3. Research
- 8.3.4. Other End-user Applications
- 8.4. Market Analysis, Insights and Forecast - by Activity
- 8.4.1. Drilling and Development
- 8.4.2. Construction
- 8.4.3. Inspection, Repair, and Maintenance
- 8.4.4. Decommissioning
- 8.4.5. Other Activities
- 8.1. Market Analysis, Insights and Forecast - by Vehicle Type
- 9. Asia Pacific Offshore AUV and ROV Market Analysis, Insights and Forecast, 2020-2032
- 9.1. Market Analysis, Insights and Forecast - by Vehicle Type
- 9.1.1. ROV
- 9.1.2. AUV
- 9.2. Market Analysis, Insights and Forecast - by Vehicle Class
- 9.2.1. Work-class Vehicle
- 9.2.1.1. Light Work-class Vehicle
- 9.2.1.2. Medium Work-class Vehicle
- 9.2.1.3. Heavy Work-class Vehicle
- 9.2.2. Observatory-class Vehicles
- 9.2.1. Work-class Vehicle
- 9.3. Market Analysis, Insights and Forecast - by End-user Application
- 9.3.1. Oil and Gas
- 9.3.2. Defense
- 9.3.3. Research
- 9.3.4. Other End-user Applications
- 9.4. Market Analysis, Insights and Forecast - by Activity
- 9.4.1. Drilling and Development
- 9.4.2. Construction
- 9.4.3. Inspection, Repair, and Maintenance
- 9.4.4. Decommissioning
- 9.4.5. Other Activities
- 9.1. Market Analysis, Insights and Forecast - by Vehicle Type
- 10. South America Offshore AUV and ROV Market Analysis, Insights and Forecast, 2020-2032
- 10.1. Market Analysis, Insights and Forecast - by Vehicle Type
- 10.1.1. ROV
- 10.1.2. AUV
- 10.2. Market Analysis, Insights and Forecast - by Vehicle Class
- 10.2.1. Work-class Vehicle
- 10.2.1.1. Light Work-class Vehicle
- 10.2.1.2. Medium Work-class Vehicle
- 10.2.1.3. Heavy Work-class Vehicle
- 10.2.2. Observatory-class Vehicles
- 10.2.1. Work-class Vehicle
- 10.3. Market Analysis, Insights and Forecast - by End-user Application
- 10.3.1. Oil and Gas
- 10.3.2. Defense
- 10.3.3. Research
- 10.3.4. Other End-user Applications
- 10.4. Market Analysis, Insights and Forecast - by Activity
- 10.4.1. Drilling and Development
- 10.4.2. Construction
- 10.4.3. Inspection, Repair, and Maintenance
- 10.4.4. Decommissioning
- 10.4.5. Other Activities
- 10.1. Market Analysis, Insights and Forecast - by Vehicle Type
- 11. Middle East and Africa Offshore AUV and ROV Market Analysis, Insights and Forecast, 2020-2032
- 11.1. Market Analysis, Insights and Forecast - by Vehicle Type
- 11.1.1. ROV
- 11.1.2. AUV
- 11.2. Market Analysis, Insights and Forecast - by Vehicle Class
- 11.2.1. Work-class Vehicle
- 11.2.1.1. Light Work-class Vehicle
- 11.2.1.2. Medium Work-class Vehicle
- 11.2.1.3. Heavy Work-class Vehicle
- 11.2.2. Observatory-class Vehicles
- 11.2.1. Work-class Vehicle
- 11.3. Market Analysis, Insights and Forecast - by End-user Application
- 11.3.1. Oil and Gas
- 11.3.2. Defense
- 11.3.3. Research
- 11.3.4. Other End-user Applications
- 11.4. Market Analysis, Insights and Forecast - by Activity
- 11.4.1. Drilling and Development
- 11.4.2. Construction
- 11.4.3. Inspection, Repair, and Maintenance
- 11.4.4. Decommissioning
- 11.4.5. Other Activities
- 11.1. Market Analysis, Insights and Forecast - by Vehicle Type
- 12. Competitive Analysis
- 12.1. Company Profiles
- 12.1.1 DOF Subsea AS
- 12.1.1.1. Company Overview
- 12.1.1.2. Products
- 12.1.1.3. Company Financials
- 12.1.1.4. SWOT Analysis
- 12.1.2 Helix Energy Solutions Group Inc
- 12.1.2.1. Company Overview
- 12.1.2.2. Products
- 12.1.2.3. Company Financials
- 12.1.2.4. SWOT Analysis
- 12.1.3 Fugro NV
- 12.1.3.1. Company Overview
- 12.1.3.2. Products
- 12.1.3.3. Company Financials
- 12.1.3.4. SWOT Analysis
- 12.1.4 Bourbon
- 12.1.4.1. Company Overview
- 12.1.4.2. Products
- 12.1.4.3. Company Financials
- 12.1.4.4. SWOT Analysis
- 12.1.5 Oceaneering International Inc
- 12.1.5.1. Company Overview
- 12.1.5.2. Products
- 12.1.5.3. Company Financials
- 12.1.5.4. SWOT Analysis
- 12.1.6 Saipem SpA
- 12.1.6.1. Company Overview
- 12.1.6.2. Products
- 12.1.6.3. Company Financials
- 12.1.6.4. SWOT Analysis
- 12.1.7 DeepOcean AS
- 12.1.7.1. Company Overview
- 12.1.7.2. Products
- 12.1.7.3. Company Financials
- 12.1.7.4. SWOT Analysis
- 12.1.8 Subsea 7 SA
- 12.1.8.1. Company Overview
- 12.1.8.2. Products
- 12.1.8.3. Company Financials
- 12.1.8.4. SWOT Analysis
- 12.1.9 Teledyne Technologies Incorporated*List Not Exhaustive
- 12.1.9.1. Company Overview
- 12.1.9.2. Products
- 12.1.9.3. Company Financials
- 12.1.9.4. SWOT Analysis
- 12.1.10 TechnipFMC PLC
- 12.1.10.1. Company Overview
- 12.1.10.2. Products
- 12.1.10.3. Company Financials
- 12.1.10.4. SWOT Analysis
- 12.1.1 DOF Subsea AS
- 12.2. Market Entropy
- 12.2.1 Company's Key Areas Served
- 12.2.2 Recent Developments
- 12.3. Company Market Share Analysis 2025
- 12.3.1 Top 5 Companies Market Share Analysis
- 12.3.2 Top 3 Companies Market Share Analysis
- 12.4. List of Potential Customers
- 13. Research Methodology
List of Figures
- Figure 1: Global Offshore AUV and ROV Market Revenue Breakdown (Million, %) by Region 2025 & 2033
- Figure 2: Global Offshore AUV and ROV Market Volume Breakdown (K Unit, %) by Region 2025 & 2033
- Figure 3: North America Offshore AUV and ROV Market Revenue (Million), by Vehicle Type 2025 & 2033
- Figure 4: North America Offshore AUV and ROV Market Volume (K Unit), by Vehicle Type 2025 & 2033
- Figure 5: North America Offshore AUV and ROV Market Revenue Share (%), by Vehicle Type 2025 & 2033
- Figure 6: North America Offshore AUV and ROV Market Volume Share (%), by Vehicle Type 2025 & 2033
- Figure 7: North America Offshore AUV and ROV Market Revenue (Million), by Vehicle Class 2025 & 2033
- Figure 8: North America Offshore AUV and ROV Market Volume (K Unit), by Vehicle Class 2025 & 2033
- Figure 9: North America Offshore AUV and ROV Market Revenue Share (%), by Vehicle Class 2025 & 2033
- Figure 10: North America Offshore AUV and ROV Market Volume Share (%), by Vehicle Class 2025 & 2033
- Figure 11: North America Offshore AUV and ROV Market Revenue (Million), by End-user Application 2025 & 2033
- Figure 12: North America Offshore AUV and ROV Market Volume (K Unit), by End-user Application 2025 & 2033
- Figure 13: North America Offshore AUV and ROV Market Revenue Share (%), by End-user Application 2025 & 2033
- Figure 14: North America Offshore AUV and ROV Market Volume Share (%), by End-user Application 2025 & 2033
- Figure 15: North America Offshore AUV and ROV Market Revenue (Million), by Activity 2025 & 2033
- Figure 16: North America Offshore AUV and ROV Market Volume (K Unit), by Activity 2025 & 2033
- Figure 17: North America Offshore AUV and ROV Market Revenue Share (%), by Activity 2025 & 2033
- Figure 18: North America Offshore AUV and ROV Market Volume Share (%), by Activity 2025 & 2033
- Figure 19: North America Offshore AUV and ROV Market Revenue (Million), by Country 2025 & 2033
- Figure 20: North America Offshore AUV and ROV Market Volume (K Unit), by Country 2025 & 2033
- Figure 21: North America Offshore AUV and ROV Market Revenue Share (%), by Country 2025 & 2033
- Figure 22: North America Offshore AUV and ROV Market Volume Share (%), by Country 2025 & 2033
- Figure 23: Europe Offshore AUV and ROV Market Revenue (Million), by Vehicle Type 2025 & 2033
- Figure 24: Europe Offshore AUV and ROV Market Volume (K Unit), by Vehicle Type 2025 & 2033
- Figure 25: Europe Offshore AUV and ROV Market Revenue Share (%), by Vehicle Type 2025 & 2033
- Figure 26: Europe Offshore AUV and ROV Market Volume Share (%), by Vehicle Type 2025 & 2033
- Figure 27: Europe Offshore AUV and ROV Market Revenue (Million), by Vehicle Class 2025 & 2033
- Figure 28: Europe Offshore AUV and ROV Market Volume (K Unit), by Vehicle Class 2025 & 2033
- Figure 29: Europe Offshore AUV and ROV Market Revenue Share (%), by Vehicle Class 2025 & 2033
- Figure 30: Europe Offshore AUV and ROV Market Volume Share (%), by Vehicle Class 2025 & 2033
- Figure 31: Europe Offshore AUV and ROV Market Revenue (Million), by End-user Application 2025 & 2033
- Figure 32: Europe Offshore AUV and ROV Market Volume (K Unit), by End-user Application 2025 & 2033
- Figure 33: Europe Offshore AUV and ROV Market Revenue Share (%), by End-user Application 2025 & 2033
- Figure 34: Europe Offshore AUV and ROV Market Volume Share (%), by End-user Application 2025 & 2033
- Figure 35: Europe Offshore AUV and ROV Market Revenue (Million), by Activity 2025 & 2033
- Figure 36: Europe Offshore AUV and ROV Market Volume (K Unit), by Activity 2025 & 2033
- Figure 37: Europe Offshore AUV and ROV Market Revenue Share (%), by Activity 2025 & 2033
- Figure 38: Europe Offshore AUV and ROV Market Volume Share (%), by Activity 2025 & 2033
- Figure 39: Europe Offshore AUV and ROV Market Revenue (Million), by Country 2025 & 2033
- Figure 40: Europe Offshore AUV and ROV Market Volume (K Unit), by Country 2025 & 2033
- Figure 41: Europe Offshore AUV and ROV Market Revenue Share (%), by Country 2025 & 2033
- Figure 42: Europe Offshore AUV and ROV Market Volume Share (%), by Country 2025 & 2033
- Figure 43: Asia Pacific Offshore AUV and ROV Market Revenue (Million), by Vehicle Type 2025 & 2033
- Figure 44: Asia Pacific Offshore AUV and ROV Market Volume (K Unit), by Vehicle Type 2025 & 2033
- Figure 45: Asia Pacific Offshore AUV and ROV Market Revenue Share (%), by Vehicle Type 2025 & 2033
- Figure 46: Asia Pacific Offshore AUV and ROV Market Volume Share (%), by Vehicle Type 2025 & 2033
- Figure 47: Asia Pacific Offshore AUV and ROV Market Revenue (Million), by Vehicle Class 2025 & 2033
- Figure 48: Asia Pacific Offshore AUV and ROV Market Volume (K Unit), by Vehicle Class 2025 & 2033
- Figure 49: Asia Pacific Offshore AUV and ROV Market Revenue Share (%), by Vehicle Class 2025 & 2033
- Figure 50: Asia Pacific Offshore AUV and ROV Market Volume Share (%), by Vehicle Class 2025 & 2033
- Figure 51: Asia Pacific Offshore AUV and ROV Market Revenue (Million), by End-user Application 2025 & 2033
- Figure 52: Asia Pacific Offshore AUV and ROV Market Volume (K Unit), by End-user Application 2025 & 2033
- Figure 53: Asia Pacific Offshore AUV and ROV Market Revenue Share (%), by End-user Application 2025 & 2033
- Figure 54: Asia Pacific Offshore AUV and ROV Market Volume Share (%), by End-user Application 2025 & 2033
- Figure 55: Asia Pacific Offshore AUV and ROV Market Revenue (Million), by Activity 2025 & 2033
- Figure 56: Asia Pacific Offshore AUV and ROV Market Volume (K Unit), by Activity 2025 & 2033
- Figure 57: Asia Pacific Offshore AUV and ROV Market Revenue Share (%), by Activity 2025 & 2033
- Figure 58: Asia Pacific Offshore AUV and ROV Market Volume Share (%), by Activity 2025 & 2033
- Figure 59: Asia Pacific Offshore AUV and ROV Market Revenue (Million), by Country 2025 & 2033
- Figure 60: Asia Pacific Offshore AUV and ROV Market Volume (K Unit), by Country 2025 & 2033
- Figure 61: Asia Pacific Offshore AUV and ROV Market Revenue Share (%), by Country 2025 & 2033
- Figure 62: Asia Pacific Offshore AUV and ROV Market Volume Share (%), by Country 2025 & 2033
- Figure 63: South America Offshore AUV and ROV Market Revenue (Million), by Vehicle Type 2025 & 2033
- Figure 64: South America Offshore AUV and ROV Market Volume (K Unit), by Vehicle Type 2025 & 2033
- Figure 65: South America Offshore AUV and ROV Market Revenue Share (%), by Vehicle Type 2025 & 2033
- Figure 66: South America Offshore AUV and ROV Market Volume Share (%), by Vehicle Type 2025 & 2033
- Figure 67: South America Offshore AUV and ROV Market Revenue (Million), by Vehicle Class 2025 & 2033
- Figure 68: South America Offshore AUV and ROV Market Volume (K Unit), by Vehicle Class 2025 & 2033
- Figure 69: South America Offshore AUV and ROV Market Revenue Share (%), by Vehicle Class 2025 & 2033
- Figure 70: South America Offshore AUV and ROV Market Volume Share (%), by Vehicle Class 2025 & 2033
- Figure 71: South America Offshore AUV and ROV Market Revenue (Million), by End-user Application 2025 & 2033
- Figure 72: South America Offshore AUV and ROV Market Volume (K Unit), by End-user Application 2025 & 2033
- Figure 73: South America Offshore AUV and ROV Market Revenue Share (%), by End-user Application 2025 & 2033
- Figure 74: South America Offshore AUV and ROV Market Volume Share (%), by End-user Application 2025 & 2033
- Figure 75: South America Offshore AUV and ROV Market Revenue (Million), by Activity 2025 & 2033
- Figure 76: South America Offshore AUV and ROV Market Volume (K Unit), by Activity 2025 & 2033
- Figure 77: South America Offshore AUV and ROV Market Revenue Share (%), by Activity 2025 & 2033
- Figure 78: South America Offshore AUV and ROV Market Volume Share (%), by Activity 2025 & 2033
- Figure 79: South America Offshore AUV and ROV Market Revenue (Million), by Country 2025 & 2033
- Figure 80: South America Offshore AUV and ROV Market Volume (K Unit), by Country 2025 & 2033
- Figure 81: South America Offshore AUV and ROV Market Revenue Share (%), by Country 2025 & 2033
- Figure 82: South America Offshore AUV and ROV Market Volume Share (%), by Country 2025 & 2033
- Figure 83: Middle East and Africa Offshore AUV and ROV Market Revenue (Million), by Vehicle Type 2025 & 2033
- Figure 84: Middle East and Africa Offshore AUV and ROV Market Volume (K Unit), by Vehicle Type 2025 & 2033
- Figure 85: Middle East and Africa Offshore AUV and ROV Market Revenue Share (%), by Vehicle Type 2025 & 2033
- Figure 86: Middle East and Africa Offshore AUV and ROV Market Volume Share (%), by Vehicle Type 2025 & 2033
- Figure 87: Middle East and Africa Offshore AUV and ROV Market Revenue (Million), by Vehicle Class 2025 & 2033
- Figure 88: Middle East and Africa Offshore AUV and ROV Market Volume (K Unit), by Vehicle Class 2025 & 2033
- Figure 89: Middle East and Africa Offshore AUV and ROV Market Revenue Share (%), by Vehicle Class 2025 & 2033
- Figure 90: Middle East and Africa Offshore AUV and ROV Market Volume Share (%), by Vehicle Class 2025 & 2033
- Figure 91: Middle East and Africa Offshore AUV and ROV Market Revenue (Million), by End-user Application 2025 & 2033
- Figure 92: Middle East and Africa Offshore AUV and ROV Market Volume (K Unit), by End-user Application 2025 & 2033
- Figure 93: Middle East and Africa Offshore AUV and ROV Market Revenue Share (%), by End-user Application 2025 & 2033
- Figure 94: Middle East and Africa Offshore AUV and ROV Market Volume Share (%), by End-user Application 2025 & 2033
- Figure 95: Middle East and Africa Offshore AUV and ROV Market Revenue (Million), by Activity 2025 & 2033
- Figure 96: Middle East and Africa Offshore AUV and ROV Market Volume (K Unit), by Activity 2025 & 2033
- Figure 97: Middle East and Africa Offshore AUV and ROV Market Revenue Share (%), by Activity 2025 & 2033
- Figure 98: Middle East and Africa Offshore AUV and ROV Market Volume Share (%), by Activity 2025 & 2033
- Figure 99: Middle East and Africa Offshore AUV and ROV Market Revenue (Million), by Country 2025 & 2033
- Figure 100: Middle East and Africa Offshore AUV and ROV Market Volume (K Unit), by Country 2025 & 2033
- Figure 101: Middle East and Africa Offshore AUV and ROV Market Revenue Share (%), by Country 2025 & 2033
- Figure 102: Middle East and Africa Offshore AUV and ROV Market Volume Share (%), by Country 2025 & 2033
List of Tables
- Table 1: Global Offshore AUV and ROV Market Revenue Million Forecast, by Vehicle Type 2020 & 2033
- Table 2: Global Offshore AUV and ROV Market Volume K Unit Forecast, by Vehicle Type 2020 & 2033
- Table 3: Global Offshore AUV and ROV Market Revenue Million Forecast, by Vehicle Class 2020 & 2033
- Table 4: Global Offshore AUV and ROV Market Volume K Unit Forecast, by Vehicle Class 2020 & 2033
- Table 5: Global Offshore AUV and ROV Market Revenue Million Forecast, by End-user Application 2020 & 2033
- Table 6: Global Offshore AUV and ROV Market Volume K Unit Forecast, by End-user Application 2020 & 2033
- Table 7: Global Offshore AUV and ROV Market Revenue Million Forecast, by Activity 2020 & 2033
- Table 8: Global Offshore AUV and ROV Market Volume K Unit Forecast, by Activity 2020 & 2033
- Table 9: Global Offshore AUV and ROV Market Revenue Million Forecast, by Region 2020 & 2033
- Table 10: Global Offshore AUV and ROV Market Volume K Unit Forecast, by Region 2020 & 2033
- Table 11: Global Offshore AUV and ROV Market Revenue Million Forecast, by Vehicle Type 2020 & 2033
- Table 12: Global Offshore AUV and ROV Market Volume K Unit Forecast, by Vehicle Type 2020 & 2033
- Table 13: Global Offshore AUV and ROV Market Revenue Million Forecast, by Vehicle Class 2020 & 2033
- Table 14: Global Offshore AUV and ROV Market Volume K Unit Forecast, by Vehicle Class 2020 & 2033
- Table 15: Global Offshore AUV and ROV Market Revenue Million Forecast, by End-user Application 2020 & 2033
- Table 16: Global Offshore AUV and ROV Market Volume K Unit Forecast, by End-user Application 2020 & 2033
- Table 17: Global Offshore AUV and ROV Market Revenue Million Forecast, by Activity 2020 & 2033
- Table 18: Global Offshore AUV and ROV Market Volume K Unit Forecast, by Activity 2020 & 2033
- Table 19: Global Offshore AUV and ROV Market Revenue Million Forecast, by Country 2020 & 2033
- Table 20: Global Offshore AUV and ROV Market Volume K Unit Forecast, by Country 2020 & 2033
- Table 21: United States Offshore AUV and ROV Market Revenue (Million) Forecast, by Application 2020 & 2033
- Table 22: United States Offshore AUV and ROV Market Volume (K Unit) Forecast, by Application 2020 & 2033
- Table 23: Canada Offshore AUV and ROV Market Revenue (Million) Forecast, by Application 2020 & 2033
- Table 24: Canada Offshore AUV and ROV Market Volume (K Unit) Forecast, by Application 2020 & 2033
- Table 25: Mexico Offshore AUV and ROV Market Revenue (Million) Forecast, by Application 2020 & 2033
- Table 26: Mexico Offshore AUV and ROV Market Volume (K Unit) Forecast, by Application 2020 & 2033
- Table 27: Global Offshore AUV and ROV Market Revenue Million Forecast, by Vehicle Type 2020 & 2033
- Table 28: Global Offshore AUV and ROV Market Volume K Unit Forecast, by Vehicle Type 2020 & 2033
- Table 29: Global Offshore AUV and ROV Market Revenue Million Forecast, by Vehicle Class 2020 & 2033
- Table 30: Global Offshore AUV and ROV Market Volume K Unit Forecast, by Vehicle Class 2020 & 2033
- Table 31: Global Offshore AUV and ROV Market Revenue Million Forecast, by End-user Application 2020 & 2033
- Table 32: Global Offshore AUV and ROV Market Volume K Unit Forecast, by End-user Application 2020 & 2033
- Table 33: Global Offshore AUV and ROV Market Revenue Million Forecast, by Activity 2020 & 2033
- Table 34: Global Offshore AUV and ROV Market Volume K Unit Forecast, by Activity 2020 & 2033
- Table 35: Global Offshore AUV and ROV Market Revenue Million Forecast, by Country 2020 & 2033
- Table 36: Global Offshore AUV and ROV Market Volume K Unit Forecast, by Country 2020 & 2033
- Table 37: Germany Offshore AUV and ROV Market Revenue (Million) Forecast, by Application 2020 & 2033
- Table 38: Germany Offshore AUV and ROV Market Volume (K Unit) Forecast, by Application 2020 & 2033
- Table 39: United Kingdom Offshore AUV and ROV Market Revenue (Million) Forecast, by Application 2020 & 2033
- Table 40: United Kingdom Offshore AUV and ROV Market Volume (K Unit) Forecast, by Application 2020 & 2033
- Table 41: Denmark Offshore AUV and ROV Market Revenue (Million) Forecast, by Application 2020 & 2033
- Table 42: Denmark Offshore AUV and ROV Market Volume (K Unit) Forecast, by Application 2020 & 2033
- Table 43: Norway Offshore AUV and ROV Market Revenue (Million) Forecast, by Application 2020 & 2033
- Table 44: Norway Offshore AUV and ROV Market Volume (K Unit) Forecast, by Application 2020 & 2033
- Table 45: Russia Offshore AUV and ROV Market Revenue (Million) Forecast, by Application 2020 & 2033
- Table 46: Russia Offshore AUV and ROV Market Volume (K Unit) Forecast, by Application 2020 & 2033
- Table 47: France Offshore AUV and ROV Market Revenue (Million) Forecast, by Application 2020 & 2033
- Table 48: France Offshore AUV and ROV Market Volume (K Unit) Forecast, by Application 2020 & 2033
- Table 49: Rest of Europe Offshore AUV and ROV Market Revenue (Million) Forecast, by Application 2020 & 2033
- Table 50: Rest of Europe Offshore AUV and ROV Market Volume (K Unit) Forecast, by Application 2020 & 2033
- Table 51: Global Offshore AUV and ROV Market Revenue Million Forecast, by Vehicle Type 2020 & 2033
- Table 52: Global Offshore AUV and ROV Market Volume K Unit Forecast, by Vehicle Type 2020 & 2033
- Table 53: Global Offshore AUV and ROV Market Revenue Million Forecast, by Vehicle Class 2020 & 2033
- Table 54: Global Offshore AUV and ROV Market Volume K Unit Forecast, by Vehicle Class 2020 & 2033
- Table 55: Global Offshore AUV and ROV Market Revenue Million Forecast, by End-user Application 2020 & 2033
- Table 56: Global Offshore AUV and ROV Market Volume K Unit Forecast, by End-user Application 2020 & 2033
- Table 57: Global Offshore AUV and ROV Market Revenue Million Forecast, by Activity 2020 & 2033
- Table 58: Global Offshore AUV and ROV Market Volume K Unit Forecast, by Activity 2020 & 2033
- Table 59: Global Offshore AUV and ROV Market Revenue Million Forecast, by Country 2020 & 2033
- Table 60: Global Offshore AUV and ROV Market Volume K Unit Forecast, by Country 2020 & 2033
- Table 61: China Offshore AUV and ROV Market Revenue (Million) Forecast, by Application 2020 & 2033
- Table 62: China Offshore AUV and ROV Market Volume (K Unit) Forecast, by Application 2020 & 2033
- Table 63: India Offshore AUV and ROV Market Revenue (Million) Forecast, by Application 2020 & 2033
- Table 64: India Offshore AUV and ROV Market Volume (K Unit) Forecast, by Application 2020 & 2033
- Table 65: ASEAN Countries Offshore AUV and ROV Market Revenue (Million) Forecast, by Application 2020 & 2033
- Table 66: ASEAN Countries Offshore AUV and ROV Market Volume (K Unit) Forecast, by Application 2020 & 2033
- Table 67: Rest of Asia Pacific Offshore AUV and ROV Market Revenue (Million) Forecast, by Application 2020 & 2033
- Table 68: Rest of Asia Pacific Offshore AUV and ROV Market Volume (K Unit) Forecast, by Application 2020 & 2033
- Table 69: Global Offshore AUV and ROV Market Revenue Million Forecast, by Vehicle Type 2020 & 2033
- Table 70: Global Offshore AUV and ROV Market Volume K Unit Forecast, by Vehicle Type 2020 & 2033
- Table 71: Global Offshore AUV and ROV Market Revenue Million Forecast, by Vehicle Class 2020 & 2033
- Table 72: Global Offshore AUV and ROV Market Volume K Unit Forecast, by Vehicle Class 2020 & 2033
- Table 73: Global Offshore AUV and ROV Market Revenue Million Forecast, by End-user Application 2020 & 2033
- Table 74: Global Offshore AUV and ROV Market Volume K Unit Forecast, by End-user Application 2020 & 2033
- Table 75: Global Offshore AUV and ROV Market Revenue Million Forecast, by Activity 2020 & 2033
- Table 76: Global Offshore AUV and ROV Market Volume K Unit Forecast, by Activity 2020 & 2033
- Table 77: Global Offshore AUV and ROV Market Revenue Million Forecast, by Country 2020 & 2033
- Table 78: Global Offshore AUV and ROV Market Volume K Unit Forecast, by Country 2020 & 2033
- Table 79: Brazil Offshore AUV and ROV Market Revenue (Million) Forecast, by Application 2020 & 2033
- Table 80: Brazil Offshore AUV and ROV Market Volume (K Unit) Forecast, by Application 2020 & 2033
- Table 81: Venezuela Offshore AUV and ROV Market Revenue (Million) Forecast, by Application 2020 & 2033
- Table 82: Venezuela Offshore AUV and ROV Market Volume (K Unit) Forecast, by Application 2020 & 2033
- Table 83: Argentina Offshore AUV and ROV Market Revenue (Million) Forecast, by Application 2020 & 2033
- Table 84: Argentina Offshore AUV and ROV Market Volume (K Unit) Forecast, by Application 2020 & 2033
- Table 85: Colombia Offshore AUV and ROV Market Revenue (Million) Forecast, by Application 2020 & 2033
- Table 86: Colombia Offshore AUV and ROV Market Volume (K Unit) Forecast, by Application 2020 & 2033
- Table 87: Rest of South America Offshore AUV and ROV Market Revenue (Million) Forecast, by Application 2020 & 2033
- Table 88: Rest of South America Offshore AUV and ROV Market Volume (K Unit) Forecast, by Application 2020 & 2033
- Table 89: Global Offshore AUV and ROV Market Revenue Million Forecast, by Vehicle Type 2020 & 2033
- Table 90: Global Offshore AUV and ROV Market Volume K Unit Forecast, by Vehicle Type 2020 & 2033
- Table 91: Global Offshore AUV and ROV Market Revenue Million Forecast, by Vehicle Class 2020 & 2033
- Table 92: Global Offshore AUV and ROV Market Volume K Unit Forecast, by Vehicle Class 2020 & 2033
- Table 93: Global Offshore AUV and ROV Market Revenue Million Forecast, by End-user Application 2020 & 2033
- Table 94: Global Offshore AUV and ROV Market Volume K Unit Forecast, by End-user Application 2020 & 2033
- Table 95: Global Offshore AUV and ROV Market Revenue Million Forecast, by Activity 2020 & 2033
- Table 96: Global Offshore AUV and ROV Market Volume K Unit Forecast, by Activity 2020 & 2033
- Table 97: Global Offshore AUV and ROV Market Revenue Million Forecast, by Country 2020 & 2033
- Table 98: Global Offshore AUV and ROV Market Volume K Unit Forecast, by Country 2020 & 2033
- Table 99: Saudi Arabia Offshore AUV and ROV Market Revenue (Million) Forecast, by Application 2020 & 2033
- Table 100: Saudi Arabia Offshore AUV and ROV Market Volume (K Unit) Forecast, by Application 2020 & 2033
- Table 101: United Arab Emirates Offshore AUV and ROV Market Revenue (Million) Forecast, by Application 2020 & 2033
- Table 102: United Arab Emirates Offshore AUV and ROV Market Volume (K Unit) Forecast, by Application 2020 & 2033
- Table 103: Qatar Offshore AUV and ROV Market Revenue (Million) Forecast, by Application 2020 & 2033
- Table 104: Qatar Offshore AUV and ROV Market Volume (K Unit) Forecast, by Application 2020 & 2033
- Table 105: Nigeria Offshore AUV and ROV Market Revenue (Million) Forecast, by Application 2020 & 2033
- Table 106: Nigeria Offshore AUV and ROV Market Volume (K Unit) Forecast, by Application 2020 & 2033
- Table 107: Rest of Middle East and Africa Offshore AUV and ROV Market Revenue (Million) Forecast, by Application 2020 & 2033
- Table 108: Rest of Middle East and Africa Offshore AUV and ROV Market Volume (K Unit) Forecast, by Application 2020 & 2033
Frequently Asked Questions
1. What is the projected Compound Annual Growth Rate (CAGR) of the Offshore AUV and ROV Market?
The projected CAGR is approximately 7.69%.
2. Which companies are prominent players in the Offshore AUV and ROV Market?
Key companies in the market include DOF Subsea AS, Helix Energy Solutions Group Inc, Fugro NV, Bourbon, Oceaneering International Inc, Saipem SpA, DeepOcean AS, Subsea 7 SA, Teledyne Technologies Incorporated*List Not Exhaustive, TechnipFMC PLC.
3. What are the main segments of the Offshore AUV and ROV Market?
The market segments include Vehicle Type, Vehicle Class, End-user Application, Activity.
4. Can you provide details about the market size?
The market size is estimated to be USD 2.63 Million as of 2022.
5. What are some drivers contributing to market growth?
4.; Increasing Offshore Oil and Gas Exploration Activities in the American. Asia-Pacific. and Middle-East and African Regions4.; Growing Offshore Renewable Technologies.
6. What are the notable trends driving market growth?
Oil and Gas Segment to Dominate the Market.
7. Are there any restraints impacting market growth?
4.; Ban on Offshore Exploration and Production Activities in Multiple Regions.
8. Can you provide examples of recent developments in the market?
Jan 2024: DeepTech won a three-year contract to provide rig support ROV services for BP Plc on the West Nile Delta development offshore Egypt. As part of the contract, two work class ROVs are provided to support the drilling, completion, and subsea activities directly on this long-term contract, which includes an option for further extension.
9. What pricing options are available for accessing the report?
Pricing options include single-user, multi-user, and enterprise licenses priced at USD 4750, USD 5250, and USD 8750 respectively.
10. Is the market size provided in terms of value or volume?
The market size is provided in terms of value, measured in Million and volume, measured in K Unit.
11. Are there any specific market keywords associated with the report?
Yes, the market keyword associated with the report is "Offshore AUV and ROV Market," which aids in identifying and referencing the specific market segment covered.
12. How do I determine which pricing option suits my needs best?
The pricing options vary based on user requirements and access needs. Individual users may opt for single-user licenses, while businesses requiring broader access may choose multi-user or enterprise licenses for cost-effective access to the report.
13. Are there any additional resources or data provided in the Offshore AUV and ROV Market report?
While the report offers comprehensive insights, it's advisable to review the specific contents or supplementary materials provided to ascertain if additional resources or data are available.
14. How can I stay updated on further developments or reports in the Offshore AUV and ROV Market?
To stay informed about further developments, trends, and reports in the Offshore AUV and ROV Market, consider subscribing to industry newsletters, following relevant companies and organizations, or regularly checking reputable industry news sources and publications.
Methodology
Step 1 - Identification of Relevant Samples Size from Population Database


Step 2 - Approaches for Defining Global Market Size (Value, Volume* & Price*)

Note*: In applicable scenarios
Step 3 - Data Sources
Primary Research
- Web Analytics
- Survey Reports
- Research Institute
- Latest Research Reports
- Opinion Leaders
Secondary Research
- Annual Reports
- White Paper
- Latest Press Release
- Industry Association
- Paid Database
- Investor Presentations

Step 4 - Data Triangulation
Involves using different sources of information in order to increase the validity of a study
These sources are likely to be stakeholders in a program - participants, other researchers, program staff, other community members, and so on.
Then we put all data in single framework & apply various statistical tools to find out the dynamic on the market.
During the analysis stage, feedback from the stakeholder groups would be compared to determine areas of agreement as well as areas of divergence