

Key Insights
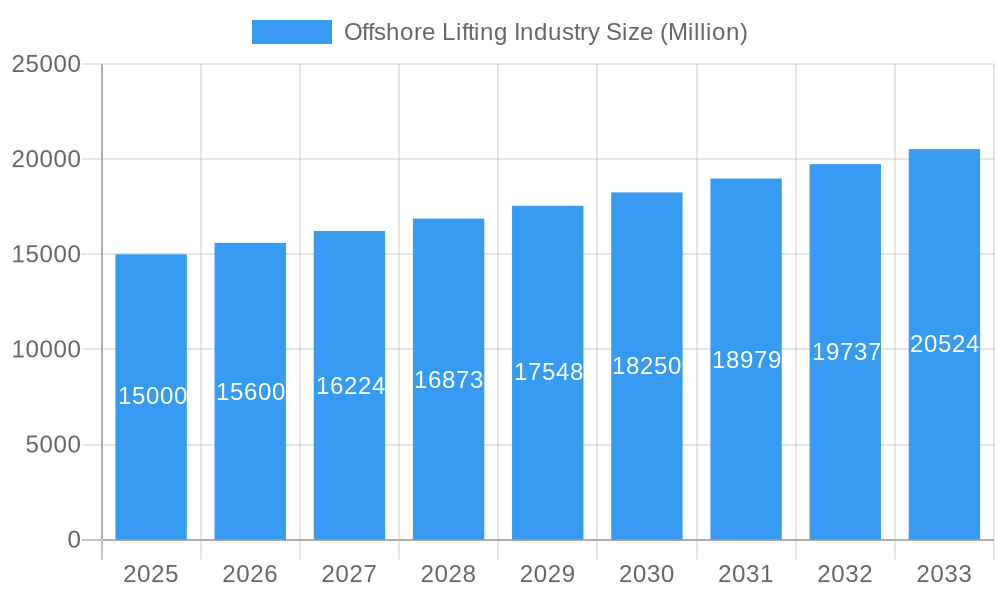
The global offshore lifting market, valued at $26.3 billion in 2025, is poised for substantial expansion, with a projected Compound Annual Growth Rate (CAGR) of 5.8% through 2033. This growth trajectory is propelled by key industry drivers. The rapidly expanding renewable energy sector, specifically offshore wind farm development, drives demand for heavy lifting equipment essential for turbine installation and maintenance. Concurrently, ongoing investments in oil and gas exploration and production continue to fuel market growth. Technological advancements in crane design, featuring enhanced lifting capacities and automation, are optimizing operational efficiency and safety, further stimulating market expansion. The market is segmented by crane type (e.g., offshore, knuckle boom, telescopic), lifting capacity (0-500 MT, 500-2000 MT, 2000-5000 MT, >5000 MT), and application (oil & gas, marine, renewable energy). Key industry participants include Konecranes, Huisman, Liebherr, and Manitowoc. North America and Europe currently dominate market share, supported by established offshore infrastructure and renewable energy initiatives. However, the Asia-Pacific region, particularly China and Southeast Asia, exhibits significant growth potential due to robust investments in offshore wind and port expansion projects.
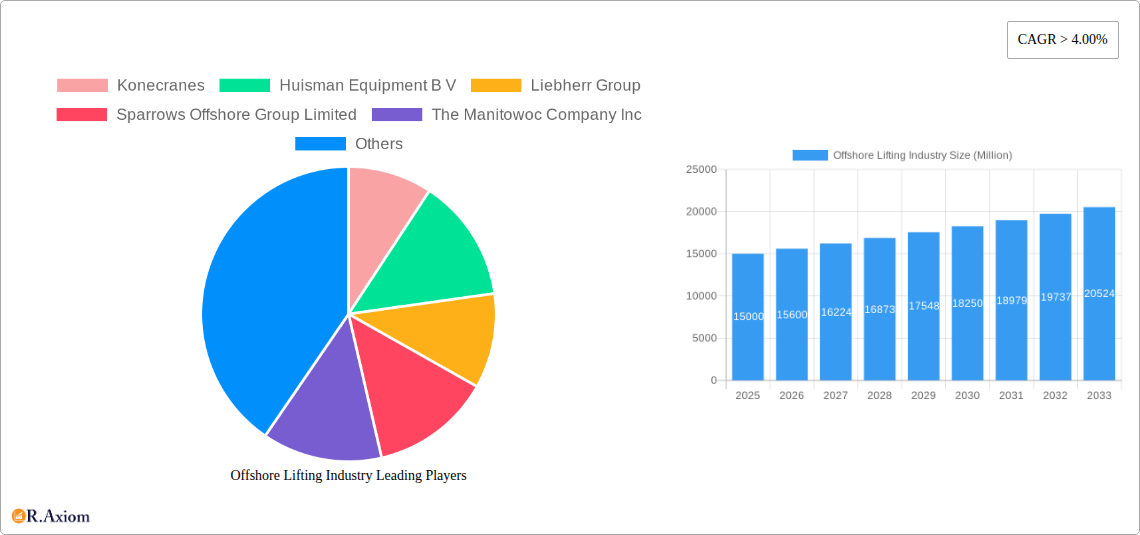
Offshore Lifting Industry Market Size (In Billion)
Market restraints include the volatility of oil prices affecting exploration budgets and the considerable capital expenditure required for advanced offshore lifting equipment. Supply chain disruptions and skilled labor shortages also present challenges. Notwithstanding these factors, the long-term outlook remains optimistic, driven by the sustained growth of renewable energy, continued activity in the oil and gas sector, and ongoing innovation in offshore lifting solutions. The industry anticipates further consolidation among major players, fostering innovation and efficiency. Diversification into emerging sectors such as aquaculture and subsea infrastructure development is broadening the market's growth potential. Geographical expansion into emerging markets with ambitious offshore development plans will also contribute to sustained market expansion.
Offshore Lifting Industry Company Market Share
Offshore Lifting Industry Market Report: 2019-2033
This comprehensive report provides a detailed analysis of the offshore lifting industry, encompassing market size, segmentation, growth drivers, challenges, and future opportunities. The report covers the period 2019-2033, with a focus on the forecast period 2025-2033 and a base year of 2025. It features in-depth analysis of key players, including Konecranes, Huisman Equipment B.V., Liebherr Group, Sparrows Offshore Group Limited, The Manitowoc Company Inc., Seatrax Inc., Cargotec Corporation, Heila Cranes SpA, NOV Inc., and Kenz Figee Group. The market is segmented by crane type (Board offshore cranes, Knuckle Boom Crane, Telescopic Boom Crane, Lattice Boom Crane, Luffing Crane, Others), lifting capacity (0-500 MT, 500-2,000 MT, 2,000-5,000 MT, Above 5,000 MT), and application (Oil and Gas, Marine, Renewable Energy, Other Applications). The report projects a market value of xx Million by 2033, representing a significant growth opportunity for industry stakeholders.
Offshore Lifting Industry Market Concentration & Innovation
The offshore lifting industry exhibits a moderately concentrated market structure, with a few major players holding significant market share. Konecranes, Liebherr Group, and Cargotec Corporation are among the leading players, collectively commanding an estimated xx% of the global market in 2025. However, numerous smaller specialized companies cater to niche segments. Innovation is a key driver, fueled by advancements in lifting technology, automation, and the increasing demand for higher lifting capacities in renewable energy projects. Stringent safety regulations and environmental concerns necessitate continuous innovation in design and operational efficiency.
- Market Share: Top 3 players hold approximately xx% in 2025.
- M&A Activity: The past five years have witnessed xx Million in M&A deals, primarily focused on consolidating smaller players and expanding geographical reach. Examples include [Insert specific examples if available, otherwise use "strategic acquisitions and joint ventures to enhance market presence."].
- Regulatory Frameworks: International Maritime Organization (IMO) regulations and local safety standards significantly influence industry practices.
- Product Substitutes: While direct substitutes are limited, alternative lifting methods, such as specialized vessels and heavy-lift barges, may present some competition.
- End-User Trends: The growing renewable energy sector, particularly offshore wind, is a key driver of demand, pushing for larger lifting capacities and advanced technologies.
Offshore Lifting Industry Industry Trends & Insights
The offshore lifting industry is experiencing robust growth, driven by the expansion of offshore wind energy projects and increasing activity in the oil and gas sector. The market's Compound Annual Growth Rate (CAGR) is projected at xx% from 2025 to 2033. Technological advancements such as electric and hybrid cranes improve efficiency and reduce environmental impact. Market penetration of these technologies is increasing steadily, with xx% adoption expected by 2033. Consumer preference leans toward increased safety, reliability, and reduced operational costs. Competitive dynamics involve ongoing innovation in design, automation, and service offerings. This leads to constant pressure on pricing and requires players to optimize their operations and supply chain management.
Dominant Markets & Segments in Offshore Lifting Industry
The Asia-Pacific region is anticipated to be the dominant market for offshore lifting equipment during the forecast period, driven by significant investments in offshore wind and oil & gas projects in countries such as China and South Korea. Within the segments:
- By Type: Luffing cranes and telescopic boom cranes are expected to experience significant growth due to their versatility and adaptability to various offshore applications. The Lattice Boom Crane segment is predicted to experience slower growth due to its complexity and higher operating costs compared to other crane types.
- By Lifting Capacity: The 500-2,000 MT segment holds the largest market share, driven by increasing demand from the offshore wind industry. The "Above 5,000 MT" segment will exhibit a lower growth rate owing to limited use and high investment costs.
- By Application: The renewable energy segment, particularly offshore wind, is projected to witness the highest growth rate, surpassing the traditional oil and gas sector due to the rapid expansion of wind farms in various countries.
Key Drivers:
- Economic Policies: Government subsidies and incentives for renewable energy projects boost investments and drive demand.
- Infrastructure Development: Significant investments in port infrastructure and supporting services accelerate offshore lifting activities.
- Technological Advancements: Improved crane designs, automation, and digitalization enhance efficiency and reduce operational costs.
Offshore Lifting Industry Product Developments
Recent product innovations focus on enhancing lifting capacity, operational efficiency, and safety. Electric and hybrid-powered cranes are gaining traction, reducing emissions and improving sustainability. Advanced control systems and remote operation capabilities enhance precision and safety. These innovations cater to the growing demand for higher lifting capacities in the offshore wind energy sector and improved safety requirements in oil and gas operations.
Report Scope & Segmentation Analysis
This report provides a comprehensive analysis of the offshore lifting industry segmented by crane type, lifting capacity, and application. Each segment's market size, growth projections, and competitive dynamics are detailed. For instance, the telescopic boom crane segment is projected to experience xx% growth over the forecast period due to its versatility. The oil and gas sector is a major application, while the renewable energy sector shows the fastest growth.
Key Drivers of Offshore Lifting Industry Growth
The industry's growth is fueled by several factors:
- Renewable Energy Expansion: The booming offshore wind power sector is the primary growth driver.
- Technological Advancements: Electric cranes and remote operation enhance safety and efficiency.
- Government Regulations: Stringent safety regulations drive innovation in lifting technology.
Challenges in the Offshore Lifting Industry Sector
Significant challenges include:
- High Initial Investment Costs: The price of advanced cranes can be restrictive for smaller companies.
- Supply Chain Disruptions: Global supply chain challenges impact equipment availability and delivery times.
- Intense Competition: The industry is experiencing increasing competition and pressure to reduce prices.
Emerging Opportunities in Offshore Lifting Industry
Key opportunities include:
- Expansion into Emerging Markets: Growing renewable energy projects in developing nations present significant opportunities.
- Technological Innovation: The development of more advanced and sustainable lifting solutions enhances the industry's future.
- Service-Based Business Models: Providing maintenance and repair services expands revenue streams.
Leading Players in the Offshore Lifting Industry Market
- Konecranes
- Huisman Equipment B.V.
- Liebherr Group
- Sparrows Offshore Group Limited
- The Manitowoc Company Inc.
- Seatrax Inc.
- Cargotec Corporation
- Heila Cranes SpA
- NOV Inc.
- Kenz Figee Group
Key Developments in Offshore Lifting Industry Industry
- November 2021: KenzFigee signed a contract with Iv-Offshore and Energy to develop an electric hydraulic ram luffing offshore crane for the Sofia offshore wind farm.
- February 2022: Sparrows Group secured a three-year contract from Serica Energy for crane operations and maintenance services on the Bruce platform in the North Sea.
Strategic Outlook for Offshore Lifting Industry Market
The offshore lifting industry is poised for continued expansion, driven primarily by the global energy transition and substantial investments in offshore renewable energy. Further technological innovations, particularly in automation and sustainability, will shape future market dynamics. Companies that can adapt to evolving industry needs and successfully navigate regulatory and supply chain challenges will be best positioned for success.
Offshore Lifting Industry Segmentation
-
1. Type
- 1.1. Board offshore cranes
- 1.2. Knuckle Boom Crane
- 1.3. Telescopic Boom Crane
- 1.4. Lattice Boom Crane
- 1.5. Luffing Crane
- 1.6. Others
-
2. Lifting Capacity
- 2.1. 0 - 500 MT
- 2.2. 500 - 2,000 MT
- 2.3. 2,000 - 5,000 MT
- 2.4. Above 5,000 MT
-
3. Application
- 3.1. Oil and Gas
- 3.2. Marine
- 3.3. Renewable Energy
- 3.4. Other Applications
Offshore Lifting Industry Segmentation By Geography
- 1. North America
- 2. Europe
- 3. Asia Pacific
- 4. South America
- 5. Middle East and Africa
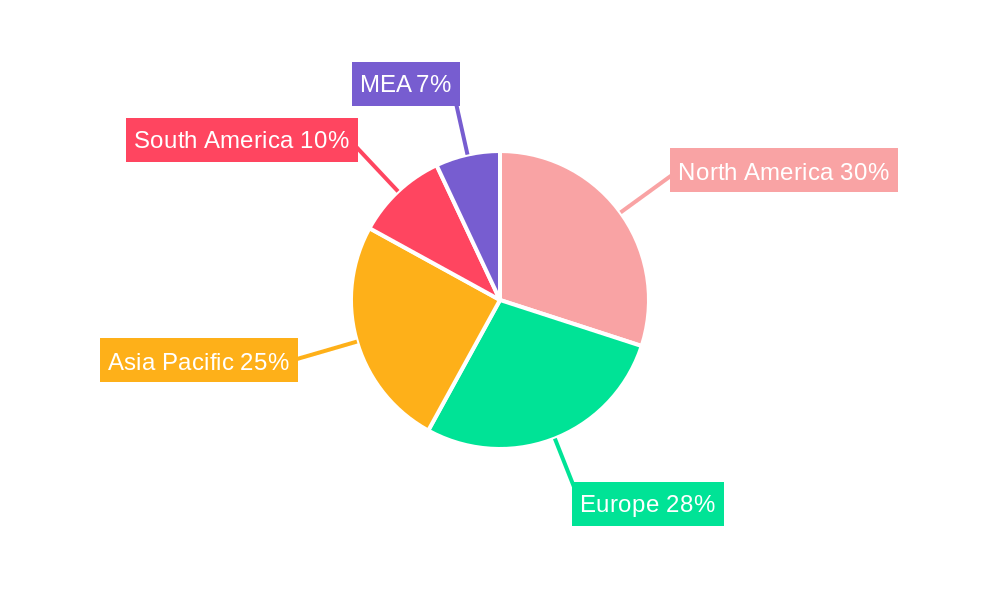
Offshore Lifting Industry Regional Market Share
Geographic Coverage of Offshore Lifting Industry
Offshore Lifting Industry REPORT HIGHLIGHTS
| Aspects | Details |
|---|---|
| Study Period | 2020-2034 |
| Base Year | 2025 |
| Estimated Year | 2026 |
| Forecast Period | 2026-2034 |
| Historical Period | 2020-2025 |
| Growth Rate | CAGR of 5.8% from 2020-2034 |
| Segmentation |
|
Table of Contents
- 1. Introduction
- 1.1. Research Scope
- 1.2. Market Segmentation
- 1.3. Research Objective
- 1.4. Definitions and Assumptions
- 2. Executive Summary
- 2.1. Market Snapshot
- 3. Market Dynamics
- 3.1. Market Drivers
- 3.2. Market Restrains
- 3.3. Market Trends
- 3.4. Market Opportunities
- 4. Market Factor Analysis
- 4.1. Porters Five Forces
- 4.1.1. Bargaining Power of Suppliers
- 4.1.2. Bargaining Power of Buyers
- 4.1.3. Threat of New Entrants
- 4.1.4. Threat of Substitutes
- 4.1.5. Competitive Rivalry
- 4.2. PESTEL analysis
- 4.3. BCG Analysis
- 4.3.1. Stars (High Growth, High Market Share)
- 4.3.2. Cash Cows (Low Growth, High Market Share)
- 4.3.3. Question Mark (High Growth, Low Market Share)
- 4.3.4. Dogs (Low Growth, Low Market Share)
- 4.4. Ansoff Matrix Analysis
- 4.5. Supply Chain Analysis
- 4.6. Regulatory Landscape
- 4.7. Current Market Potential and Opportunity Assessment (TAM–SAM–SOM Framework)
- 4.8. RAX Analyst Note
- 4.1. Porters Five Forces
- 5. Market Analysis, Insights and Forecast 2021-2033
- 5.1. Market Analysis, Insights and Forecast - by Type
- 5.1.1. Board offshore cranes
- 5.1.2. Knuckle Boom Crane
- 5.1.3. Telescopic Boom Crane
- 5.1.4. Lattice Boom Crane
- 5.1.5. Luffing Crane
- 5.1.6. Others
- 5.2. Market Analysis, Insights and Forecast - by Lifting Capacity
- 5.2.1. 0 - 500 MT
- 5.2.2. 500 - 2,000 MT
- 5.2.3. 2,000 - 5,000 MT
- 5.2.4. Above 5,000 MT
- 5.3. Market Analysis, Insights and Forecast - by Application
- 5.3.1. Oil and Gas
- 5.3.2. Marine
- 5.3.3. Renewable Energy
- 5.3.4. Other Applications
- 5.4. Market Analysis, Insights and Forecast - by Region
- 5.4.1. North America
- 5.4.2. Europe
- 5.4.3. Asia Pacific
- 5.4.4. South America
- 5.4.5. Middle East and Africa
- 5.1. Market Analysis, Insights and Forecast - by Type
- 6. Global Offshore Lifting Industry Analysis, Insights and Forecast, 2021-2033
- 6.1. Market Analysis, Insights and Forecast - by Type
- 6.1.1. Board offshore cranes
- 6.1.2. Knuckle Boom Crane
- 6.1.3. Telescopic Boom Crane
- 6.1.4. Lattice Boom Crane
- 6.1.5. Luffing Crane
- 6.1.6. Others
- 6.2. Market Analysis, Insights and Forecast - by Lifting Capacity
- 6.2.1. 0 - 500 MT
- 6.2.2. 500 - 2,000 MT
- 6.2.3. 2,000 - 5,000 MT
- 6.2.4. Above 5,000 MT
- 6.3. Market Analysis, Insights and Forecast - by Application
- 6.3.1. Oil and Gas
- 6.3.2. Marine
- 6.3.3. Renewable Energy
- 6.3.4. Other Applications
- 6.1. Market Analysis, Insights and Forecast - by Type
- 7. North America Offshore Lifting Industry Analysis, Insights and Forecast, 2020-2032
- 7.1. Market Analysis, Insights and Forecast - by Type
- 7.1.1. Board offshore cranes
- 7.1.2. Knuckle Boom Crane
- 7.1.3. Telescopic Boom Crane
- 7.1.4. Lattice Boom Crane
- 7.1.5. Luffing Crane
- 7.1.6. Others
- 7.2. Market Analysis, Insights and Forecast - by Lifting Capacity
- 7.2.1. 0 - 500 MT
- 7.2.2. 500 - 2,000 MT
- 7.2.3. 2,000 - 5,000 MT
- 7.2.4. Above 5,000 MT
- 7.3. Market Analysis, Insights and Forecast - by Application
- 7.3.1. Oil and Gas
- 7.3.2. Marine
- 7.3.3. Renewable Energy
- 7.3.4. Other Applications
- 7.1. Market Analysis, Insights and Forecast - by Type
- 8. Europe Offshore Lifting Industry Analysis, Insights and Forecast, 2020-2032
- 8.1. Market Analysis, Insights and Forecast - by Type
- 8.1.1. Board offshore cranes
- 8.1.2. Knuckle Boom Crane
- 8.1.3. Telescopic Boom Crane
- 8.1.4. Lattice Boom Crane
- 8.1.5. Luffing Crane
- 8.1.6. Others
- 8.2. Market Analysis, Insights and Forecast - by Lifting Capacity
- 8.2.1. 0 - 500 MT
- 8.2.2. 500 - 2,000 MT
- 8.2.3. 2,000 - 5,000 MT
- 8.2.4. Above 5,000 MT
- 8.3. Market Analysis, Insights and Forecast - by Application
- 8.3.1. Oil and Gas
- 8.3.2. Marine
- 8.3.3. Renewable Energy
- 8.3.4. Other Applications
- 8.1. Market Analysis, Insights and Forecast - by Type
- 9. Asia Pacific Offshore Lifting Industry Analysis, Insights and Forecast, 2020-2032
- 9.1. Market Analysis, Insights and Forecast - by Type
- 9.1.1. Board offshore cranes
- 9.1.2. Knuckle Boom Crane
- 9.1.3. Telescopic Boom Crane
- 9.1.4. Lattice Boom Crane
- 9.1.5. Luffing Crane
- 9.1.6. Others
- 9.2. Market Analysis, Insights and Forecast - by Lifting Capacity
- 9.2.1. 0 - 500 MT
- 9.2.2. 500 - 2,000 MT
- 9.2.3. 2,000 - 5,000 MT
- 9.2.4. Above 5,000 MT
- 9.3. Market Analysis, Insights and Forecast - by Application
- 9.3.1. Oil and Gas
- 9.3.2. Marine
- 9.3.3. Renewable Energy
- 9.3.4. Other Applications
- 9.1. Market Analysis, Insights and Forecast - by Type
- 10. South America Offshore Lifting Industry Analysis, Insights and Forecast, 2020-2032
- 10.1. Market Analysis, Insights and Forecast - by Type
- 10.1.1. Board offshore cranes
- 10.1.2. Knuckle Boom Crane
- 10.1.3. Telescopic Boom Crane
- 10.1.4. Lattice Boom Crane
- 10.1.5. Luffing Crane
- 10.1.6. Others
- 10.2. Market Analysis, Insights and Forecast - by Lifting Capacity
- 10.2.1. 0 - 500 MT
- 10.2.2. 500 - 2,000 MT
- 10.2.3. 2,000 - 5,000 MT
- 10.2.4. Above 5,000 MT
- 10.3. Market Analysis, Insights and Forecast - by Application
- 10.3.1. Oil and Gas
- 10.3.2. Marine
- 10.3.3. Renewable Energy
- 10.3.4. Other Applications
- 10.1. Market Analysis, Insights and Forecast - by Type
- 11. Middle East and Africa Offshore Lifting Industry Analysis, Insights and Forecast, 2020-2032
- 11.1. Market Analysis, Insights and Forecast - by Type
- 11.1.1. Board offshore cranes
- 11.1.2. Knuckle Boom Crane
- 11.1.3. Telescopic Boom Crane
- 11.1.4. Lattice Boom Crane
- 11.1.5. Luffing Crane
- 11.1.6. Others
- 11.2. Market Analysis, Insights and Forecast - by Lifting Capacity
- 11.2.1. 0 - 500 MT
- 11.2.2. 500 - 2,000 MT
- 11.2.3. 2,000 - 5,000 MT
- 11.2.4. Above 5,000 MT
- 11.3. Market Analysis, Insights and Forecast - by Application
- 11.3.1. Oil and Gas
- 11.3.2. Marine
- 11.3.3. Renewable Energy
- 11.3.4. Other Applications
- 11.1. Market Analysis, Insights and Forecast - by Type
- 12. Competitive Analysis
- 12.1. Company Profiles
- 12.1.1 Konecranes
- 12.1.1.1. Company Overview
- 12.1.1.2. Products
- 12.1.1.3. Company Financials
- 12.1.1.4. SWOT Analysis
- 12.1.2 Huisman Equipment B V
- 12.1.2.1. Company Overview
- 12.1.2.2. Products
- 12.1.2.3. Company Financials
- 12.1.2.4. SWOT Analysis
- 12.1.3 Liebherr Group
- 12.1.3.1. Company Overview
- 12.1.3.2. Products
- 12.1.3.3. Company Financials
- 12.1.3.4. SWOT Analysis
- 12.1.4 Sparrows Offshore Group Limited
- 12.1.4.1. Company Overview
- 12.1.4.2. Products
- 12.1.4.3. Company Financials
- 12.1.4.4. SWOT Analysis
- 12.1.5 The Manitowoc Company Inc
- 12.1.5.1. Company Overview
- 12.1.5.2. Products
- 12.1.5.3. Company Financials
- 12.1.5.4. SWOT Analysis
- 12.1.6 Seatrax Inc
- 12.1.6.1. Company Overview
- 12.1.6.2. Products
- 12.1.6.3. Company Financials
- 12.1.6.4. SWOT Analysis
- 12.1.7 Cargotec Corporation
- 12.1.7.1. Company Overview
- 12.1.7.2. Products
- 12.1.7.3. Company Financials
- 12.1.7.4. SWOT Analysis
- 12.1.8 Heila Cranes SpA
- 12.1.8.1. Company Overview
- 12.1.8.2. Products
- 12.1.8.3. Company Financials
- 12.1.8.4. SWOT Analysis
- 12.1.9 NOV Inc
- 12.1.9.1. Company Overview
- 12.1.9.2. Products
- 12.1.9.3. Company Financials
- 12.1.9.4. SWOT Analysis
- 12.1.10 Kenz Figee Group
- 12.1.10.1. Company Overview
- 12.1.10.2. Products
- 12.1.10.3. Company Financials
- 12.1.10.4. SWOT Analysis
- 12.1.1 Konecranes
- 12.2. Market Entropy
- 12.2.1 Company's Key Areas Served
- 12.2.2 Recent Developments
- 12.3. Company Market Share Analysis 2025
- 12.3.1 Top 5 Companies Market Share Analysis
- 12.3.2 Top 3 Companies Market Share Analysis
- 12.4. List of Potential Customers
- 13. Research Methodology
List of Figures
- Figure 1: Global Offshore Lifting Industry Revenue Breakdown (billion, %) by Region 2025 & 2033
- Figure 2: North America Offshore Lifting Industry Revenue (billion), by Type 2025 & 2033
- Figure 3: North America Offshore Lifting Industry Revenue Share (%), by Type 2025 & 2033
- Figure 4: North America Offshore Lifting Industry Revenue (billion), by Lifting Capacity 2025 & 2033
- Figure 5: North America Offshore Lifting Industry Revenue Share (%), by Lifting Capacity 2025 & 2033
- Figure 6: North America Offshore Lifting Industry Revenue (billion), by Application 2025 & 2033
- Figure 7: North America Offshore Lifting Industry Revenue Share (%), by Application 2025 & 2033
- Figure 8: North America Offshore Lifting Industry Revenue (billion), by Country 2025 & 2033
- Figure 9: North America Offshore Lifting Industry Revenue Share (%), by Country 2025 & 2033
- Figure 10: Europe Offshore Lifting Industry Revenue (billion), by Type 2025 & 2033
- Figure 11: Europe Offshore Lifting Industry Revenue Share (%), by Type 2025 & 2033
- Figure 12: Europe Offshore Lifting Industry Revenue (billion), by Lifting Capacity 2025 & 2033
- Figure 13: Europe Offshore Lifting Industry Revenue Share (%), by Lifting Capacity 2025 & 2033
- Figure 14: Europe Offshore Lifting Industry Revenue (billion), by Application 2025 & 2033
- Figure 15: Europe Offshore Lifting Industry Revenue Share (%), by Application 2025 & 2033
- Figure 16: Europe Offshore Lifting Industry Revenue (billion), by Country 2025 & 2033
- Figure 17: Europe Offshore Lifting Industry Revenue Share (%), by Country 2025 & 2033
- Figure 18: Asia Pacific Offshore Lifting Industry Revenue (billion), by Type 2025 & 2033
- Figure 19: Asia Pacific Offshore Lifting Industry Revenue Share (%), by Type 2025 & 2033
- Figure 20: Asia Pacific Offshore Lifting Industry Revenue (billion), by Lifting Capacity 2025 & 2033
- Figure 21: Asia Pacific Offshore Lifting Industry Revenue Share (%), by Lifting Capacity 2025 & 2033
- Figure 22: Asia Pacific Offshore Lifting Industry Revenue (billion), by Application 2025 & 2033
- Figure 23: Asia Pacific Offshore Lifting Industry Revenue Share (%), by Application 2025 & 2033
- Figure 24: Asia Pacific Offshore Lifting Industry Revenue (billion), by Country 2025 & 2033
- Figure 25: Asia Pacific Offshore Lifting Industry Revenue Share (%), by Country 2025 & 2033
- Figure 26: South America Offshore Lifting Industry Revenue (billion), by Type 2025 & 2033
- Figure 27: South America Offshore Lifting Industry Revenue Share (%), by Type 2025 & 2033
- Figure 28: South America Offshore Lifting Industry Revenue (billion), by Lifting Capacity 2025 & 2033
- Figure 29: South America Offshore Lifting Industry Revenue Share (%), by Lifting Capacity 2025 & 2033
- Figure 30: South America Offshore Lifting Industry Revenue (billion), by Application 2025 & 2033
- Figure 31: South America Offshore Lifting Industry Revenue Share (%), by Application 2025 & 2033
- Figure 32: South America Offshore Lifting Industry Revenue (billion), by Country 2025 & 2033
- Figure 33: South America Offshore Lifting Industry Revenue Share (%), by Country 2025 & 2033
- Figure 34: Middle East and Africa Offshore Lifting Industry Revenue (billion), by Type 2025 & 2033
- Figure 35: Middle East and Africa Offshore Lifting Industry Revenue Share (%), by Type 2025 & 2033
- Figure 36: Middle East and Africa Offshore Lifting Industry Revenue (billion), by Lifting Capacity 2025 & 2033
- Figure 37: Middle East and Africa Offshore Lifting Industry Revenue Share (%), by Lifting Capacity 2025 & 2033
- Figure 38: Middle East and Africa Offshore Lifting Industry Revenue (billion), by Application 2025 & 2033
- Figure 39: Middle East and Africa Offshore Lifting Industry Revenue Share (%), by Application 2025 & 2033
- Figure 40: Middle East and Africa Offshore Lifting Industry Revenue (billion), by Country 2025 & 2033
- Figure 41: Middle East and Africa Offshore Lifting Industry Revenue Share (%), by Country 2025 & 2033
List of Tables
- Table 1: Global Offshore Lifting Industry Revenue billion Forecast, by Type 2020 & 2033
- Table 2: Global Offshore Lifting Industry Revenue billion Forecast, by Lifting Capacity 2020 & 2033
- Table 3: Global Offshore Lifting Industry Revenue billion Forecast, by Application 2020 & 2033
- Table 4: Global Offshore Lifting Industry Revenue billion Forecast, by Region 2020 & 2033
- Table 5: Global Offshore Lifting Industry Revenue billion Forecast, by Type 2020 & 2033
- Table 6: Global Offshore Lifting Industry Revenue billion Forecast, by Lifting Capacity 2020 & 2033
- Table 7: Global Offshore Lifting Industry Revenue billion Forecast, by Application 2020 & 2033
- Table 8: Global Offshore Lifting Industry Revenue billion Forecast, by Country 2020 & 2033
- Table 9: Global Offshore Lifting Industry Revenue billion Forecast, by Type 2020 & 2033
- Table 10: Global Offshore Lifting Industry Revenue billion Forecast, by Lifting Capacity 2020 & 2033
- Table 11: Global Offshore Lifting Industry Revenue billion Forecast, by Application 2020 & 2033
- Table 12: Global Offshore Lifting Industry Revenue billion Forecast, by Country 2020 & 2033
- Table 13: Global Offshore Lifting Industry Revenue billion Forecast, by Type 2020 & 2033
- Table 14: Global Offshore Lifting Industry Revenue billion Forecast, by Lifting Capacity 2020 & 2033
- Table 15: Global Offshore Lifting Industry Revenue billion Forecast, by Application 2020 & 2033
- Table 16: Global Offshore Lifting Industry Revenue billion Forecast, by Country 2020 & 2033
- Table 17: Global Offshore Lifting Industry Revenue billion Forecast, by Type 2020 & 2033
- Table 18: Global Offshore Lifting Industry Revenue billion Forecast, by Lifting Capacity 2020 & 2033
- Table 19: Global Offshore Lifting Industry Revenue billion Forecast, by Application 2020 & 2033
- Table 20: Global Offshore Lifting Industry Revenue billion Forecast, by Country 2020 & 2033
- Table 21: Global Offshore Lifting Industry Revenue billion Forecast, by Type 2020 & 2033
- Table 22: Global Offshore Lifting Industry Revenue billion Forecast, by Lifting Capacity 2020 & 2033
- Table 23: Global Offshore Lifting Industry Revenue billion Forecast, by Application 2020 & 2033
- Table 24: Global Offshore Lifting Industry Revenue billion Forecast, by Country 2020 & 2033
Frequently Asked Questions
1. What is the projected Compound Annual Growth Rate (CAGR) of the Offshore Lifting Industry?
The projected CAGR is approximately 5.8%.
2. Which companies are prominent players in the Offshore Lifting Industry?
Key companies in the market include Konecranes, Huisman Equipment B V, Liebherr Group, Sparrows Offshore Group Limited, The Manitowoc Company Inc, Seatrax Inc, Cargotec Corporation, Heila Cranes SpA, NOV Inc, Kenz Figee Group.
3. What are the main segments of the Offshore Lifting Industry?
The market segments include Type, Lifting Capacity, Application.
4. Can you provide details about the market size?
The market size is estimated to be USD 26.3 billion as of 2022.
5. What are some drivers contributing to market growth?
Increased Focus on Renewable Power Generation4.; Rising Need for Efficient Power Generation.
6. What are the notable trends driving market growth?
Oil and Gas Segment to Dominate the Market.
7. Are there any restraints impacting market growth?
High Initial Capital Investment.
8. Can you provide examples of recent developments in the market?
In November 2021, KenzFigee signed a contract with Iv-Offshore and Energy to develop an electric hydraulic ram luffing offshore crane. The crane will be installed on an HVDC (High Voltage Direct Current) offshore converter platform on a Sofia offshore wind farm situated on Dogger Bank in the North Sea.
9. What pricing options are available for accessing the report?
Pricing options include single-user, multi-user, and enterprise licenses priced at USD 4750, USD 5250, and USD 8750 respectively.
10. Is the market size provided in terms of value or volume?
The market size is provided in terms of value, measured in billion.
11. Are there any specific market keywords associated with the report?
Yes, the market keyword associated with the report is "Offshore Lifting Industry," which aids in identifying and referencing the specific market segment covered.
12. How do I determine which pricing option suits my needs best?
The pricing options vary based on user requirements and access needs. Individual users may opt for single-user licenses, while businesses requiring broader access may choose multi-user or enterprise licenses for cost-effective access to the report.
13. Are there any additional resources or data provided in the Offshore Lifting Industry report?
While the report offers comprehensive insights, it's advisable to review the specific contents or supplementary materials provided to ascertain if additional resources or data are available.
14. How can I stay updated on further developments or reports in the Offshore Lifting Industry?
To stay informed about further developments, trends, and reports in the Offshore Lifting Industry, consider subscribing to industry newsletters, following relevant companies and organizations, or regularly checking reputable industry news sources and publications.
Methodology
Step 1 - Identification of Relevant Samples Size from Population Database


Step 2 - Approaches for Defining Global Market Size (Value, Volume* & Price*)

Note*: In applicable scenarios
Step 3 - Data Sources
Primary Research
- Web Analytics
- Survey Reports
- Research Institute
- Latest Research Reports
- Opinion Leaders
Secondary Research
- Annual Reports
- White Paper
- Latest Press Release
- Industry Association
- Paid Database
- Investor Presentations

Step 4 - Data Triangulation
Involves using different sources of information in order to increase the validity of a study
These sources are likely to be stakeholders in a program - participants, other researchers, program staff, other community members, and so on.
Then we put all data in single framework & apply various statistical tools to find out the dynamic on the market.
During the analysis stage, feedback from the stakeholder groups would be compared to determine areas of agreement as well as areas of divergence