

Key Insights
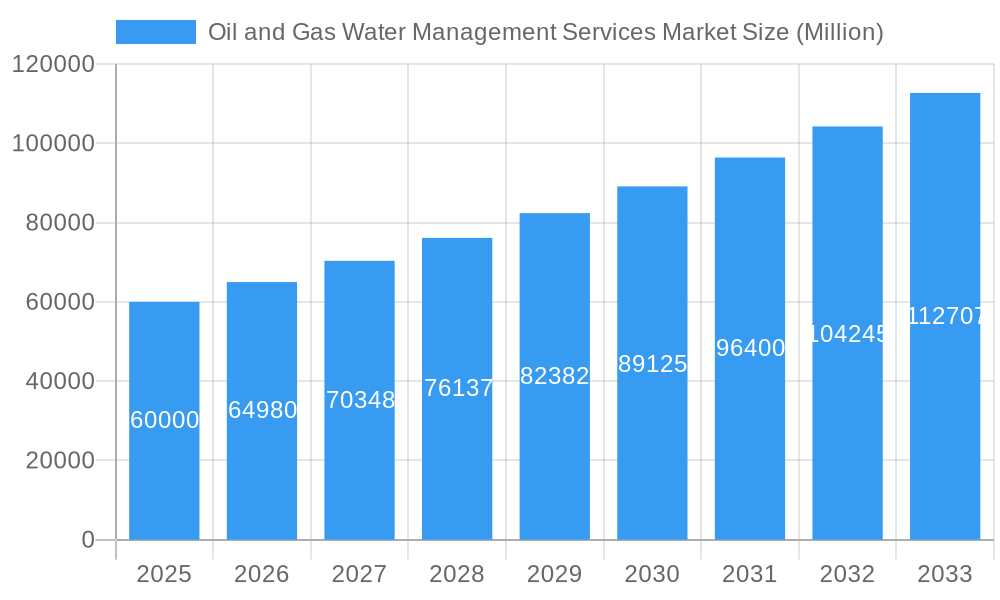
The global Oil and Gas Water Management Services Market is projected for substantial growth, expected to reach $20.79 billion by 2024, with a Compound Annual Growth Rate (CAGR) of 8.6%. This expansion is driven by the increasing demand for unconventional oil and gas extraction, generating significant volumes of produced water. Stringent environmental regulations worldwide are compelling operators to invest in advanced water treatment and disposal solutions. Rising operational costs and the industry's focus on water recycling and reuse further accelerate market development, creating opportunities for innovative service providers.
Oil and Gas Water Management Services Market Market Size (In Billion)
The market is segmented into Upstream, Downstream, and Services, with Water Disposal, Water Hauling, and Produced Water Treatment Services being key sub-segments. North America is anticipated to lead the market due to its extensive unconventional resource plays and regulatory framework. The Asia Pacific region offers significant growth potential, fueled by increasing exploration and production activities. Major players are investing in R&D for integrated solutions. The adoption of advanced technologies like membrane filtration, evaporation, and biological treatment is increasing, indicating a trend towards sustainable and efficient water management practices.
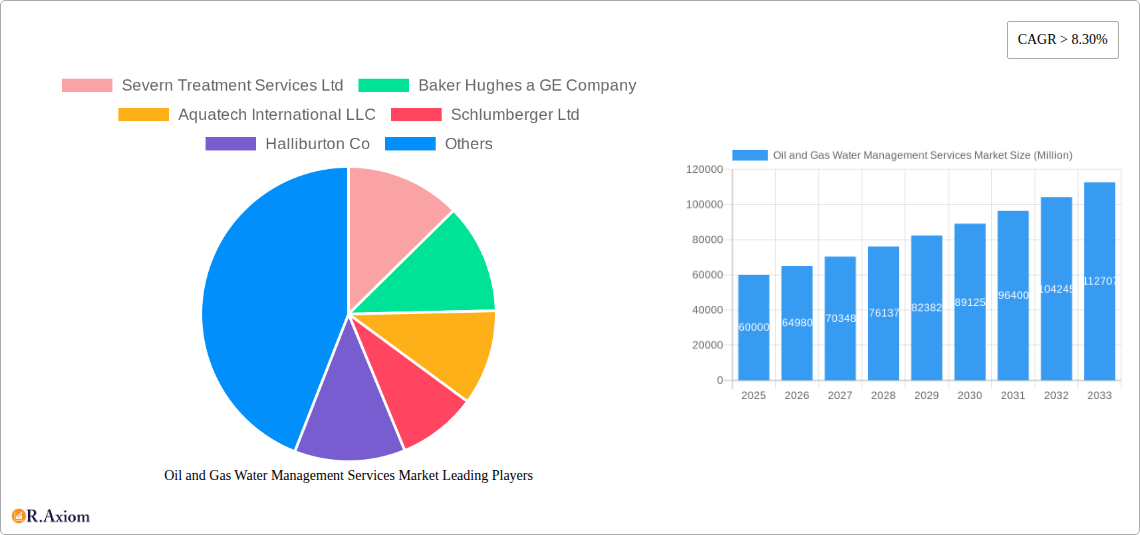
Oil and Gas Water Management Services Market Company Market Share
Oil and Gas Water Management Services Market Market Concentration & Innovation
The Oil and Gas Water Management Services Market exhibits a moderately consolidated landscape, with key players like Baker Hughes a GE Company, Schlumberger Ltd, and Halliburton Co holding significant market share. Innovation is primarily driven by the imperative for enhanced efficiency, reduced environmental impact, and stricter regulatory compliance. Significant investments are being made in advanced treatment technologies for produced water, aiming to maximize recycling and minimize disposal volumes. Regulatory frameworks, particularly those concerning wastewater discharge and the handling of hazardous materials, play a crucial role in shaping market dynamics, compelling companies to adopt more sustainable practices. Product substitutes, such as alternative energy sources that require less water, pose a long-term challenge, but currently, water management remains critical for conventional oil and gas operations. End-user trends are leaning towards integrated solutions, seeking partners who can offer comprehensive water management strategies from extraction to disposal. Mergers and acquisitions are active, with recent M&A deal values often in the tens to hundreds of millions, indicating strategic consolidation and expansion efforts by leading firms to acquire technological capabilities and market reach.
Oil and Gas Water Management Services Market Industry Trends & Insights
The Oil and Gas Water Management Services Market is experiencing robust growth, projected to expand at a compound annual growth rate (CAGR) of approximately 7.8% during the forecast period of 2025–2033. This expansion is fueled by several interconnected trends. Firstly, the increasing complexity of oil and gas extraction, particularly unconventional resources like shale, generates substantial volumes of produced water, demanding sophisticated and cost-effective management solutions. The tightening of environmental regulations across major oil-producing regions globally is a significant growth driver, compelling operators to invest in advanced treatment and disposal technologies to comply with stringent discharge limits and water reuse mandates. Technological disruptions are at the forefront, with innovations in membrane filtration, advanced oxidation processes, and electrochemical treatment significantly improving the efficiency and cost-effectiveness of produced water treatment. The adoption of digital solutions, including IoT sensors and data analytics, is enabling real-time monitoring and optimization of water management operations, leading to enhanced operational efficiency and reduced environmental risks. Consumer preferences are shifting towards operators demonstrating a strong commitment to environmental stewardship and sustainable practices, influencing investment decisions and operational strategies. The competitive dynamics are characterized by an intensifying focus on service integration, with companies offering end-to-end water management solutions, from treatment and recycling to safe disposal and transportation. Market penetration of advanced water treatment technologies is steadily increasing, driven by the dual pressures of resource scarcity and environmental responsibility. The upstream sector, with its high water intensity, remains the dominant segment, but growing interest in downstream water management, particularly for refining and petrochemical operations, is creating new avenues for growth.
Dominant Markets & Segments in Oil and Gas Water Management Services Market
The Upstream Sector consistently dominates the Oil and Gas Water Management Services Market. This dominance is primarily attributed to the substantial volumes of produced water generated during oil and gas exploration and production activities, especially in unconventional resource plays like shale. Economic policies in regions with prolific hydrocarbon reserves, such as North America and the Middle East, incentivize production, directly correlating with increased water management needs. Furthermore, the continuous development of new fields and the aging of existing ones necessitate ongoing water management operations.
Within the Services segment, Water Disposal Services and Produced Water Treatment Services are the most significant contributors. Water Disposal Services are critical due to the sheer volume of water requiring safe and compliant disposal, often involving deep-well injection or evaporation ponds. The robust infrastructure development for these services in established oil-producing regions underpins their market leadership. Produced Water Treatment Services are gaining substantial traction due to the increasing emphasis on water recycling and reuse, driven by water scarcity concerns and environmental regulations. Technologies for treating produced water to suitable quality for reuse in operations or for safe discharge are experiencing rapid advancement and adoption.
Geographically, North America, particularly the United States, remains the leading market due to its extensive shale oil and gas production, which is highly water-intensive. The region benefits from a mature regulatory framework that mandates responsible water management, alongside significant technological innovation and investment. Government initiatives promoting water conservation and the circular economy further bolster the demand for advanced water management solutions. The presence of major oil and gas operators and a well-established service provider ecosystem contribute to its dominance.
Oil and Gas Water Management Services Market Product Developments
Product developments in the Oil and Gas Water Management Services Market are characterized by a focus on enhancing treatment efficiency, reducing operational costs, and minimizing environmental footprints. Innovations in membrane technologies, such as advanced reverse osmosis and nanofiltration systems, are enabling higher water recovery rates and improved water quality for reuse. Mobile and modular treatment units are being developed to offer greater flexibility and faster deployment in remote or rapidly evolving operational sites. The integration of digital solutions, including AI-powered predictive maintenance and real-time water quality monitoring systems, is a significant trend, offering enhanced operational control and cost savings. These developments provide competitive advantages by addressing critical industry needs for sustainability and operational excellence.
Report Scope & Segmentation Analysis
This report comprehensively analyzes the Oil and Gas Water Management Services Market across key segmentations to provide detailed insights into market dynamics and future potential.
Sector: The report segments the market into Upstream and Downstream sectors. The Upstream sector, characterized by exploration and production activities, is anticipated to hold a dominant market share throughout the forecast period due to its inherent high water intensity. The Downstream sector, encompassing refining and petrochemical operations, presents emerging opportunities for growth as these facilities also face water management challenges.
Services: The market is segmented by services offered, including Water Disposal Services, Water Hauling Services, Produced Water Treatment Services, and Others. Produced Water Treatment Services are projected to witness the highest growth rate due to increasing demand for water recycling and reuse. Water Disposal Services will remain a substantial segment, driven by the continuous need for compliant disposal of large water volumes.
Key Drivers of Oil and Gas Water Management Services Market Growth
The growth of the Oil and Gas Water Management Services Market is propelled by a confluence of critical factors. Stringent environmental regulations worldwide are compelling operators to invest in advanced water treatment and disposal solutions to minimize their ecological impact and ensure compliance with discharge standards. The increasing scarcity of freshwater resources in many oil-producing regions is driving the adoption of water recycling and reuse technologies, thereby reducing reliance on freshwater sources. Technological advancements in water treatment processes, such as membrane filtration and chemical treatments, are making water management more efficient and cost-effective. Furthermore, the rising global demand for energy necessitates increased oil and gas production, which in turn generates larger volumes of produced water, directly augmenting the demand for water management services.
Challenges in the Oil and Gas Water Management Services Market Sector
Despite robust growth prospects, the Oil and Gas Water Management Services Market faces several significant challenges. The high capital expenditure associated with advanced water treatment technologies can be a substantial barrier for some operators, especially in a volatile commodity price environment. Furthermore, the complex and often evolving regulatory landscape across different jurisdictions can create compliance hurdles and increase operational costs. Ensuring the safe and efficient transportation of large volumes of water, particularly in remote or challenging terrains, poses logistical and infrastructural challenges. The availability of skilled labor for operating and maintaining sophisticated water management systems is another concern. Competitive pressures from numerous service providers can also lead to pricing challenges and margin erosion.
Emerging Opportunities in Oil and Gas Water Management Services Market
The Oil and Gas Water Management Services Market presents several promising emerging opportunities. The growing focus on the circular economy is driving innovation in water treatment technologies that enable higher rates of water reuse for both operational purposes and potential external applications. The development of more sustainable and less energy-intensive treatment processes is a key trend, attracting investment and creating market niches. The increasing digitalization of operations, through the adoption of AI, IoT, and advanced analytics, offers opportunities for optimizing water management, predicting issues, and enhancing overall efficiency. Furthermore, as offshore exploration and production continue, specialized water management solutions tailored to the unique challenges of offshore environments represent a significant growth area. The expansion into emerging oil and gas markets with developing regulatory frameworks also offers considerable potential.
Leading Players in the Oil and Gas Water Management Services Market Market
- Severn Treatment Services Ltd
- Baker Hughes a GE Company
- Aquatech International LLC
- Schlumberger Ltd
- Halliburton Co
- Nuverra Environmental Solutions
- Veolia Environnement SA
- Granite Construction Inc
- Ovivo Inc
Key Developments in Oil and Gas Water Management Services Market Industry
- 2023: Veolia Environnement SA announced the acquisition of a specialized produced water treatment technology company, enhancing its portfolio of advanced water solutions.
- 2022: Baker Hughes a GE Company launched a new suite of intelligent water management solutions leveraging AI and IoT for optimized performance.
- 2021: Schlumberger Ltd partnered with a leading technology firm to develop innovative solutions for the reuse of produced water in hydraulic fracturing operations.
- 2020: Halliburton Co expanded its water management services in the Permian Basin, investing in new treatment facilities to meet growing demand.
- 2019: Aquatech International LLC secured a major contract for a large-scale produced water treatment plant in the Middle East, highlighting global expansion.
Strategic Outlook for Oil and Gas Water Management Services Market Market
The strategic outlook for the Oil and Gas Water Management Services Market remains exceptionally positive, driven by sustained energy demand and an unwavering commitment to environmental sustainability. Key growth catalysts include continued innovation in cost-effective and high-performance water treatment technologies, particularly those focused on maximizing water recovery and reuse. The increasing integration of digital solutions for operational optimization and predictive maintenance will further enhance efficiency and reduce environmental risks. Strategic partnerships and acquisitions will likely continue to shape the market, as companies aim to expand their service offerings and geographical reach. The growing regulatory pressure and the increasing awareness of water scarcity will ensure that water management remains a critical priority for oil and gas operators, creating enduring opportunities for market participants who can offer reliable, compliant, and innovative solutions.
Oil and Gas Water Management Services Market Segmentation
-
1. Sector
- 1.1. Upstream
- 1.2. Downstream
-
2. Services
- 2.1. Water Disposal Services
- 2.2. Water Hauling Services
- 2.3. Produced Water Treatment Services
- 2.4. Others
Oil and Gas Water Management Services Market Segmentation By Geography
- 1. North America
- 2. Europe
- 3. Asia Pacific
- 4. South America
- 5. Middle East and Africa
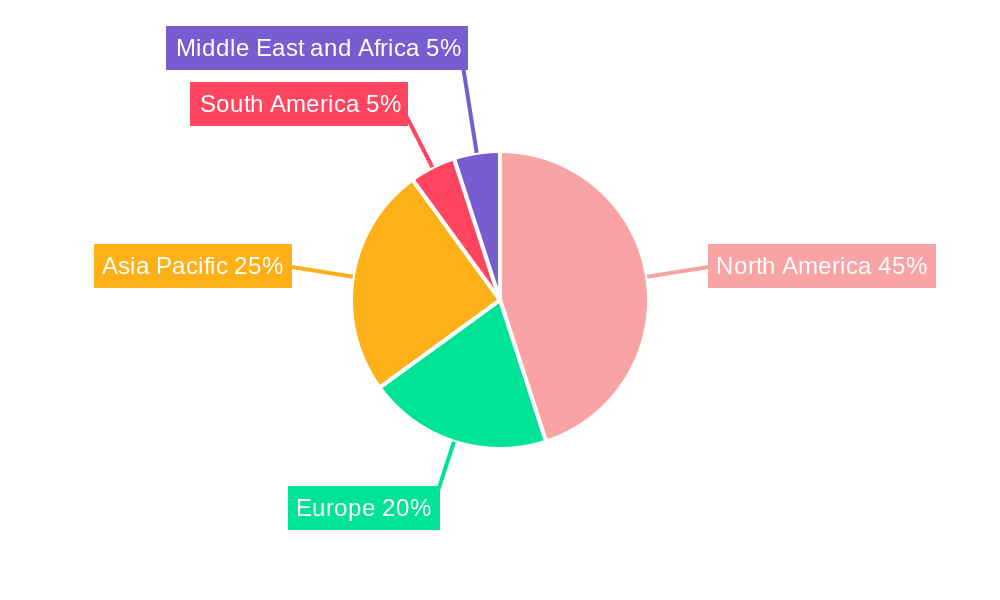
Oil and Gas Water Management Services Market Regional Market Share
Geographic Coverage of Oil and Gas Water Management Services Market
Oil and Gas Water Management Services Market REPORT HIGHLIGHTS
| Aspects | Details |
|---|---|
| Study Period | 2020-2034 |
| Base Year | 2025 |
| Estimated Year | 2026 |
| Forecast Period | 2026-2034 |
| Historical Period | 2020-2025 |
| Growth Rate | CAGR of 8.6% from 2020-2034 |
| Segmentation |
|
Table of Contents
- 1. Introduction
- 1.1. Research Scope
- 1.2. Market Segmentation
- 1.3. Research Objective
- 1.4. Definitions and Assumptions
- 2. Executive Summary
- 2.1. Market Snapshot
- 3. Market Dynamics
- 3.1. Market Drivers
- 3.2. Market Restrains
- 3.3. Market Trends
- 3.4. Market Opportunities
- 4. Market Factor Analysis
- 4.1. Porters Five Forces
- 4.1.1. Bargaining Power of Suppliers
- 4.1.2. Bargaining Power of Buyers
- 4.1.3. Threat of New Entrants
- 4.1.4. Threat of Substitutes
- 4.1.5. Competitive Rivalry
- 4.2. PESTEL analysis
- 4.3. BCG Analysis
- 4.3.1. Stars (High Growth, High Market Share)
- 4.3.2. Cash Cows (Low Growth, High Market Share)
- 4.3.3. Question Mark (High Growth, Low Market Share)
- 4.3.4. Dogs (Low Growth, Low Market Share)
- 4.4. Ansoff Matrix Analysis
- 4.5. Supply Chain Analysis
- 4.6. Regulatory Landscape
- 4.7. Current Market Potential and Opportunity Assessment (TAM–SAM–SOM Framework)
- 4.8. RAX Analyst Note
- 4.1. Porters Five Forces
- 5. Market Analysis, Insights and Forecast 2021-2033
- 5.1. Market Analysis, Insights and Forecast - by Sector
- 5.1.1. Upstream
- 5.1.2. Downstream
- 5.2. Market Analysis, Insights and Forecast - by Services
- 5.2.1. Water Disposal Services
- 5.2.2. Water Hauling Services
- 5.2.3. Produced Water Treatment Services
- 5.2.4. Others
- 5.3. Market Analysis, Insights and Forecast - by Region
- 5.3.1. North America
- 5.3.2. Europe
- 5.3.3. Asia Pacific
- 5.3.4. South America
- 5.3.5. Middle East and Africa
- 5.1. Market Analysis, Insights and Forecast - by Sector
- 6. Global Oil and Gas Water Management Services Market Analysis, Insights and Forecast, 2021-2033
- 6.1. Market Analysis, Insights and Forecast - by Sector
- 6.1.1. Upstream
- 6.1.2. Downstream
- 6.2. Market Analysis, Insights and Forecast - by Services
- 6.2.1. Water Disposal Services
- 6.2.2. Water Hauling Services
- 6.2.3. Produced Water Treatment Services
- 6.2.4. Others
- 6.1. Market Analysis, Insights and Forecast - by Sector
- 7. North America Oil and Gas Water Management Services Market Analysis, Insights and Forecast, 2020-2032
- 7.1. Market Analysis, Insights and Forecast - by Sector
- 7.1.1. Upstream
- 7.1.2. Downstream
- 7.2. Market Analysis, Insights and Forecast - by Services
- 7.2.1. Water Disposal Services
- 7.2.2. Water Hauling Services
- 7.2.3. Produced Water Treatment Services
- 7.2.4. Others
- 7.1. Market Analysis, Insights and Forecast - by Sector
- 8. Europe Oil and Gas Water Management Services Market Analysis, Insights and Forecast, 2020-2032
- 8.1. Market Analysis, Insights and Forecast - by Sector
- 8.1.1. Upstream
- 8.1.2. Downstream
- 8.2. Market Analysis, Insights and Forecast - by Services
- 8.2.1. Water Disposal Services
- 8.2.2. Water Hauling Services
- 8.2.3. Produced Water Treatment Services
- 8.2.4. Others
- 8.1. Market Analysis, Insights and Forecast - by Sector
- 9. Asia Pacific Oil and Gas Water Management Services Market Analysis, Insights and Forecast, 2020-2032
- 9.1. Market Analysis, Insights and Forecast - by Sector
- 9.1.1. Upstream
- 9.1.2. Downstream
- 9.2. Market Analysis, Insights and Forecast - by Services
- 9.2.1. Water Disposal Services
- 9.2.2. Water Hauling Services
- 9.2.3. Produced Water Treatment Services
- 9.2.4. Others
- 9.1. Market Analysis, Insights and Forecast - by Sector
- 10. South America Oil and Gas Water Management Services Market Analysis, Insights and Forecast, 2020-2032
- 10.1. Market Analysis, Insights and Forecast - by Sector
- 10.1.1. Upstream
- 10.1.2. Downstream
- 10.2. Market Analysis, Insights and Forecast - by Services
- 10.2.1. Water Disposal Services
- 10.2.2. Water Hauling Services
- 10.2.3. Produced Water Treatment Services
- 10.2.4. Others
- 10.1. Market Analysis, Insights and Forecast - by Sector
- 11. Middle East and Africa Oil and Gas Water Management Services Market Analysis, Insights and Forecast, 2020-2032
- 11.1. Market Analysis, Insights and Forecast - by Sector
- 11.1.1. Upstream
- 11.1.2. Downstream
- 11.2. Market Analysis, Insights and Forecast - by Services
- 11.2.1. Water Disposal Services
- 11.2.2. Water Hauling Services
- 11.2.3. Produced Water Treatment Services
- 11.2.4. Others
- 11.1. Market Analysis, Insights and Forecast - by Sector
- 12. Competitive Analysis
- 12.1. Company Profiles
- 12.1.1 Severn Treatment Services Ltd
- 12.1.1.1. Company Overview
- 12.1.1.2. Products
- 12.1.1.3. Company Financials
- 12.1.1.4. SWOT Analysis
- 12.1.2 Baker Hughes a GE Company
- 12.1.2.1. Company Overview
- 12.1.2.2. Products
- 12.1.2.3. Company Financials
- 12.1.2.4. SWOT Analysis
- 12.1.3 Aquatech International LLC
- 12.1.3.1. Company Overview
- 12.1.3.2. Products
- 12.1.3.3. Company Financials
- 12.1.3.4. SWOT Analysis
- 12.1.4 Schlumberger Ltd
- 12.1.4.1. Company Overview
- 12.1.4.2. Products
- 12.1.4.3. Company Financials
- 12.1.4.4. SWOT Analysis
- 12.1.5 Halliburton Co
- 12.1.5.1. Company Overview
- 12.1.5.2. Products
- 12.1.5.3. Company Financials
- 12.1.5.4. SWOT Analysis
- 12.1.6 Nuverra Environmental Solutions
- 12.1.6.1. Company Overview
- 12.1.6.2. Products
- 12.1.6.3. Company Financials
- 12.1.6.4. SWOT Analysis
- 12.1.7 Veolia Environnement SA*List Not Exhaustive
- 12.1.7.1. Company Overview
- 12.1.7.2. Products
- 12.1.7.3. Company Financials
- 12.1.7.4. SWOT Analysis
- 12.1.8 Granite Construction Inc
- 12.1.8.1. Company Overview
- 12.1.8.2. Products
- 12.1.8.3. Company Financials
- 12.1.8.4. SWOT Analysis
- 12.1.9 Ovivo Inc
- 12.1.9.1. Company Overview
- 12.1.9.2. Products
- 12.1.9.3. Company Financials
- 12.1.9.4. SWOT Analysis
- 12.1.1 Severn Treatment Services Ltd
- 12.2. Market Entropy
- 12.2.1 Company's Key Areas Served
- 12.2.2 Recent Developments
- 12.3. Company Market Share Analysis 2025
- 12.3.1 Top 5 Companies Market Share Analysis
- 12.3.2 Top 3 Companies Market Share Analysis
- 12.4. List of Potential Customers
- 13. Research Methodology
List of Figures
- Figure 1: Global Oil and Gas Water Management Services Market Revenue Breakdown (billion, %) by Region 2025 & 2033
- Figure 2: North America Oil and Gas Water Management Services Market Revenue (billion), by Sector 2025 & 2033
- Figure 3: North America Oil and Gas Water Management Services Market Revenue Share (%), by Sector 2025 & 2033
- Figure 4: North America Oil and Gas Water Management Services Market Revenue (billion), by Services 2025 & 2033
- Figure 5: North America Oil and Gas Water Management Services Market Revenue Share (%), by Services 2025 & 2033
- Figure 6: North America Oil and Gas Water Management Services Market Revenue (billion), by Country 2025 & 2033
- Figure 7: North America Oil and Gas Water Management Services Market Revenue Share (%), by Country 2025 & 2033
- Figure 8: Europe Oil and Gas Water Management Services Market Revenue (billion), by Sector 2025 & 2033
- Figure 9: Europe Oil and Gas Water Management Services Market Revenue Share (%), by Sector 2025 & 2033
- Figure 10: Europe Oil and Gas Water Management Services Market Revenue (billion), by Services 2025 & 2033
- Figure 11: Europe Oil and Gas Water Management Services Market Revenue Share (%), by Services 2025 & 2033
- Figure 12: Europe Oil and Gas Water Management Services Market Revenue (billion), by Country 2025 & 2033
- Figure 13: Europe Oil and Gas Water Management Services Market Revenue Share (%), by Country 2025 & 2033
- Figure 14: Asia Pacific Oil and Gas Water Management Services Market Revenue (billion), by Sector 2025 & 2033
- Figure 15: Asia Pacific Oil and Gas Water Management Services Market Revenue Share (%), by Sector 2025 & 2033
- Figure 16: Asia Pacific Oil and Gas Water Management Services Market Revenue (billion), by Services 2025 & 2033
- Figure 17: Asia Pacific Oil and Gas Water Management Services Market Revenue Share (%), by Services 2025 & 2033
- Figure 18: Asia Pacific Oil and Gas Water Management Services Market Revenue (billion), by Country 2025 & 2033
- Figure 19: Asia Pacific Oil and Gas Water Management Services Market Revenue Share (%), by Country 2025 & 2033
- Figure 20: South America Oil and Gas Water Management Services Market Revenue (billion), by Sector 2025 & 2033
- Figure 21: South America Oil and Gas Water Management Services Market Revenue Share (%), by Sector 2025 & 2033
- Figure 22: South America Oil and Gas Water Management Services Market Revenue (billion), by Services 2025 & 2033
- Figure 23: South America Oil and Gas Water Management Services Market Revenue Share (%), by Services 2025 & 2033
- Figure 24: South America Oil and Gas Water Management Services Market Revenue (billion), by Country 2025 & 2033
- Figure 25: South America Oil and Gas Water Management Services Market Revenue Share (%), by Country 2025 & 2033
- Figure 26: Middle East and Africa Oil and Gas Water Management Services Market Revenue (billion), by Sector 2025 & 2033
- Figure 27: Middle East and Africa Oil and Gas Water Management Services Market Revenue Share (%), by Sector 2025 & 2033
- Figure 28: Middle East and Africa Oil and Gas Water Management Services Market Revenue (billion), by Services 2025 & 2033
- Figure 29: Middle East and Africa Oil and Gas Water Management Services Market Revenue Share (%), by Services 2025 & 2033
- Figure 30: Middle East and Africa Oil and Gas Water Management Services Market Revenue (billion), by Country 2025 & 2033
- Figure 31: Middle East and Africa Oil and Gas Water Management Services Market Revenue Share (%), by Country 2025 & 2033
List of Tables
- Table 1: Global Oil and Gas Water Management Services Market Revenue billion Forecast, by Sector 2020 & 2033
- Table 2: Global Oil and Gas Water Management Services Market Revenue billion Forecast, by Services 2020 & 2033
- Table 3: Global Oil and Gas Water Management Services Market Revenue billion Forecast, by Region 2020 & 2033
- Table 4: Global Oil and Gas Water Management Services Market Revenue billion Forecast, by Sector 2020 & 2033
- Table 5: Global Oil and Gas Water Management Services Market Revenue billion Forecast, by Services 2020 & 2033
- Table 6: Global Oil and Gas Water Management Services Market Revenue billion Forecast, by Country 2020 & 2033
- Table 7: Global Oil and Gas Water Management Services Market Revenue billion Forecast, by Sector 2020 & 2033
- Table 8: Global Oil and Gas Water Management Services Market Revenue billion Forecast, by Services 2020 & 2033
- Table 9: Global Oil and Gas Water Management Services Market Revenue billion Forecast, by Country 2020 & 2033
- Table 10: Global Oil and Gas Water Management Services Market Revenue billion Forecast, by Sector 2020 & 2033
- Table 11: Global Oil and Gas Water Management Services Market Revenue billion Forecast, by Services 2020 & 2033
- Table 12: Global Oil and Gas Water Management Services Market Revenue billion Forecast, by Country 2020 & 2033
- Table 13: Global Oil and Gas Water Management Services Market Revenue billion Forecast, by Sector 2020 & 2033
- Table 14: Global Oil and Gas Water Management Services Market Revenue billion Forecast, by Services 2020 & 2033
- Table 15: Global Oil and Gas Water Management Services Market Revenue billion Forecast, by Country 2020 & 2033
- Table 16: Global Oil and Gas Water Management Services Market Revenue billion Forecast, by Sector 2020 & 2033
- Table 17: Global Oil and Gas Water Management Services Market Revenue billion Forecast, by Services 2020 & 2033
- Table 18: Global Oil and Gas Water Management Services Market Revenue billion Forecast, by Country 2020 & 2033
Frequently Asked Questions
1. What is the projected Compound Annual Growth Rate (CAGR) of the Oil and Gas Water Management Services Market?
The projected CAGR is approximately 8.6%.
2. Which companies are prominent players in the Oil and Gas Water Management Services Market?
Key companies in the market include Severn Treatment Services Ltd, Baker Hughes a GE Company, Aquatech International LLC, Schlumberger Ltd, Halliburton Co, Nuverra Environmental Solutions, Veolia Environnement SA*List Not Exhaustive, Granite Construction Inc, Ovivo Inc.
3. What are the main segments of the Oil and Gas Water Management Services Market?
The market segments include Sector, Services.
4. Can you provide details about the market size?
The market size is estimated to be USD 20.79 billion as of 2022.
5. What are some drivers contributing to market growth?
4.; Proven Shale Gas Reserves 4.; Technological Advancement in Horizontal Drilling and Hydraulic Fracturing.
6. What are the notable trends driving market growth?
Upstream Sector to Dominate the Market.
7. Are there any restraints impacting market growth?
4.; High Exploration Cost.
8. Can you provide examples of recent developments in the market?
N/A
9. What pricing options are available for accessing the report?
Pricing options include single-user, multi-user, and enterprise licenses priced at USD 4750, USD 5250, and USD 8750 respectively.
10. Is the market size provided in terms of value or volume?
The market size is provided in terms of value, measured in billion.
11. Are there any specific market keywords associated with the report?
Yes, the market keyword associated with the report is "Oil and Gas Water Management Services Market," which aids in identifying and referencing the specific market segment covered.
12. How do I determine which pricing option suits my needs best?
The pricing options vary based on user requirements and access needs. Individual users may opt for single-user licenses, while businesses requiring broader access may choose multi-user or enterprise licenses for cost-effective access to the report.
13. Are there any additional resources or data provided in the Oil and Gas Water Management Services Market report?
While the report offers comprehensive insights, it's advisable to review the specific contents or supplementary materials provided to ascertain if additional resources or data are available.
14. How can I stay updated on further developments or reports in the Oil and Gas Water Management Services Market?
To stay informed about further developments, trends, and reports in the Oil and Gas Water Management Services Market, consider subscribing to industry newsletters, following relevant companies and organizations, or regularly checking reputable industry news sources and publications.
Methodology
Step 1 - Identification of Relevant Samples Size from Population Database


Step 2 - Approaches for Defining Global Market Size (Value, Volume* & Price*)

Note*: In applicable scenarios
Step 3 - Data Sources
Primary Research
- Web Analytics
- Survey Reports
- Research Institute
- Latest Research Reports
- Opinion Leaders
Secondary Research
- Annual Reports
- White Paper
- Latest Press Release
- Industry Association
- Paid Database
- Investor Presentations

Step 4 - Data Triangulation
Involves using different sources of information in order to increase the validity of a study
These sources are likely to be stakeholders in a program - participants, other researchers, program staff, other community members, and so on.
Then we put all data in single framework & apply various statistical tools to find out the dynamic on the market.
During the analysis stage, feedback from the stakeholder groups would be compared to determine areas of agreement as well as areas of divergence