

Key Insights
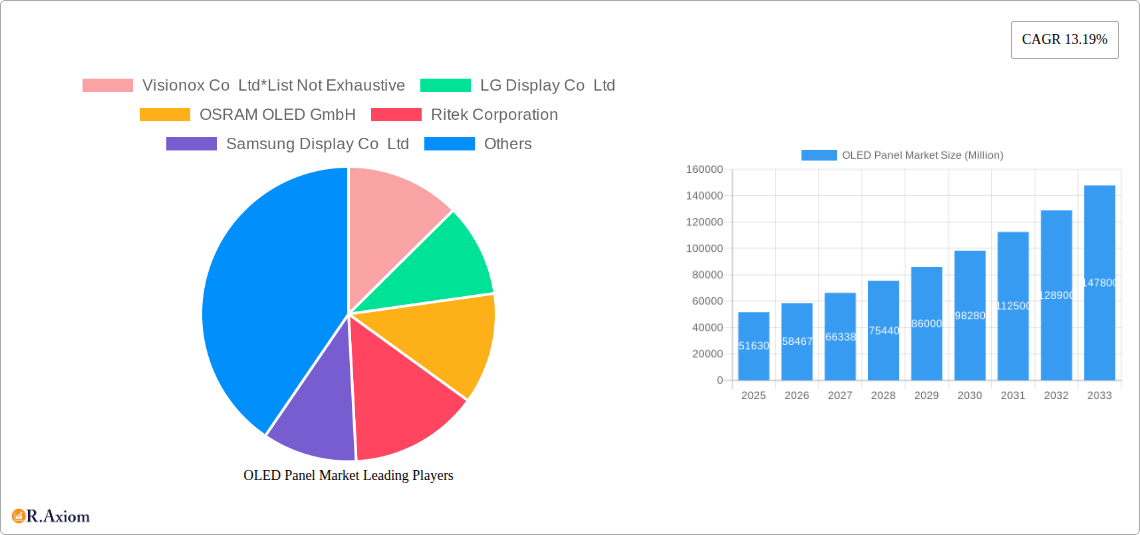
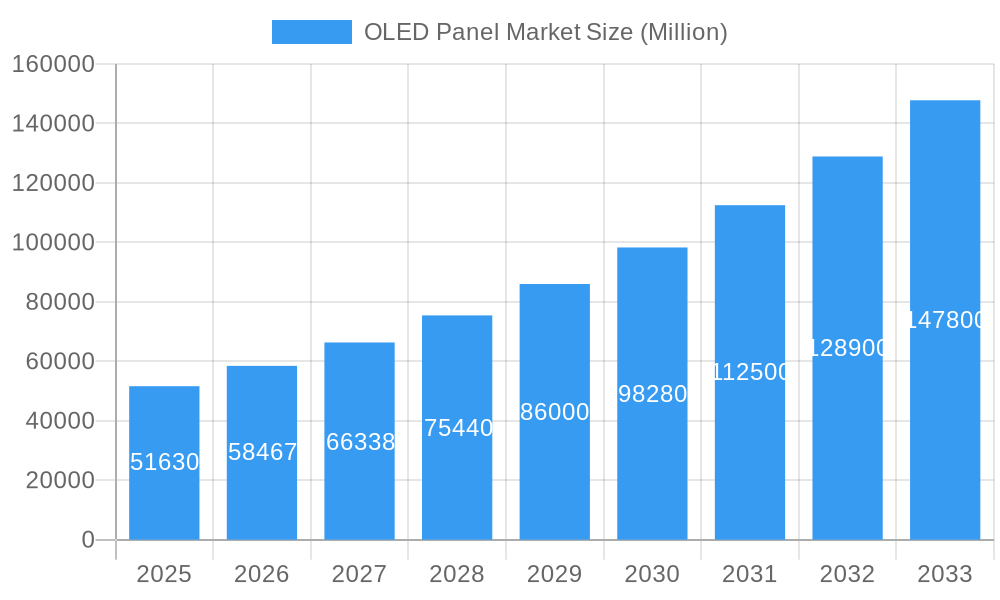
The OLED panel market, valued at $51.63 billion in 2025, is projected to experience robust growth, driven by increasing demand across diverse applications. A Compound Annual Growth Rate (CAGR) of 13.19% from 2025 to 2033 indicates a significant expansion, reaching an estimated market size exceeding $150 billion by 2033. This growth is fueled by several key factors. The rising adoption of OLED technology in high-resolution mobile phones and tablets, coupled with its superior picture quality compared to LCDs, is a primary driver. The automotive sector presents a significant opportunity, with manufacturers increasingly integrating OLED displays into dashboards and infotainment systems for enhanced user experience and safety features. Furthermore, advancements in flexible and transparent OLED technology are opening new avenues in wearable devices and innovative applications within the healthcare and home appliance sectors. Competition among key players like Samsung Display, LG Display, and Visionox is fostering innovation and driving down costs, making OLED technology more accessible.
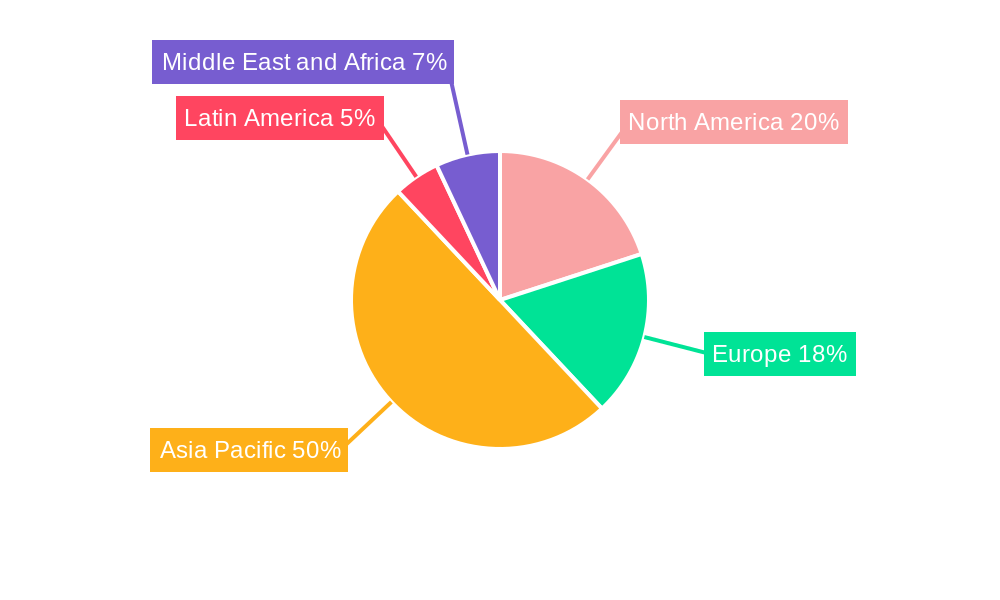
OLED Panel Market Market Size (In Billion)
However, the market faces certain challenges. High manufacturing costs compared to LCD panels remain a significant restraint, especially for larger-sized displays. The dependence on specific raw materials and potential supply chain disruptions could also impact growth. Nevertheless, ongoing research and development efforts focused on improving manufacturing efficiency and exploring alternative materials are mitigating these challenges. Segmentation by size (small, medium, large), product type (mobile, TV, automotive, etc.), display type (flexible, rigid, transparent), and address scheme (AMOLED, PMOLED) offers a comprehensive understanding of the market dynamics and allows for targeted investment strategies within specific niche areas. The Asia-Pacific region is anticipated to dominate the market, driven by high consumer electronics demand and significant manufacturing capabilities in countries like China, South Korea, and Japan.
OLED Panel Market Company Market Share
OLED Panel Market: A Comprehensive Report (2019-2033)
This in-depth report provides a comprehensive analysis of the OLED Panel market, covering the period from 2019 to 2033. It delves into market dynamics, competitive landscapes, technological advancements, and future growth prospects. The report utilizes data from 2019-2024 (historical period) as a baseline, with 2025 serving as the base and estimated year, and forecasts extending to 2033. Market values are expressed in Millions.
OLED Panel Market Market Concentration & Innovation
The OLED panel market exhibits a moderately concentrated structure, with a few major players holding significant market share. LG Display Co Ltd and Samsung Display Co Ltd are prominent leaders, consistently driving innovation and setting industry benchmarks. However, emerging players like Visionox Co Ltd are steadily gaining traction, challenging the established order. Market share fluctuations depend on technological breakthroughs, successful product launches, and strategic partnerships. The market has witnessed several mergers and acquisitions (M&A) in recent years, with deal values ranging from xx Million to xx Million, mostly driven by the desire to secure technological advantages and expand market reach. The regulatory landscape plays a critical role, influencing production costs and market access across various regions. Technological advancements, particularly in flexible displays and improved energy efficiency, are significant drivers of innovation. Meanwhile, the rise of competing technologies like Mini-LED and MicroLED creates a pressure to innovate further and maintain a competitive edge. End-user trends towards higher resolution, larger screen sizes, and foldable devices are shaping market demands and inspiring further innovation.
- Key Metrics:
- LG Display Co Ltd Market Share: xx% (2024)
- Samsung Display Co Ltd Market Share: xx% (2024)
- Average M&A Deal Value: xx Million (2019-2024)
OLED Panel Market Industry Trends & Insights
The OLED panel market is experiencing robust growth, driven by increasing demand from consumer electronics, automotive, and healthcare sectors. The Compound Annual Growth Rate (CAGR) during the forecast period (2025-2033) is projected to be xx%. The market penetration of OLED panels in various applications, such as smartphones and televisions, continues to rise as consumers increasingly value superior image quality, thinner designs, and improved energy efficiency. Technological disruptions, such as the development of flexible and foldable OLED displays, are accelerating market expansion. Consumer preferences are shifting towards higher resolution, larger screen sizes, and seamless integration of displays into various devices. Competitive dynamics involve fierce rivalry amongst established players and the emergence of new entrants who are constantly pushing technological boundaries, resulting in frequent price wars and product differentiations.
Dominant Markets & Segments in OLED Panel Market
The Asia-Pacific region currently holds the largest market share in the OLED panel market, driven by strong manufacturing capabilities and high consumer demand, particularly in countries like China, South Korea, and Japan.
By Size:
- Large-sized OLED panels dominate the market due to their application in televisions and monitors.
- Small-sized panels hold a considerable share, mainly attributed to their use in mobile phones and wearables.
- Medium-sized panels are experiencing moderate growth.
By Product:
- Televisions and mobile/tablet segments are currently the largest revenue generators, but the automotive segment is experiencing significant growth.
- Wearables and other products (lighting, healthcare) are emerging as promising niche markets.
By Type:
- Rigid OLED panels still maintain a larger market share compared to flexible displays, but the flexible segment is growing at a rapid pace.
- Transparent OLED panels are a niche market with significant growth potential.
By Display Address Scheme:
- AMOLED displays dominate the market, owing to their superior performance and color reproduction.
- PMOLED displays maintain a niche share, primarily utilized in low-power applications.
Key Drivers (Regional Dominance):
- Strong manufacturing base and technological expertise.
- High consumer demand and disposable incomes.
- Favorable government policies and investments in the electronics industry.
OLED Panel Market Product Developments
Recent innovations have centered on improving brightness, efficiency, and color accuracy. The introduction of technologies like LG Display's META technology enhances brightness and viewing angles significantly. The development of 77-inch Quantum Dot OLED panels by Samsung Display signals progress in larger screen sizes. These developments highlight the continuous pursuit of superior image quality and wider application possibilities, improving market fit and competitive advantages.
Report Scope & Segmentation Analysis
This report comprehensively analyzes the OLED panel market based on various segments:
By Size: Small-sized, Medium-sized, and Large-sized OLED panels, each with distinct growth projections and market sizes. Competitive dynamics vary across segments, with differing degrees of technological maturity and market competition.
By Product: Mobile and Tablet, Television, Automotive, Wearable, and Other Products (Lighting Products, Healthcare, and Home Appliances), each exhibiting unique market sizes, growth trajectories, and competitive landscapes shaped by application-specific requirements.
By Type: Flexible, Rigid, and Transparent OLED panels, differentiated by their manufacturing processes, cost structures, and market applications. The growth of flexible OLEDs is outpacing rigid counterparts, while transparent OLEDs remain a niche market.
By Display Address Scheme: PMOLED and AMOLED displays, differing in performance characteristics, power consumption, and cost. AMOLED displays are the dominant type in the market.
Key Drivers of OLED Panel Market Growth
The OLED panel market's growth is fueled by several key factors: the increasing demand for high-resolution displays across various applications (smartphones, televisions, automotive dashboards); advancements in OLED technology leading to improved brightness, efficiency, and flexibility; and rising disposable incomes and consumer spending on electronics. Government support and investments in the display industry in several countries further stimulate market growth. The shift toward larger screen sizes and the adoption of foldable devices are additional significant drivers.
Challenges in the OLED Panel Market Sector
The OLED panel market faces challenges, including the relatively high manufacturing cost compared to competing technologies like LCD, supply chain disruptions and raw material price fluctuations, and the intense competition among established players and new entrants. Stringent environmental regulations also pose challenges, necessitating investments in sustainable manufacturing processes. These factors can limit market expansion and profitability if not effectively managed.
Emerging Opportunities in OLED Panel Market
Emerging opportunities abound in the OLED panel market, including the expansion into new applications such as augmented reality (AR) and virtual reality (VR) devices; the growth of foldable and flexible displays; and the development of transparent and micro-LED displays. The increasing demand for high-quality displays in the automotive and healthcare sectors also presents significant growth potential. Exploration of new materials and manufacturing processes offers opportunities for cost reduction and performance enhancement.
Leading Players in the OLED Panel Market Market
- Visionox Co Ltd
- LG Display Co Ltd
- OSRAM OLED GmbH
- Ritek Corporation
- Samsung Display Co Ltd
- Raystar Optronics Inc
- Winstar Display Co Ltd
- Pioneer Corporation
- WiseChip Semiconductor Inc
- Sony Corporation
Key Developments in OLED Panel Market Industry
- January 2023: LG Display unveiled its third-generation OLED TV panel with META Technology, offering 60% brighter images and 30% wider viewing angles.
- January 2023: Samsung Display announced plans to produce a 77-inch Quantum Dot OLED panel for various TV manufacturers.
- June 2022: LG Electronics launched the CineBeam Projector and UltraFine Display OLED in India, showcasing its advancements in projector and monitor technologies.
Strategic Outlook for OLED Panel Market Market
The OLED panel market is poised for significant growth over the next decade. Continuous technological innovation, expansion into new applications, and increasing consumer demand will drive market expansion. Strategic partnerships and investments in research and development will be crucial for companies to maintain their competitive edge. The market’s future potential hinges on navigating supply chain challenges, addressing cost concerns, and adapting to evolving consumer preferences.
OLED Panel Market Segmentation
-
1. Type
- 1.1. Flexible
- 1.2. Rigid
- 1.3. Transparent
-
2. Display Address Scheme
- 2.1. PMOLED Display
- 2.2. AMOLED Display
-
3. Size
- 3.1. Small-sized OLED Panel
- 3.2. Medium-sized OLED Panel
- 3.3. Large-sized OLED Panel
-
4. Product
- 4.1. Mobile and Tablet
- 4.2. Television
- 4.3. Automotive
- 4.4. Wearable
- 4.5. Other Pr
OLED Panel Market Segmentation By Geography
-
1. North America
- 1.1. United States
- 1.2. Canada
-
2. Europe
- 2.1. United Kingdom
- 2.2. Germany
- 2.3. Italy
- 2.4. France
-
3. Asia
- 3.1. China
- 3.2. India
- 3.3. Japan
- 3.4. South Korea
- 4. Australia and New Zealand
-
5. Latin America
- 5.1. Brazil
- 5.2. Mexico
- 6. Middle East and Africa
OLED Panel Market Regional Market Share
Geographic Coverage of OLED Panel Market
OLED Panel Market REPORT HIGHLIGHTS
| Aspects | Details |
|---|---|
| Study Period | 2020-2034 |
| Base Year | 2025 |
| Estimated Year | 2026 |
| Forecast Period | 2026-2034 |
| Historical Period | 2020-2025 |
| Growth Rate | CAGR of 13.19% from 2020-2034 |
| Segmentation |
|
Table of Contents
- 1. Introduction
- 1.1. Research Scope
- 1.2. Market Segmentation
- 1.3. Research Methodology
- 1.4. Definitions and Assumptions
- 2. Executive Summary
- 2.1. Introduction
- 3. Market Dynamics
- 3.1. Introduction
- 3.2. Market Drivers
- 3.2.1. Increasing Adoption of OLEDs in Smartphones; Government Support for the Development of OLED Technology in Various Countries
- 3.3. Market Restrains
- 3.3.1. ; High Cost of Implementation and Maintenance
- 3.4. Market Trends
- 3.4.1. AMOLED Display in Smartphone is Expected to Witness High Growth
- 4. Market Factor Analysis
- 4.1. Porters Five Forces
- 4.2. Supply/Value Chain
- 4.3. PESTEL analysis
- 4.4. Market Entropy
- 4.5. Patent/Trademark Analysis
- 5. Global OLED Panel Market Analysis, Insights and Forecast, 2020-2032
- 5.1. Market Analysis, Insights and Forecast - by Type
- 5.1.1. Flexible
- 5.1.2. Rigid
- 5.1.3. Transparent
- 5.2. Market Analysis, Insights and Forecast - by Display Address Scheme
- 5.2.1. PMOLED Display
- 5.2.2. AMOLED Display
- 5.3. Market Analysis, Insights and Forecast - by Size
- 5.3.1. Small-sized OLED Panel
- 5.3.2. Medium-sized OLED Panel
- 5.3.3. Large-sized OLED Panel
- 5.4. Market Analysis, Insights and Forecast - by Product
- 5.4.1. Mobile and Tablet
- 5.4.2. Television
- 5.4.3. Automotive
- 5.4.4. Wearable
- 5.4.5. Other Pr
- 5.5. Market Analysis, Insights and Forecast - by Region
- 5.5.1. North America
- 5.5.2. Europe
- 5.5.3. Asia
- 5.5.4. Australia and New Zealand
- 5.5.5. Latin America
- 5.5.6. Middle East and Africa
- 5.1. Market Analysis, Insights and Forecast - by Type
- 6. North America OLED Panel Market Analysis, Insights and Forecast, 2020-2032
- 6.1. Market Analysis, Insights and Forecast - by Type
- 6.1.1. Flexible
- 6.1.2. Rigid
- 6.1.3. Transparent
- 6.2. Market Analysis, Insights and Forecast - by Display Address Scheme
- 6.2.1. PMOLED Display
- 6.2.2. AMOLED Display
- 6.3. Market Analysis, Insights and Forecast - by Size
- 6.3.1. Small-sized OLED Panel
- 6.3.2. Medium-sized OLED Panel
- 6.3.3. Large-sized OLED Panel
- 6.4. Market Analysis, Insights and Forecast - by Product
- 6.4.1. Mobile and Tablet
- 6.4.2. Television
- 6.4.3. Automotive
- 6.4.4. Wearable
- 6.4.5. Other Pr
- 6.1. Market Analysis, Insights and Forecast - by Type
- 7. Europe OLED Panel Market Analysis, Insights and Forecast, 2020-2032
- 7.1. Market Analysis, Insights and Forecast - by Type
- 7.1.1. Flexible
- 7.1.2. Rigid
- 7.1.3. Transparent
- 7.2. Market Analysis, Insights and Forecast - by Display Address Scheme
- 7.2.1. PMOLED Display
- 7.2.2. AMOLED Display
- 7.3. Market Analysis, Insights and Forecast - by Size
- 7.3.1. Small-sized OLED Panel
- 7.3.2. Medium-sized OLED Panel
- 7.3.3. Large-sized OLED Panel
- 7.4. Market Analysis, Insights and Forecast - by Product
- 7.4.1. Mobile and Tablet
- 7.4.2. Television
- 7.4.3. Automotive
- 7.4.4. Wearable
- 7.4.5. Other Pr
- 7.1. Market Analysis, Insights and Forecast - by Type
- 8. Asia OLED Panel Market Analysis, Insights and Forecast, 2020-2032
- 8.1. Market Analysis, Insights and Forecast - by Type
- 8.1.1. Flexible
- 8.1.2. Rigid
- 8.1.3. Transparent
- 8.2. Market Analysis, Insights and Forecast - by Display Address Scheme
- 8.2.1. PMOLED Display
- 8.2.2. AMOLED Display
- 8.3. Market Analysis, Insights and Forecast - by Size
- 8.3.1. Small-sized OLED Panel
- 8.3.2. Medium-sized OLED Panel
- 8.3.3. Large-sized OLED Panel
- 8.4. Market Analysis, Insights and Forecast - by Product
- 8.4.1. Mobile and Tablet
- 8.4.2. Television
- 8.4.3. Automotive
- 8.4.4. Wearable
- 8.4.5. Other Pr
- 8.1. Market Analysis, Insights and Forecast - by Type
- 9. Australia and New Zealand OLED Panel Market Analysis, Insights and Forecast, 2020-2032
- 9.1. Market Analysis, Insights and Forecast - by Type
- 9.1.1. Flexible
- 9.1.2. Rigid
- 9.1.3. Transparent
- 9.2. Market Analysis, Insights and Forecast - by Display Address Scheme
- 9.2.1. PMOLED Display
- 9.2.2. AMOLED Display
- 9.3. Market Analysis, Insights and Forecast - by Size
- 9.3.1. Small-sized OLED Panel
- 9.3.2. Medium-sized OLED Panel
- 9.3.3. Large-sized OLED Panel
- 9.4. Market Analysis, Insights and Forecast - by Product
- 9.4.1. Mobile and Tablet
- 9.4.2. Television
- 9.4.3. Automotive
- 9.4.4. Wearable
- 9.4.5. Other Pr
- 9.1. Market Analysis, Insights and Forecast - by Type
- 10. Latin America OLED Panel Market Analysis, Insights and Forecast, 2020-2032
- 10.1. Market Analysis, Insights and Forecast - by Type
- 10.1.1. Flexible
- 10.1.2. Rigid
- 10.1.3. Transparent
- 10.2. Market Analysis, Insights and Forecast - by Display Address Scheme
- 10.2.1. PMOLED Display
- 10.2.2. AMOLED Display
- 10.3. Market Analysis, Insights and Forecast - by Size
- 10.3.1. Small-sized OLED Panel
- 10.3.2. Medium-sized OLED Panel
- 10.3.3. Large-sized OLED Panel
- 10.4. Market Analysis, Insights and Forecast - by Product
- 10.4.1. Mobile and Tablet
- 10.4.2. Television
- 10.4.3. Automotive
- 10.4.4. Wearable
- 10.4.5. Other Pr
- 10.1. Market Analysis, Insights and Forecast - by Type
- 11. Middle East and Africa OLED Panel Market Analysis, Insights and Forecast, 2020-2032
- 11.1. Market Analysis, Insights and Forecast - by Type
- 11.1.1. Flexible
- 11.1.2. Rigid
- 11.1.3. Transparent
- 11.2. Market Analysis, Insights and Forecast - by Display Address Scheme
- 11.2.1. PMOLED Display
- 11.2.2. AMOLED Display
- 11.3. Market Analysis, Insights and Forecast - by Size
- 11.3.1. Small-sized OLED Panel
- 11.3.2. Medium-sized OLED Panel
- 11.3.3. Large-sized OLED Panel
- 11.4. Market Analysis, Insights and Forecast - by Product
- 11.4.1. Mobile and Tablet
- 11.4.2. Television
- 11.4.3. Automotive
- 11.4.4. Wearable
- 11.4.5. Other Pr
- 11.1. Market Analysis, Insights and Forecast - by Type
- 12. Competitive Analysis
- 12.1. Global Market Share Analysis 2025
- 12.2. Company Profiles
- 12.2.1 Visionox Co Ltd*List Not Exhaustive
- 12.2.1.1. Overview
- 12.2.1.2. Products
- 12.2.1.3. SWOT Analysis
- 12.2.1.4. Recent Developments
- 12.2.1.5. Financials (Based on Availability)
- 12.2.2 LG Display Co Ltd
- 12.2.2.1. Overview
- 12.2.2.2. Products
- 12.2.2.3. SWOT Analysis
- 12.2.2.4. Recent Developments
- 12.2.2.5. Financials (Based on Availability)
- 12.2.3 OSRAM OLED GmbH
- 12.2.3.1. Overview
- 12.2.3.2. Products
- 12.2.3.3. SWOT Analysis
- 12.2.3.4. Recent Developments
- 12.2.3.5. Financials (Based on Availability)
- 12.2.4 Ritek Corporation
- 12.2.4.1. Overview
- 12.2.4.2. Products
- 12.2.4.3. SWOT Analysis
- 12.2.4.4. Recent Developments
- 12.2.4.5. Financials (Based on Availability)
- 12.2.5 Samsung Display Co Ltd
- 12.2.5.1. Overview
- 12.2.5.2. Products
- 12.2.5.3. SWOT Analysis
- 12.2.5.4. Recent Developments
- 12.2.5.5. Financials (Based on Availability)
- 12.2.6 Raystar Optronics Inc
- 12.2.6.1. Overview
- 12.2.6.2. Products
- 12.2.6.3. SWOT Analysis
- 12.2.6.4. Recent Developments
- 12.2.6.5. Financials (Based on Availability)
- 12.2.7 Winstar Display Co Ltd
- 12.2.7.1. Overview
- 12.2.7.2. Products
- 12.2.7.3. SWOT Analysis
- 12.2.7.4. Recent Developments
- 12.2.7.5. Financials (Based on Availability)
- 12.2.8 Pioneer Corporation
- 12.2.8.1. Overview
- 12.2.8.2. Products
- 12.2.8.3. SWOT Analysis
- 12.2.8.4. Recent Developments
- 12.2.8.5. Financials (Based on Availability)
- 12.2.9 WiseChip Semiconductor Inc
- 12.2.9.1. Overview
- 12.2.9.2. Products
- 12.2.9.3. SWOT Analysis
- 12.2.9.4. Recent Developments
- 12.2.9.5. Financials (Based on Availability)
- 12.2.10 Sony Corporation
- 12.2.10.1. Overview
- 12.2.10.2. Products
- 12.2.10.3. SWOT Analysis
- 12.2.10.4. Recent Developments
- 12.2.10.5. Financials (Based on Availability)
- 12.2.1 Visionox Co Ltd*List Not Exhaustive
List of Figures
- Figure 1: Global OLED Panel Market Revenue Breakdown (Million, %) by Region 2025 & 2033
- Figure 2: North America OLED Panel Market Revenue (Million), by Type 2025 & 2033
- Figure 3: North America OLED Panel Market Revenue Share (%), by Type 2025 & 2033
- Figure 4: North America OLED Panel Market Revenue (Million), by Display Address Scheme 2025 & 2033
- Figure 5: North America OLED Panel Market Revenue Share (%), by Display Address Scheme 2025 & 2033
- Figure 6: North America OLED Panel Market Revenue (Million), by Size 2025 & 2033
- Figure 7: North America OLED Panel Market Revenue Share (%), by Size 2025 & 2033
- Figure 8: North America OLED Panel Market Revenue (Million), by Product 2025 & 2033
- Figure 9: North America OLED Panel Market Revenue Share (%), by Product 2025 & 2033
- Figure 10: North America OLED Panel Market Revenue (Million), by Country 2025 & 2033
- Figure 11: North America OLED Panel Market Revenue Share (%), by Country 2025 & 2033
- Figure 12: Europe OLED Panel Market Revenue (Million), by Type 2025 & 2033
- Figure 13: Europe OLED Panel Market Revenue Share (%), by Type 2025 & 2033
- Figure 14: Europe OLED Panel Market Revenue (Million), by Display Address Scheme 2025 & 2033
- Figure 15: Europe OLED Panel Market Revenue Share (%), by Display Address Scheme 2025 & 2033
- Figure 16: Europe OLED Panel Market Revenue (Million), by Size 2025 & 2033
- Figure 17: Europe OLED Panel Market Revenue Share (%), by Size 2025 & 2033
- Figure 18: Europe OLED Panel Market Revenue (Million), by Product 2025 & 2033
- Figure 19: Europe OLED Panel Market Revenue Share (%), by Product 2025 & 2033
- Figure 20: Europe OLED Panel Market Revenue (Million), by Country 2025 & 2033
- Figure 21: Europe OLED Panel Market Revenue Share (%), by Country 2025 & 2033
- Figure 22: Asia OLED Panel Market Revenue (Million), by Type 2025 & 2033
- Figure 23: Asia OLED Panel Market Revenue Share (%), by Type 2025 & 2033
- Figure 24: Asia OLED Panel Market Revenue (Million), by Display Address Scheme 2025 & 2033
- Figure 25: Asia OLED Panel Market Revenue Share (%), by Display Address Scheme 2025 & 2033
- Figure 26: Asia OLED Panel Market Revenue (Million), by Size 2025 & 2033
- Figure 27: Asia OLED Panel Market Revenue Share (%), by Size 2025 & 2033
- Figure 28: Asia OLED Panel Market Revenue (Million), by Product 2025 & 2033
- Figure 29: Asia OLED Panel Market Revenue Share (%), by Product 2025 & 2033
- Figure 30: Asia OLED Panel Market Revenue (Million), by Country 2025 & 2033
- Figure 31: Asia OLED Panel Market Revenue Share (%), by Country 2025 & 2033
- Figure 32: Australia and New Zealand OLED Panel Market Revenue (Million), by Type 2025 & 2033
- Figure 33: Australia and New Zealand OLED Panel Market Revenue Share (%), by Type 2025 & 2033
- Figure 34: Australia and New Zealand OLED Panel Market Revenue (Million), by Display Address Scheme 2025 & 2033
- Figure 35: Australia and New Zealand OLED Panel Market Revenue Share (%), by Display Address Scheme 2025 & 2033
- Figure 36: Australia and New Zealand OLED Panel Market Revenue (Million), by Size 2025 & 2033
- Figure 37: Australia and New Zealand OLED Panel Market Revenue Share (%), by Size 2025 & 2033
- Figure 38: Australia and New Zealand OLED Panel Market Revenue (Million), by Product 2025 & 2033
- Figure 39: Australia and New Zealand OLED Panel Market Revenue Share (%), by Product 2025 & 2033
- Figure 40: Australia and New Zealand OLED Panel Market Revenue (Million), by Country 2025 & 2033
- Figure 41: Australia and New Zealand OLED Panel Market Revenue Share (%), by Country 2025 & 2033
- Figure 42: Latin America OLED Panel Market Revenue (Million), by Type 2025 & 2033
- Figure 43: Latin America OLED Panel Market Revenue Share (%), by Type 2025 & 2033
- Figure 44: Latin America OLED Panel Market Revenue (Million), by Display Address Scheme 2025 & 2033
- Figure 45: Latin America OLED Panel Market Revenue Share (%), by Display Address Scheme 2025 & 2033
- Figure 46: Latin America OLED Panel Market Revenue (Million), by Size 2025 & 2033
- Figure 47: Latin America OLED Panel Market Revenue Share (%), by Size 2025 & 2033
- Figure 48: Latin America OLED Panel Market Revenue (Million), by Product 2025 & 2033
- Figure 49: Latin America OLED Panel Market Revenue Share (%), by Product 2025 & 2033
- Figure 50: Latin America OLED Panel Market Revenue (Million), by Country 2025 & 2033
- Figure 51: Latin America OLED Panel Market Revenue Share (%), by Country 2025 & 2033
- Figure 52: Middle East and Africa OLED Panel Market Revenue (Million), by Type 2025 & 2033
- Figure 53: Middle East and Africa OLED Panel Market Revenue Share (%), by Type 2025 & 2033
- Figure 54: Middle East and Africa OLED Panel Market Revenue (Million), by Display Address Scheme 2025 & 2033
- Figure 55: Middle East and Africa OLED Panel Market Revenue Share (%), by Display Address Scheme 2025 & 2033
- Figure 56: Middle East and Africa OLED Panel Market Revenue (Million), by Size 2025 & 2033
- Figure 57: Middle East and Africa OLED Panel Market Revenue Share (%), by Size 2025 & 2033
- Figure 58: Middle East and Africa OLED Panel Market Revenue (Million), by Product 2025 & 2033
- Figure 59: Middle East and Africa OLED Panel Market Revenue Share (%), by Product 2025 & 2033
- Figure 60: Middle East and Africa OLED Panel Market Revenue (Million), by Country 2025 & 2033
- Figure 61: Middle East and Africa OLED Panel Market Revenue Share (%), by Country 2025 & 2033
List of Tables
- Table 1: Global OLED Panel Market Revenue Million Forecast, by Type 2020 & 2033
- Table 2: Global OLED Panel Market Revenue Million Forecast, by Display Address Scheme 2020 & 2033
- Table 3: Global OLED Panel Market Revenue Million Forecast, by Size 2020 & 2033
- Table 4: Global OLED Panel Market Revenue Million Forecast, by Product 2020 & 2033
- Table 5: Global OLED Panel Market Revenue Million Forecast, by Region 2020 & 2033
- Table 6: Global OLED Panel Market Revenue Million Forecast, by Type 2020 & 2033
- Table 7: Global OLED Panel Market Revenue Million Forecast, by Display Address Scheme 2020 & 2033
- Table 8: Global OLED Panel Market Revenue Million Forecast, by Size 2020 & 2033
- Table 9: Global OLED Panel Market Revenue Million Forecast, by Product 2020 & 2033
- Table 10: Global OLED Panel Market Revenue Million Forecast, by Country 2020 & 2033
- Table 11: United States OLED Panel Market Revenue (Million) Forecast, by Application 2020 & 2033
- Table 12: Canada OLED Panel Market Revenue (Million) Forecast, by Application 2020 & 2033
- Table 13: Global OLED Panel Market Revenue Million Forecast, by Type 2020 & 2033
- Table 14: Global OLED Panel Market Revenue Million Forecast, by Display Address Scheme 2020 & 2033
- Table 15: Global OLED Panel Market Revenue Million Forecast, by Size 2020 & 2033
- Table 16: Global OLED Panel Market Revenue Million Forecast, by Product 2020 & 2033
- Table 17: Global OLED Panel Market Revenue Million Forecast, by Country 2020 & 2033
- Table 18: United Kingdom OLED Panel Market Revenue (Million) Forecast, by Application 2020 & 2033
- Table 19: Germany OLED Panel Market Revenue (Million) Forecast, by Application 2020 & 2033
- Table 20: Italy OLED Panel Market Revenue (Million) Forecast, by Application 2020 & 2033
- Table 21: France OLED Panel Market Revenue (Million) Forecast, by Application 2020 & 2033
- Table 22: Global OLED Panel Market Revenue Million Forecast, by Type 2020 & 2033
- Table 23: Global OLED Panel Market Revenue Million Forecast, by Display Address Scheme 2020 & 2033
- Table 24: Global OLED Panel Market Revenue Million Forecast, by Size 2020 & 2033
- Table 25: Global OLED Panel Market Revenue Million Forecast, by Product 2020 & 2033
- Table 26: Global OLED Panel Market Revenue Million Forecast, by Country 2020 & 2033
- Table 27: China OLED Panel Market Revenue (Million) Forecast, by Application 2020 & 2033
- Table 28: India OLED Panel Market Revenue (Million) Forecast, by Application 2020 & 2033
- Table 29: Japan OLED Panel Market Revenue (Million) Forecast, by Application 2020 & 2033
- Table 30: South Korea OLED Panel Market Revenue (Million) Forecast, by Application 2020 & 2033
- Table 31: Global OLED Panel Market Revenue Million Forecast, by Type 2020 & 2033
- Table 32: Global OLED Panel Market Revenue Million Forecast, by Display Address Scheme 2020 & 2033
- Table 33: Global OLED Panel Market Revenue Million Forecast, by Size 2020 & 2033
- Table 34: Global OLED Panel Market Revenue Million Forecast, by Product 2020 & 2033
- Table 35: Global OLED Panel Market Revenue Million Forecast, by Country 2020 & 2033
- Table 36: Global OLED Panel Market Revenue Million Forecast, by Type 2020 & 2033
- Table 37: Global OLED Panel Market Revenue Million Forecast, by Display Address Scheme 2020 & 2033
- Table 38: Global OLED Panel Market Revenue Million Forecast, by Size 2020 & 2033
- Table 39: Global OLED Panel Market Revenue Million Forecast, by Product 2020 & 2033
- Table 40: Global OLED Panel Market Revenue Million Forecast, by Country 2020 & 2033
- Table 41: Brazil OLED Panel Market Revenue (Million) Forecast, by Application 2020 & 2033
- Table 42: Mexico OLED Panel Market Revenue (Million) Forecast, by Application 2020 & 2033
- Table 43: Global OLED Panel Market Revenue Million Forecast, by Type 2020 & 2033
- Table 44: Global OLED Panel Market Revenue Million Forecast, by Display Address Scheme 2020 & 2033
- Table 45: Global OLED Panel Market Revenue Million Forecast, by Size 2020 & 2033
- Table 46: Global OLED Panel Market Revenue Million Forecast, by Product 2020 & 2033
- Table 47: Global OLED Panel Market Revenue Million Forecast, by Country 2020 & 2033
Frequently Asked Questions
1. What is the projected Compound Annual Growth Rate (CAGR) of the OLED Panel Market?
The projected CAGR is approximately 13.19%.
2. Which companies are prominent players in the OLED Panel Market?
Key companies in the market include Visionox Co Ltd*List Not Exhaustive, LG Display Co Ltd, OSRAM OLED GmbH, Ritek Corporation, Samsung Display Co Ltd, Raystar Optronics Inc, Winstar Display Co Ltd, Pioneer Corporation, WiseChip Semiconductor Inc, Sony Corporation.
3. What are the main segments of the OLED Panel Market?
The market segments include Type, Display Address Scheme, Size, Product.
4. Can you provide details about the market size?
The market size is estimated to be USD 51.63 Million as of 2022.
5. What are some drivers contributing to market growth?
Increasing Adoption of OLEDs in Smartphones; Government Support for the Development of OLED Technology in Various Countries.
6. What are the notable trends driving market growth?
AMOLED Display in Smartphone is Expected to Witness High Growth.
7. Are there any restraints impacting market growth?
; High Cost of Implementation and Maintenance.
8. Can you provide examples of recent developments in the market?
January 2023: At CES 2023, LG Display, a pioneer in display technology, unveiled the third-generation OLED TV panel. The latest OLED TV panel from the manufacturer, based on "META Technology," offers the best possible image quality. The company's most recent OLED displays utilize META Technology to produce pictures that are 60% brighter than those produced by standard OLED productions and with viewing angles that are 30% broader.
9. What pricing options are available for accessing the report?
Pricing options include single-user, multi-user, and enterprise licenses priced at USD 4750, USD 5250, and USD 8750 respectively.
10. Is the market size provided in terms of value or volume?
The market size is provided in terms of value, measured in Million.
11. Are there any specific market keywords associated with the report?
Yes, the market keyword associated with the report is "OLED Panel Market," which aids in identifying and referencing the specific market segment covered.
12. How do I determine which pricing option suits my needs best?
The pricing options vary based on user requirements and access needs. Individual users may opt for single-user licenses, while businesses requiring broader access may choose multi-user or enterprise licenses for cost-effective access to the report.
13. Are there any additional resources or data provided in the OLED Panel Market report?
While the report offers comprehensive insights, it's advisable to review the specific contents or supplementary materials provided to ascertain if additional resources or data are available.
14. How can I stay updated on further developments or reports in the OLED Panel Market?
To stay informed about further developments, trends, and reports in the OLED Panel Market, consider subscribing to industry newsletters, following relevant companies and organizations, or regularly checking reputable industry news sources and publications.
Methodology
Step 1 - Identification of Relevant Samples Size from Population Database


Step 2 - Approaches for Defining Global Market Size (Value, Volume* & Price*)

Note*: In applicable scenarios
Step 3 - Data Sources
Primary Research
- Web Analytics
- Survey Reports
- Research Institute
- Latest Research Reports
- Opinion Leaders
Secondary Research
- Annual Reports
- White Paper
- Latest Press Release
- Industry Association
- Paid Database
- Investor Presentations

Step 4 - Data Triangulation
Involves using different sources of information in order to increase the validity of a study
These sources are likely to be stakeholders in a program - participants, other researchers, program staff, other community members, and so on.
Then we put all data in single framework & apply various statistical tools to find out the dynamic on the market.
During the analysis stage, feedback from the stakeholder groups would be compared to determine areas of agreement as well as areas of divergence