

Key Insights
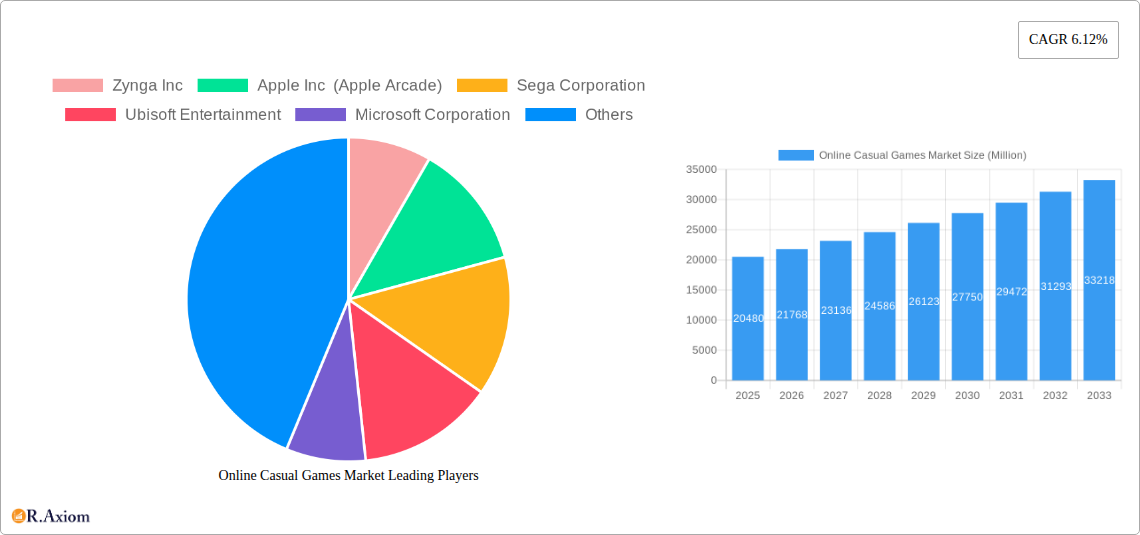
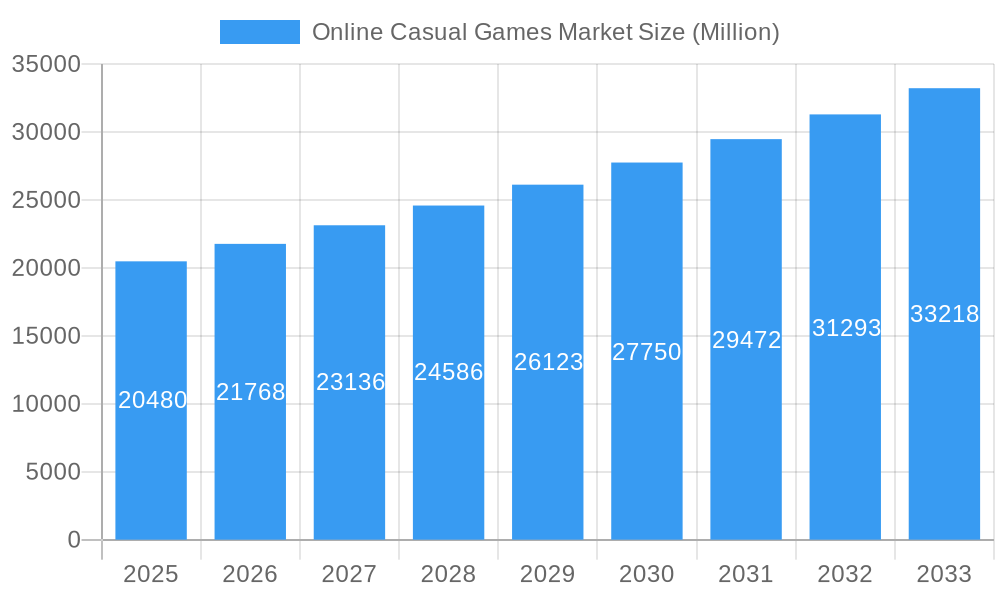
The online casual games market is experiencing robust growth, projected to reach \$20.48 billion in 2025 and exhibiting a Compound Annual Growth Rate (CAGR) of 6.12% from 2025 to 2033. This expansion is fueled by several key drivers. The increasing affordability and accessibility of smartphones and tablets are making casual games readily available to a broader audience, particularly in emerging markets. Furthermore, the rise of free-to-play models with in-app purchases has created a lucrative revenue stream, attracting both developers and players. The integration of social features, enabling players to compete and connect with friends, enhances engagement and encourages continued play. Popular genres like puzzle, word, and hyper-casual games continue to dominate the market, benefiting from their ease of access and short play sessions, aligning perfectly with the busy lifestyles of modern consumers. However, challenges remain. Increasing competition among developers necessitates continuous innovation to retain player engagement and attract new users. Maintaining a balance between monetization strategies and player experience is crucial to avoid alienating the user base. The market is segmented by monetization model (advertising, in-app purchases, and paid apps), reflecting the diverse approaches developers employ to generate revenue. Key players like Zynga, Tencent, and Nintendo are actively shaping the market landscape through strategic acquisitions, game development, and innovative monetization strategies.
Online Casual Games Market Market Size (In Billion)
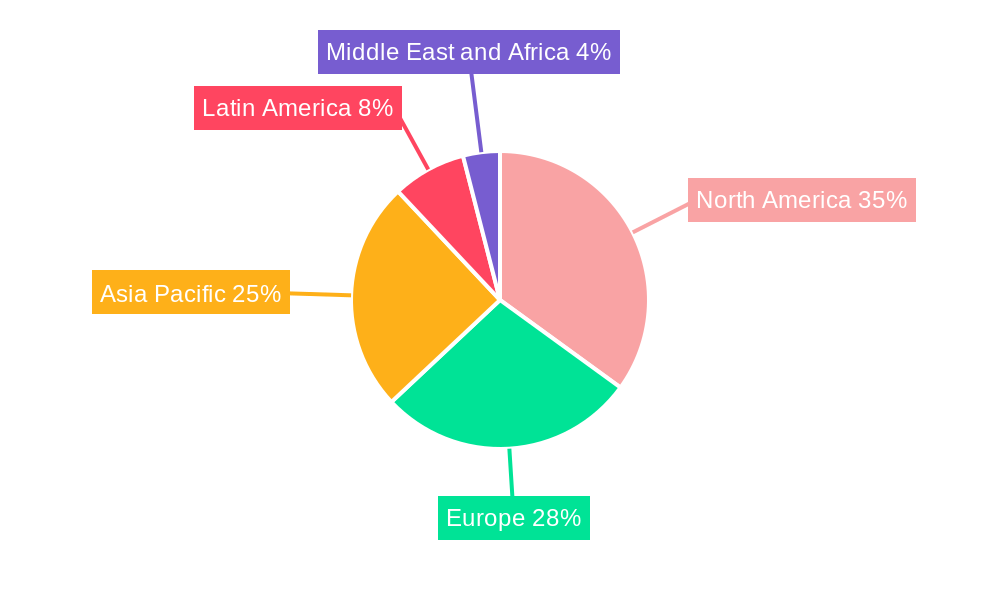
The geographic distribution of the online casual games market reflects the global reach of mobile gaming. North America and Asia Pacific are anticipated to maintain significant market share due to high mobile penetration and established gaming cultures. However, growth in other regions, particularly Latin America and Africa, is expected to accelerate as mobile technology adoption increases. The continued evolution of mobile technology, including advancements in graphics processing and improved connectivity, will further stimulate market growth. Furthermore, the expansion of e-sports and the growing integration of casual games into social platforms are expected to significantly impact the future of this dynamic sector. The market's future depends heavily on maintaining a focus on player experience, addressing concerns around monetization, and continuously adapting to the ever-evolving technological landscape.
Online Casual Games Market Company Market Share
This comprehensive report provides an in-depth analysis of the Online Casual Games Market, offering valuable insights for industry stakeholders, investors, and businesses seeking to understand this dynamic sector. The report covers the period 2019-2033, with a focus on the estimated year 2025. It meticulously examines market trends, growth drivers, challenges, and opportunities, providing a clear roadmap for navigating this competitive landscape. The market size is projected to reach xx Million by 2033.
Online Casual Games Market Market Concentration & Innovation
The Online Casual Games Market exhibits a moderately concentrated landscape, with several key players holding significant market share. However, the market is also characterized by a high level of innovation, driven by the continuous release of new games and the integration of emerging technologies. Major players such as Zynga Inc, Apple Inc (Apple Arcade), Sega Corporation, Ubisoft Entertainment, Microsoft Corporation, Betsson AB, Beijing Kunlun Tech Co Ltd, Tencent Holdings Ltd, Konami Digital Entertainment, Nintendo Co Ltd, Sony Corporation, and Bandai Namco Entertainment Inc., compete fiercely, leading to frequent mergers and acquisitions (M&A) activities. The total value of M&A deals in the period 2019-2024 reached approximately xx Million. Zynga Inc holds an estimated xx% market share in 2025, followed by Tencent Holdings Ltd with xx%.
- Market Concentration: High level of competition among established players.
- Innovation Drivers: Continuous development of new game mechanics, improved graphics, and social features. Integration of AR/VR technologies.
- Regulatory Frameworks: Varying regulations across different regions impacting monetization strategies.
- Product Substitutes: Other forms of entertainment, including streaming services and social media.
- End-User Trends: Growing demand for mobile gaming, casual gameplay, and social interaction within games.
- M&A Activities: Strategic acquisitions to expand market reach and technological capabilities.
Online Casual Games Market Industry Trends & Insights
The Online Casual Games Market is experiencing robust growth, driven by several key factors. The Compound Annual Growth Rate (CAGR) from 2025 to 2033 is estimated to be xx%. Increasing smartphone penetration, readily available internet access, and the growing popularity of casual gaming among diverse demographics are major contributors to this growth. Technological advancements, including improved graphics, enhanced game mechanics, and the integration of social features, further fuel market expansion. The market penetration rate for online casual games is projected to reach xx% by 2033. However, challenges such as increasing competition and the evolving preferences of gamers require constant adaptation and innovation to sustain growth.
Dominant Markets & Segments in Online Casual Games Market
The North American region currently dominates the Online Casual Games Market, followed by Asia-Pacific. Within these regions, specific countries such as the United States and China hold significant market share due to a large user base and robust infrastructure.
By Type:
- Advertising: This segment is experiencing substantial growth, driven by increasing mobile ad spending and innovative ad formats. Key drivers include the relatively low barrier to entry for players, and the ease of incorporating advertising within many casual games.
- In-app Purchase: This segment remains a major revenue generator for many developers. Factors driving growth include the increasing willingness of users to make in-app purchases for enhanced gameplay experiences.
- Paid App: This segment is experiencing slower growth compared to others, however certain niche titles still generate significant revenue from one-time purchases.
Dominance Analysis: North America's dominance is attributed to factors such as high smartphone penetration, strong consumer spending power, and a well-established gaming culture. Similarly, the success of Asia-Pacific is linked to the massive user base, particularly in China and India, and increasing internet and smartphone adoption rates.
Online Casual Games Market Product Developments
The Online Casual Games Market is characterized by continuous product innovation. Developers are focusing on improving game graphics, incorporating advanced artificial intelligence, and integrating social features to enhance user engagement. The growing use of cloud gaming technology is also transforming the delivery and accessibility of casual games. The focus on user experience through intuitive gameplay, addictive loops, and frequent updates keeps users engaged and coming back for more.
Report Scope & Segmentation Analysis
This report segments the Online Casual Games Market primarily by type: Advertising, In-app Purchase, and Paid App.
- Advertising: This segment is projected to grow at a CAGR of xx% during the forecast period (2025-2033), driven by the increasing adoption of in-game advertising.
- In-app Purchase: This segment is expected to have a CAGR of xx% during the forecast period, fueled by the growing preference for monetization through in-app transactions.
- Paid App: This segment is anticipated to show a moderate CAGR of xx% during the forecast period, driven by the consistent demand for premium casual games with high-quality content.
Key Drivers of Online Casual Games Market Growth
Several factors drive the growth of the Online Casual Games Market:
- Technological Advancements: Improved graphics, AI integration, and cloud gaming enhance the gaming experience.
- Increased Smartphone Penetration: Wider access to smartphones expands the user base for mobile gaming.
- Rising Internet Connectivity: Broadband access is crucial for online gaming experiences.
- Changing Consumer Preferences: Demand for short, engaging, and easily accessible games is on the rise.
Challenges in the Online Casual Games Market Sector
The Online Casual Games Market faces several challenges:
- Intense Competition: The market is highly saturated, with numerous players competing for market share. This leads to pressure on pricing and profitability.
- Monetization Challenges: Finding sustainable monetization strategies amidst changing user preferences presents a significant hurdle.
- Regulatory Changes: Evolving data privacy regulations globally can affect how developers collect and use player data.
Emerging Opportunities in Online Casual Games Market
Emerging opportunities include:
- Expansion into New Markets: Untapped potential exists in developing economies with growing smartphone penetration.
- Integration of Emerging Technologies: Augmented reality (AR) and virtual reality (VR) offer new gameplay experiences.
- Growth of Esports and Competitive Gaming: Increased interest in casual esports creates opportunities for game developers and publishers.
Leading Players in the Online Casual Games Market Market
- Zynga Inc
- Apple Inc (Apple Arcade)
- Sega Corporation
- Ubisoft Entertainment
- Microsoft Corporation
- Betsson AB
- Beijing Kunlun Tech Co Ltd
- Tencent Holdings Ltd
- Konami Digital Entertainment
- Nintendo Co Ltd
- Sony Corporation
- Bandai Namco Entertainment Inc
Key Developments in Online Casual Games Market Industry
- February 2022: Ubisoft expanded its La Forge R&D model to multiple studios globally, boosting AI and machine learning integration in game development.
- March 2022: Netflix acquired Boss Fight Entertainment, expanding its presence in the gaming industry.
Strategic Outlook for Online Casual Games Market Market
The Online Casual Games Market holds substantial growth potential. Continued innovation in game design, technological advancements, and expansion into new markets will drive future growth. A focus on user experience and effective monetization strategies will be critical for success in this competitive environment. The market is expected to continue its upward trajectory, driven by the global adoption of smartphones and the evolving preferences of casual gamers.
Online Casual Games Market Segmentation
-
1. Type
- 1.1. Advertising
- 1.2. In-app Purchase
- 1.3. Paid App
Online Casual Games Market Segmentation By Geography
-
1. North America
- 1.1. United States
- 1.2. Canada
-
2. Europe
- 2.1. United Kingdom
- 2.2. France
- 2.3. Germany
- 2.4. Rest of Europe
-
3. Asia Pacific
- 3.1. China
- 3.2. India
- 3.3. Japan
- 3.4. Rest of Asia Pacific
- 4. Latin America
- 5. Middle East and Africa
Online Casual Games Market Regional Market Share
Geographic Coverage of Online Casual Games Market
Online Casual Games Market REPORT HIGHLIGHTS
| Aspects | Details |
|---|---|
| Study Period | 2020-2034 |
| Base Year | 2025 |
| Estimated Year | 2026 |
| Forecast Period | 2026-2034 |
| Historical Period | 2020-2025 |
| Growth Rate | CAGR of 6.12% from 2020-2034 |
| Segmentation |
|
Table of Contents
- 1. Introduction
- 1.1. Research Scope
- 1.2. Market Segmentation
- 1.3. Research Methodology
- 1.4. Definitions and Assumptions
- 2. Executive Summary
- 2.1. Introduction
- 3. Market Dynamics
- 3.1. Introduction
- 3.2. Market Drivers
- 3.2.1. The Increasing Penetration of Internet and Smartphones Boosted the Demand for the Online Casual Games Market; Rising Popularity of Cloud Gaming Encouraging the Expansion of the Gaming Industry
- 3.3. Market Restrains
- 3.3.1. Uncertain Regulatory Standards and Frameworks
- 3.4. Market Trends
- 3.4.1. The Increasing Penetration of Internet and Smartphones Boosted the Demand for the Online Casual Games Market
- 4. Market Factor Analysis
- 4.1. Porters Five Forces
- 4.2. Supply/Value Chain
- 4.3. PESTEL analysis
- 4.4. Market Entropy
- 4.5. Patent/Trademark Analysis
- 5. Global Online Casual Games Market Analysis, Insights and Forecast, 2020-2032
- 5.1. Market Analysis, Insights and Forecast - by Type
- 5.1.1. Advertising
- 5.1.2. In-app Purchase
- 5.1.3. Paid App
- 5.2. Market Analysis, Insights and Forecast - by Region
- 5.2.1. North America
- 5.2.2. Europe
- 5.2.3. Asia Pacific
- 5.2.4. Latin America
- 5.2.5. Middle East and Africa
- 5.1. Market Analysis, Insights and Forecast - by Type
- 6. North America Online Casual Games Market Analysis, Insights and Forecast, 2020-2032
- 6.1. Market Analysis, Insights and Forecast - by Type
- 6.1.1. Advertising
- 6.1.2. In-app Purchase
- 6.1.3. Paid App
- 6.1. Market Analysis, Insights and Forecast - by Type
- 7. Europe Online Casual Games Market Analysis, Insights and Forecast, 2020-2032
- 7.1. Market Analysis, Insights and Forecast - by Type
- 7.1.1. Advertising
- 7.1.2. In-app Purchase
- 7.1.3. Paid App
- 7.1. Market Analysis, Insights and Forecast - by Type
- 8. Asia Pacific Online Casual Games Market Analysis, Insights and Forecast, 2020-2032
- 8.1. Market Analysis, Insights and Forecast - by Type
- 8.1.1. Advertising
- 8.1.2. In-app Purchase
- 8.1.3. Paid App
- 8.1. Market Analysis, Insights and Forecast - by Type
- 9. Latin America Online Casual Games Market Analysis, Insights and Forecast, 2020-2032
- 9.1. Market Analysis, Insights and Forecast - by Type
- 9.1.1. Advertising
- 9.1.2. In-app Purchase
- 9.1.3. Paid App
- 9.1. Market Analysis, Insights and Forecast - by Type
- 10. Middle East and Africa Online Casual Games Market Analysis, Insights and Forecast, 2020-2032
- 10.1. Market Analysis, Insights and Forecast - by Type
- 10.1.1. Advertising
- 10.1.2. In-app Purchase
- 10.1.3. Paid App
- 10.1. Market Analysis, Insights and Forecast - by Type
- 11. Competitive Analysis
- 11.1. Global Market Share Analysis 2025
- 11.2. Company Profiles
- 11.2.1 Zynga Inc
- 11.2.1.1. Overview
- 11.2.1.2. Products
- 11.2.1.3. SWOT Analysis
- 11.2.1.4. Recent Developments
- 11.2.1.5. Financials (Based on Availability)
- 11.2.2 Apple Inc (Apple Arcade)
- 11.2.2.1. Overview
- 11.2.2.2. Products
- 11.2.2.3. SWOT Analysis
- 11.2.2.4. Recent Developments
- 11.2.2.5. Financials (Based on Availability)
- 11.2.3 Sega Corporation
- 11.2.3.1. Overview
- 11.2.3.2. Products
- 11.2.3.3. SWOT Analysis
- 11.2.3.4. Recent Developments
- 11.2.3.5. Financials (Based on Availability)
- 11.2.4 Ubisoft Entertainment
- 11.2.4.1. Overview
- 11.2.4.2. Products
- 11.2.4.3. SWOT Analysis
- 11.2.4.4. Recent Developments
- 11.2.4.5. Financials (Based on Availability)
- 11.2.5 Microsoft Corporation
- 11.2.5.1. Overview
- 11.2.5.2. Products
- 11.2.5.3. SWOT Analysis
- 11.2.5.4. Recent Developments
- 11.2.5.5. Financials (Based on Availability)
- 11.2.6 Betsson AB
- 11.2.6.1. Overview
- 11.2.6.2. Products
- 11.2.6.3. SWOT Analysis
- 11.2.6.4. Recent Developments
- 11.2.6.5. Financials (Based on Availability)
- 11.2.7 Beijing Kunlun Tech Co Ltd*List Not Exhaustive
- 11.2.7.1. Overview
- 11.2.7.2. Products
- 11.2.7.3. SWOT Analysis
- 11.2.7.4. Recent Developments
- 11.2.7.5. Financials (Based on Availability)
- 11.2.8 Tencent Holdings Ltd
- 11.2.8.1. Overview
- 11.2.8.2. Products
- 11.2.8.3. SWOT Analysis
- 11.2.8.4. Recent Developments
- 11.2.8.5. Financials (Based on Availability)
- 11.2.9 Konami Digital Entertainment
- 11.2.9.1. Overview
- 11.2.9.2. Products
- 11.2.9.3. SWOT Analysis
- 11.2.9.4. Recent Developments
- 11.2.9.5. Financials (Based on Availability)
- 11.2.10 Nintendo Co Ltd
- 11.2.10.1. Overview
- 11.2.10.2. Products
- 11.2.10.3. SWOT Analysis
- 11.2.10.4. Recent Developments
- 11.2.10.5. Financials (Based on Availability)
- 11.2.11 Sony Corporation
- 11.2.11.1. Overview
- 11.2.11.2. Products
- 11.2.11.3. SWOT Analysis
- 11.2.11.4. Recent Developments
- 11.2.11.5. Financials (Based on Availability)
- 11.2.12 Bandai Namco Entertainment Inc
- 11.2.12.1. Overview
- 11.2.12.2. Products
- 11.2.12.3. SWOT Analysis
- 11.2.12.4. Recent Developments
- 11.2.12.5. Financials (Based on Availability)
- 11.2.1 Zynga Inc
List of Figures
- Figure 1: Global Online Casual Games Market Revenue Breakdown (Million, %) by Region 2025 & 2033
- Figure 2: North America Online Casual Games Market Revenue (Million), by Type 2025 & 2033
- Figure 3: North America Online Casual Games Market Revenue Share (%), by Type 2025 & 2033
- Figure 4: North America Online Casual Games Market Revenue (Million), by Country 2025 & 2033
- Figure 5: North America Online Casual Games Market Revenue Share (%), by Country 2025 & 2033
- Figure 6: Europe Online Casual Games Market Revenue (Million), by Type 2025 & 2033
- Figure 7: Europe Online Casual Games Market Revenue Share (%), by Type 2025 & 2033
- Figure 8: Europe Online Casual Games Market Revenue (Million), by Country 2025 & 2033
- Figure 9: Europe Online Casual Games Market Revenue Share (%), by Country 2025 & 2033
- Figure 10: Asia Pacific Online Casual Games Market Revenue (Million), by Type 2025 & 2033
- Figure 11: Asia Pacific Online Casual Games Market Revenue Share (%), by Type 2025 & 2033
- Figure 12: Asia Pacific Online Casual Games Market Revenue (Million), by Country 2025 & 2033
- Figure 13: Asia Pacific Online Casual Games Market Revenue Share (%), by Country 2025 & 2033
- Figure 14: Latin America Online Casual Games Market Revenue (Million), by Type 2025 & 2033
- Figure 15: Latin America Online Casual Games Market Revenue Share (%), by Type 2025 & 2033
- Figure 16: Latin America Online Casual Games Market Revenue (Million), by Country 2025 & 2033
- Figure 17: Latin America Online Casual Games Market Revenue Share (%), by Country 2025 & 2033
- Figure 18: Middle East and Africa Online Casual Games Market Revenue (Million), by Type 2025 & 2033
- Figure 19: Middle East and Africa Online Casual Games Market Revenue Share (%), by Type 2025 & 2033
- Figure 20: Middle East and Africa Online Casual Games Market Revenue (Million), by Country 2025 & 2033
- Figure 21: Middle East and Africa Online Casual Games Market Revenue Share (%), by Country 2025 & 2033
List of Tables
- Table 1: Global Online Casual Games Market Revenue Million Forecast, by Type 2020 & 2033
- Table 2: Global Online Casual Games Market Revenue Million Forecast, by Region 2020 & 2033
- Table 3: Global Online Casual Games Market Revenue Million Forecast, by Type 2020 & 2033
- Table 4: Global Online Casual Games Market Revenue Million Forecast, by Country 2020 & 2033
- Table 5: United States Online Casual Games Market Revenue (Million) Forecast, by Application 2020 & 2033
- Table 6: Canada Online Casual Games Market Revenue (Million) Forecast, by Application 2020 & 2033
- Table 7: Global Online Casual Games Market Revenue Million Forecast, by Type 2020 & 2033
- Table 8: Global Online Casual Games Market Revenue Million Forecast, by Country 2020 & 2033
- Table 9: United Kingdom Online Casual Games Market Revenue (Million) Forecast, by Application 2020 & 2033
- Table 10: France Online Casual Games Market Revenue (Million) Forecast, by Application 2020 & 2033
- Table 11: Germany Online Casual Games Market Revenue (Million) Forecast, by Application 2020 & 2033
- Table 12: Rest of Europe Online Casual Games Market Revenue (Million) Forecast, by Application 2020 & 2033
- Table 13: Global Online Casual Games Market Revenue Million Forecast, by Type 2020 & 2033
- Table 14: Global Online Casual Games Market Revenue Million Forecast, by Country 2020 & 2033
- Table 15: China Online Casual Games Market Revenue (Million) Forecast, by Application 2020 & 2033
- Table 16: India Online Casual Games Market Revenue (Million) Forecast, by Application 2020 & 2033
- Table 17: Japan Online Casual Games Market Revenue (Million) Forecast, by Application 2020 & 2033
- Table 18: Rest of Asia Pacific Online Casual Games Market Revenue (Million) Forecast, by Application 2020 & 2033
- Table 19: Global Online Casual Games Market Revenue Million Forecast, by Type 2020 & 2033
- Table 20: Global Online Casual Games Market Revenue Million Forecast, by Country 2020 & 2033
- Table 21: Global Online Casual Games Market Revenue Million Forecast, by Type 2020 & 2033
- Table 22: Global Online Casual Games Market Revenue Million Forecast, by Country 2020 & 2033
Frequently Asked Questions
1. What is the projected Compound Annual Growth Rate (CAGR) of the Online Casual Games Market?
The projected CAGR is approximately 6.12%.
2. Which companies are prominent players in the Online Casual Games Market?
Key companies in the market include Zynga Inc, Apple Inc (Apple Arcade), Sega Corporation, Ubisoft Entertainment, Microsoft Corporation, Betsson AB, Beijing Kunlun Tech Co Ltd*List Not Exhaustive, Tencent Holdings Ltd, Konami Digital Entertainment, Nintendo Co Ltd, Sony Corporation, Bandai Namco Entertainment Inc.
3. What are the main segments of the Online Casual Games Market?
The market segments include Type.
4. Can you provide details about the market size?
The market size is estimated to be USD 20.48 Million as of 2022.
5. What are some drivers contributing to market growth?
The Increasing Penetration of Internet and Smartphones Boosted the Demand for the Online Casual Games Market; Rising Popularity of Cloud Gaming Encouraging the Expansion of the Gaming Industry.
6. What are the notable trends driving market growth?
The Increasing Penetration of Internet and Smartphones Boosted the Demand for the Online Casual Games Market.
7. Are there any restraints impacting market growth?
Uncertain Regulatory Standards and Frameworks.
8. Can you provide examples of recent developments in the market?
February 2022: Ubisoft announced the expansion of La Forge, its successful R&D model, to multiple studios across the world, with teams now operating in Canada (Ubisoft Montreal, Ubisoft Toronto), China (Ubisoft Chengdu, Ubisoft Shanghai), and France (Ubisoft Bordeaux). The UDC conference, Ubisoft's annual meeting dedicated to technological innovation in video game creation, includes a specific track on artificial intelligence and machine learning.
9. What pricing options are available for accessing the report?
Pricing options include single-user, multi-user, and enterprise licenses priced at USD 4750, USD 5250, and USD 8750 respectively.
10. Is the market size provided in terms of value or volume?
The market size is provided in terms of value, measured in Million.
11. Are there any specific market keywords associated with the report?
Yes, the market keyword associated with the report is "Online Casual Games Market," which aids in identifying and referencing the specific market segment covered.
12. How do I determine which pricing option suits my needs best?
The pricing options vary based on user requirements and access needs. Individual users may opt for single-user licenses, while businesses requiring broader access may choose multi-user or enterprise licenses for cost-effective access to the report.
13. Are there any additional resources or data provided in the Online Casual Games Market report?
While the report offers comprehensive insights, it's advisable to review the specific contents or supplementary materials provided to ascertain if additional resources or data are available.
14. How can I stay updated on further developments or reports in the Online Casual Games Market?
To stay informed about further developments, trends, and reports in the Online Casual Games Market, consider subscribing to industry newsletters, following relevant companies and organizations, or regularly checking reputable industry news sources and publications.
Methodology
Step 1 - Identification of Relevant Samples Size from Population Database


Step 2 - Approaches for Defining Global Market Size (Value, Volume* & Price*)

Note*: In applicable scenarios
Step 3 - Data Sources
Primary Research
- Web Analytics
- Survey Reports
- Research Institute
- Latest Research Reports
- Opinion Leaders
Secondary Research
- Annual Reports
- White Paper
- Latest Press Release
- Industry Association
- Paid Database
- Investor Presentations

Step 4 - Data Triangulation
Involves using different sources of information in order to increase the validity of a study
These sources are likely to be stakeholders in a program - participants, other researchers, program staff, other community members, and so on.
Then we put all data in single framework & apply various statistical tools to find out the dynamic on the market.
During the analysis stage, feedback from the stakeholder groups would be compared to determine areas of agreement as well as areas of divergence