
Key Insights
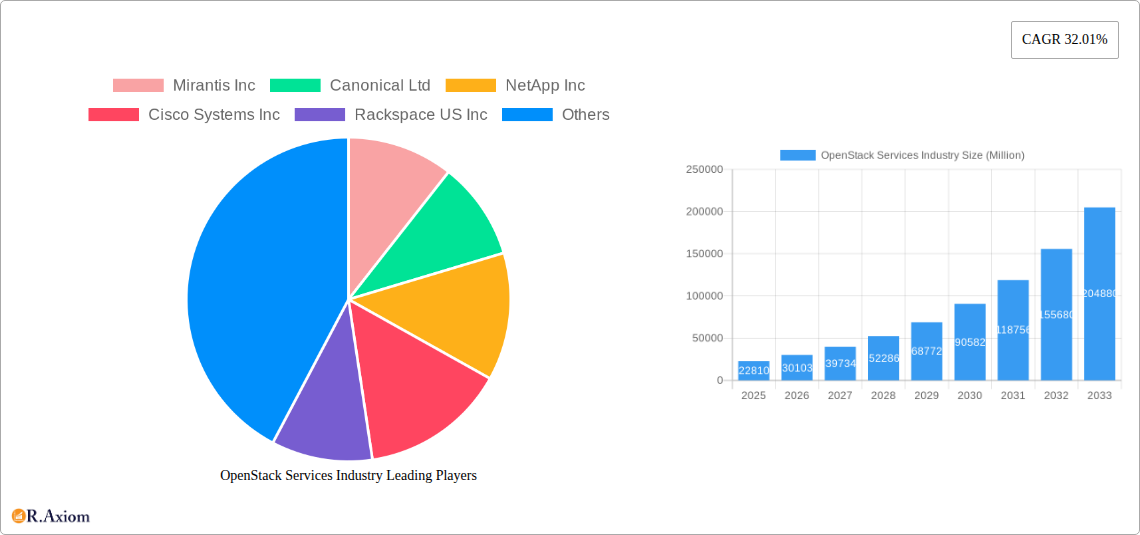
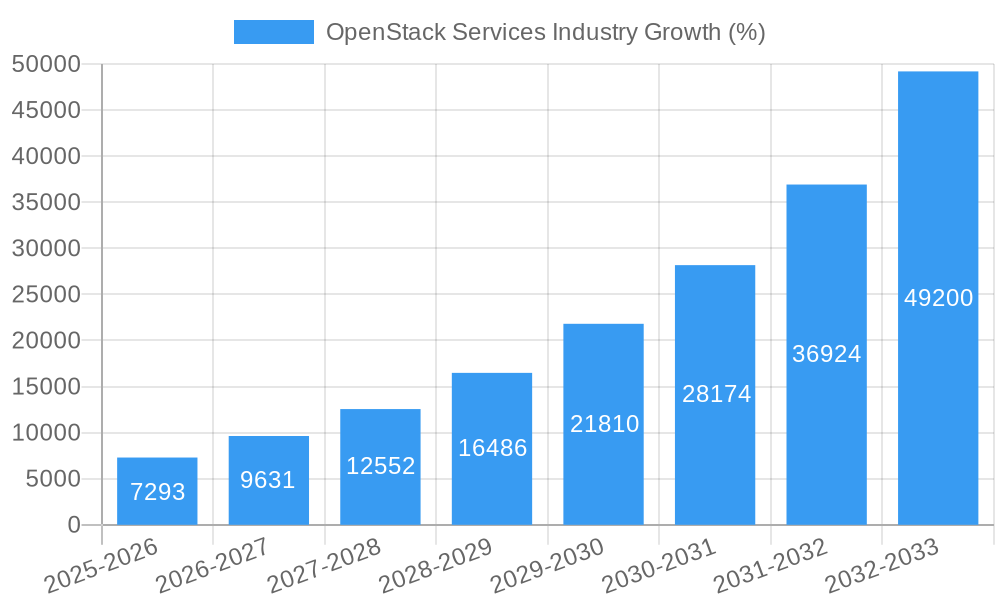
The OpenStack services market, valued at $22.81 billion in 2025, is projected to experience robust growth, exhibiting a compound annual growth rate (CAGR) of 32.01% from 2025 to 2033. This expansion is driven by several key factors. The increasing adoption of cloud computing across diverse sectors like Information Technology, Telecommunications, Banking and Financial Services, and Retail/E-commerce fuels demand for flexible and scalable infrastructure solutions offered by OpenStack. Furthermore, the shift towards hybrid and multi-cloud environments necessitates robust orchestration and management capabilities, strengthening the market position of OpenStack. The availability of both on-cloud and on-premise deployment models caters to diverse organizational needs and preferences, further boosting market penetration. Competition among major players like Mirantis, Canonical, NetApp, Cisco, and VMware fosters innovation and drives down costs, making OpenStack increasingly accessible. However, the market faces certain restraints including the complexity of OpenStack implementation and the need for specialized expertise, potentially limiting adoption among smaller organizations lacking significant IT resources.
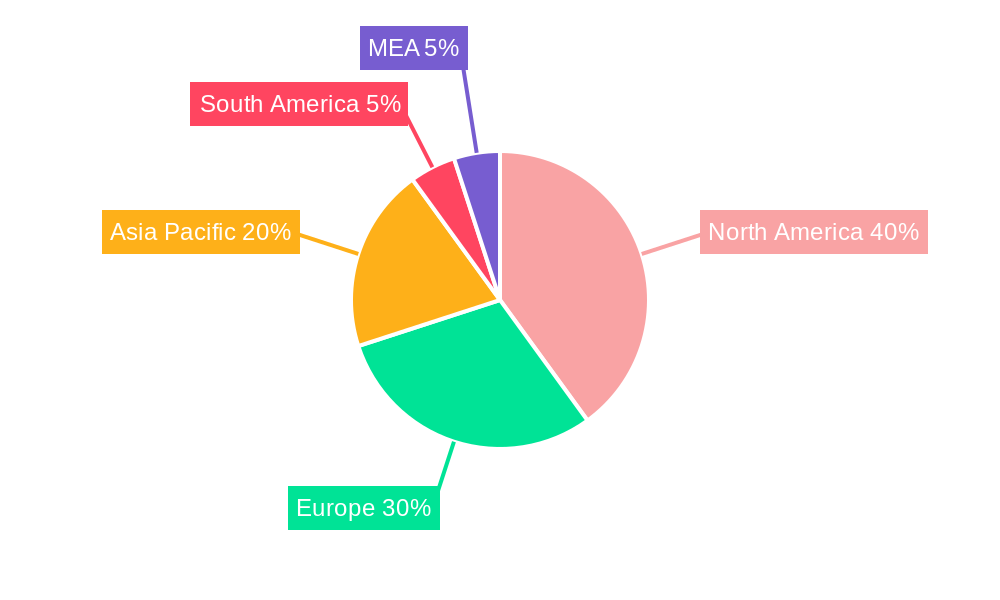
Despite these challenges, the future outlook for the OpenStack services market remains positive. Continued technological advancements, enhanced user-friendliness, and growing community support are anticipated to mitigate the existing barriers to entry. The expanding adoption of DevOps methodologies and the increasing demand for automated infrastructure management are likely to fuel market expansion across regions, particularly in North America, Europe, and Asia-Pacific, which are expected to remain dominant markets due to their robust IT infrastructure and high levels of cloud adoption. The market segmentation by deployment model (on-cloud, on-premise) and end-user industry highlights the broad appeal of OpenStack across diverse sectors and deployment scenarios, solidifying its position as a key technology in the evolving cloud landscape.
OpenStack Services Industry: A Comprehensive Market Report (2019-2033)
This detailed report provides a comprehensive analysis of the OpenStack services market, covering its evolution from 2019 to 2033. We delve into market concentration, innovation, dominant segments, leading players, and future growth prospects, offering invaluable insights for industry stakeholders, investors, and businesses seeking to navigate this dynamic landscape. The report utilizes a robust methodology, incorporating both historical data (2019-2024) and future projections (2025-2033), with 2025 serving as the base year and estimated year. The market size is projected in Millions.
OpenStack Services Industry Market Concentration & Innovation
The OpenStack services market exhibits a moderately concentrated landscape, with a handful of major players holding significant market share. While precise figures for market share are proprietary and dynamic, we estimate that the top five companies (Mirantis Inc, Red Hat Inc, VMware Inc, Rackspace US Inc, and Hewlett Packard Enterprise Development LP) collectively held approximately xx% of the market in 2024. This concentration is influenced by factors such as extensive R&D investment, strong partnerships, and established customer bases. However, the market also demonstrates significant room for innovation, driven by the open-source nature of OpenStack, fostering a vibrant ecosystem of independent software vendors (ISVs) and contributors.
Innovation is spurred by the need for enhanced scalability, security, and integration with emerging technologies such as AI and machine learning. Regulatory frameworks, particularly around data privacy and security, significantly impact market dynamics. While OpenStack itself is not directly regulated, compliance with regional regulations (e.g., GDPR, CCPA) is crucial for vendors. Product substitutes, like other cloud platforms (AWS, Azure, GCP), pose a competitive threat, compelling OpenStack vendors to continuously enhance offerings. End-user trends favor automation, ease of management, and cost optimization. Mergers and acquisitions (M&A) activity in the OpenStack ecosystem has been moderate, with deal values ranging from xx Million to xx Million in recent years, primarily focused on consolidating capabilities and expanding market reach. For example, the acquisition of [insert example of recent M&A if available, otherwise state "No significant M&A activity noted in 2024"] reflects this trend.
OpenStack Services Industry Industry Trends & Insights
The OpenStack services market is projected to experience a Compound Annual Growth Rate (CAGR) of xx% during the forecast period (2025-2033), driven by several key factors. The increasing adoption of cloud computing across various industries, coupled with the inherent flexibility and cost-effectiveness of OpenStack, constitutes a major growth catalyst. Technological disruptions, such as the rise of serverless computing and edge computing, are influencing the evolution of OpenStack, prompting vendors to integrate these capabilities into their offerings. Consumer preferences are shifting towards managed services, simplified deployments, and enhanced security features, shaping the direction of product development. The competitive dynamics remain intense, with established cloud providers continuously striving to improve their offerings and attract new customers. Market penetration in key industries like telecommunications and financial services is gradually increasing, reflecting growing acceptance of OpenStack for mission-critical applications. By 2033, the market is expected to reach approximately xx Million, signifying a substantial increase from its 2024 valuation of xx Million.
Dominant Markets & Segments in OpenStack Services Industry
The OpenStack services market showcases diverse regional and segmental dominance. While North America currently holds the largest market share, the Asia-Pacific region is expected to experience significant growth during the forecast period.
By End-user Industry:
- Information Technology: This segment maintains a dominant position due to the high demand for flexible and scalable infrastructure solutions within the IT sector. Drivers include rapid digital transformation and the need for efficient data center management.
- Telecommunication: The sector is adopting OpenStack for network functions virtualization (NFV) and 5G deployment, leading to substantial growth in this segment. Drivers include the demand for agile infrastructure and cost optimization.
- Banking and Financial Services: Stringent security and compliance requirements are driving adoption, with OpenStack offering a robust and customizable platform. Drivers include data security regulations and the need for private clouds.
- Academic: Universities and research institutions leverage OpenStack for research purposes and educational initiatives. Drivers include the need for affordable and flexible infrastructure.
- Retail/E-commerce: The growing need for scalable and agile infrastructure for e-commerce platforms boosts the sector's growth. Drivers include seasonal demand peaks and the need for efficient resource management.
By Deployment Model:
- On-Premise: This segment continues to be significant due to security and compliance concerns. Drivers include organizations' preference for control over their infrastructure.
- On-Cloud: Increasing preference for managed services and pay-as-you-go models is driving the growth of this segment. Drivers include cost optimization and reduced operational overhead.
OpenStack Services Industry Product Developments
Recent product innovations focus on enhanced automation capabilities, streamlined deployment processes, improved security features, and integration with containerization technologies like Kubernetes. This allows for more efficient resource management, improved scalability, and seamless integration with modern application architectures. The trend towards managed services and fully integrated platforms is gaining momentum, simplifying the adoption and management of OpenStack for enterprises. This improved user experience is a key competitive advantage for vendors.
Report Scope & Segmentation Analysis
This report comprehensively analyzes the OpenStack services market, segmented by end-user industry (Information Technology, Telecommunication, Banking and Financial Services, Academic, Retail/E-Commerce) and deployment model (On-Cloud, On-Premise). Each segment is assessed based on growth projections, market size (in Millions), competitive dynamics, and key drivers. The market size for each segment varies significantly, with the Information Technology segment expected to maintain the largest share, followed by the Telecommunication sector. The On-Premise segment is projected to grow at a moderate rate, while the On-Cloud segment is expected to exhibit faster growth due to the increasing demand for cloud-based solutions. Competitive landscapes vary across segments, with certain vendors exhibiting stronger presence in specific areas.
Key Drivers of OpenStack Services Industry Growth
The growth of the OpenStack services market is fueled by several key factors: the increasing adoption of cloud computing, the demand for flexible and scalable infrastructure solutions, the cost-effectiveness of OpenStack compared to proprietary cloud platforms, ongoing technological advancements, and the growing need for enhanced security and compliance in various industries. The open-source nature of OpenStack further fosters innovation and community support, driving its continuous improvement and adoption. Government initiatives promoting cloud adoption in various sectors also contribute to market expansion.
Challenges in the OpenStack Services Industry Sector
The OpenStack services market faces challenges including the complexity of implementation and management, competition from established cloud providers offering fully managed services, the need for skilled personnel to manage OpenStack environments, and the potential for security vulnerabilities if not properly configured and maintained. These challenges, along with the potential for fragmented ecosystems and integration complexities, represent key obstacles to wider adoption. Addressing these factors requires continuous innovation and investment in user-friendly tools and support services.
Emerging Opportunities in OpenStack Services Industry
Emerging opportunities include the integration of OpenStack with emerging technologies such as AI, machine learning, and serverless computing, expansion into new geographic markets, and the growing demand for hybrid cloud deployments. Furthermore, the increasing adoption of edge computing presents a significant opportunity for OpenStack to provide robust and scalable infrastructure at the network edge. Focusing on simplified management and enhanced security will be crucial for capitalizing on these opportunities.
Leading Players in the OpenStack Services Industry Market
- Mirantis Inc
- Canonical Ltd
- NetApp Inc
- Cisco Systems Inc
- Rackspace US Inc
- Hewlett Packard Enterprise Development LP
- Red Hat Inc
- Dell Inc
- Huawei Technologies Co Ltd
- VMware Inc
Key Developments in OpenStack Services Industry Industry
- October 2023: UNICC partnered with Canonical to build a secure private cloud environment for the UN system, highlighting the growing importance of OpenStack for secure and sovereign data management.
- September 2022: Red Hat's release of a new OpenStack version with enhanced telecom operator capabilities strengthens its integration with its cloud-native OpenShift platform.
- June 2022: VEXXHOST Inc. launched Atmosphere, an open-source tool for deploying fully integrated OpenStack environments, simplifying deployment and benefiting the broader community.
Strategic Outlook for OpenStack Services Industry Market
The OpenStack services market is poised for continued growth, driven by the increasing demand for flexible, scalable, and cost-effective cloud solutions. The focus on managed services, simplified deployment, and enhanced security features will be critical for attracting new customers and maintaining competitiveness. The integration of OpenStack with emerging technologies such as AI and edge computing will unlock new opportunities and drive further innovation, shaping the future of the OpenStack ecosystem. The market's future growth will be shaped by the ability of vendors to address evolving customer needs and adapt to the rapidly changing technological landscape.
OpenStack Services Industry Segmentation
-
1. Deployment Model
- 1.1. On-Cloud
- 1.2. On-Premise
-
2. End-user Industry
- 2.1. Information Technology
- 2.2. Telecommunication
- 2.3. Banking and Financial Services
- 2.4. Academic
- 2.5. Retail/E-Commerce
OpenStack Services Industry Segmentation By Geography
- 1. North America
- 2. Europe
- 3. Asia
- 4. Latin America
- 5. Middle East and Africa
OpenStack Services Industry REPORT HIGHLIGHTS
| Aspects | Details |
|---|---|
| Study Period | 2019-2033 |
| Base Year | 2024 |
| Estimated Year | 2025 |
| Forecast Period | 2025-2033 |
| Historical Period | 2019-2024 |
| Growth Rate | CAGR of 32.01% from 2019-2033 |
| Segmentation |
|
Table of Contents
- 1. Introduction
- 1.1. Research Scope
- 1.2. Market Segmentation
- 1.3. Research Methodology
- 1.4. Definitions and Assumptions
- 2. Executive Summary
- 2.1. Introduction
- 3. Market Dynamics
- 3.1. Introduction
- 3.2. Market Drivers
- 3.2.1. Increasing Need for Organizations to Improve Their Business Agility and Efficiency; OpenStack Being Open Source Provides the Flexibility for Customized Solution; Increasing use of OpenStack Services in Telecommunication Sector
- 3.3. Market Restrains
- 3.3.1 Lack of Robustness that Enterprises Desire for Their Data Centers
- 3.3.2 Including IT Management Features
- 3.3.3 Such as Availability and Security
- 3.4. Market Trends
- 3.4.1. Increasing use of OpenStack Services in Telecommunication Sector is Driving the Market
- 4. Market Factor Analysis
- 4.1. Porters Five Forces
- 4.2. Supply/Value Chain
- 4.3. PESTEL analysis
- 4.4. Market Entropy
- 4.5. Patent/Trademark Analysis
- 5. Global OpenStack Services Industry Analysis, Insights and Forecast, 2019-2031
- 5.1. Market Analysis, Insights and Forecast - by Deployment Model
- 5.1.1. On-Cloud
- 5.1.2. On-Premise
- 5.2. Market Analysis, Insights and Forecast - by End-user Industry
- 5.2.1. Information Technology
- 5.2.2. Telecommunication
- 5.2.3. Banking and Financial Services
- 5.2.4. Academic
- 5.2.5. Retail/E-Commerce
- 5.3. Market Analysis, Insights and Forecast - by Region
- 5.3.1. North America
- 5.3.2. Europe
- 5.3.3. Asia
- 5.3.4. Latin America
- 5.3.5. Middle East and Africa
- 5.1. Market Analysis, Insights and Forecast - by Deployment Model
- 6. North America OpenStack Services Industry Analysis, Insights and Forecast, 2019-2031
- 6.1. Market Analysis, Insights and Forecast - by Deployment Model
- 6.1.1. On-Cloud
- 6.1.2. On-Premise
- 6.2. Market Analysis, Insights and Forecast - by End-user Industry
- 6.2.1. Information Technology
- 6.2.2. Telecommunication
- 6.2.3. Banking and Financial Services
- 6.2.4. Academic
- 6.2.5. Retail/E-Commerce
- 6.1. Market Analysis, Insights and Forecast - by Deployment Model
- 7. Europe OpenStack Services Industry Analysis, Insights and Forecast, 2019-2031
- 7.1. Market Analysis, Insights and Forecast - by Deployment Model
- 7.1.1. On-Cloud
- 7.1.2. On-Premise
- 7.2. Market Analysis, Insights and Forecast - by End-user Industry
- 7.2.1. Information Technology
- 7.2.2. Telecommunication
- 7.2.3. Banking and Financial Services
- 7.2.4. Academic
- 7.2.5. Retail/E-Commerce
- 7.1. Market Analysis, Insights and Forecast - by Deployment Model
- 8. Asia OpenStack Services Industry Analysis, Insights and Forecast, 2019-2031
- 8.1. Market Analysis, Insights and Forecast - by Deployment Model
- 8.1.1. On-Cloud
- 8.1.2. On-Premise
- 8.2. Market Analysis, Insights and Forecast - by End-user Industry
- 8.2.1. Information Technology
- 8.2.2. Telecommunication
- 8.2.3. Banking and Financial Services
- 8.2.4. Academic
- 8.2.5. Retail/E-Commerce
- 8.1. Market Analysis, Insights and Forecast - by Deployment Model
- 9. Latin America OpenStack Services Industry Analysis, Insights and Forecast, 2019-2031
- 9.1. Market Analysis, Insights and Forecast - by Deployment Model
- 9.1.1. On-Cloud
- 9.1.2. On-Premise
- 9.2. Market Analysis, Insights and Forecast - by End-user Industry
- 9.2.1. Information Technology
- 9.2.2. Telecommunication
- 9.2.3. Banking and Financial Services
- 9.2.4. Academic
- 9.2.5. Retail/E-Commerce
- 9.1. Market Analysis, Insights and Forecast - by Deployment Model
- 10. Middle East and Africa OpenStack Services Industry Analysis, Insights and Forecast, 2019-2031
- 10.1. Market Analysis, Insights and Forecast - by Deployment Model
- 10.1.1. On-Cloud
- 10.1.2. On-Premise
- 10.2. Market Analysis, Insights and Forecast - by End-user Industry
- 10.2.1. Information Technology
- 10.2.2. Telecommunication
- 10.2.3. Banking and Financial Services
- 10.2.4. Academic
- 10.2.5. Retail/E-Commerce
- 10.1. Market Analysis, Insights and Forecast - by Deployment Model
- 11. North America OpenStack Services Industry Analysis, Insights and Forecast, 2019-2031
- 11.1. Market Analysis, Insights and Forecast - By Country/Sub-region
- 11.1.1 United States
- 11.1.2 Canada
- 11.1.3 Mexico
- 12. Europe OpenStack Services Industry Analysis, Insights and Forecast, 2019-2031
- 12.1. Market Analysis, Insights and Forecast - By Country/Sub-region
- 12.1.1 Germany
- 12.1.2 United Kingdom
- 12.1.3 France
- 12.1.4 Spain
- 12.1.5 Italy
- 12.1.6 Spain
- 12.1.7 Belgium
- 12.1.8 Netherland
- 12.1.9 Nordics
- 12.1.10 Rest of Europe
- 13. Asia Pacific OpenStack Services Industry Analysis, Insights and Forecast, 2019-2031
- 13.1. Market Analysis, Insights and Forecast - By Country/Sub-region
- 13.1.1 China
- 13.1.2 Japan
- 13.1.3 India
- 13.1.4 South Korea
- 13.1.5 Southeast Asia
- 13.1.6 Australia
- 13.1.7 Indonesia
- 13.1.8 Phillipes
- 13.1.9 Singapore
- 13.1.10 Thailandc
- 13.1.11 Rest of Asia Pacific
- 14. South America OpenStack Services Industry Analysis, Insights and Forecast, 2019-2031
- 14.1. Market Analysis, Insights and Forecast - By Country/Sub-region
- 14.1.1 Brazil
- 14.1.2 Argentina
- 14.1.3 Peru
- 14.1.4 Chile
- 14.1.5 Colombia
- 14.1.6 Ecuador
- 14.1.7 Venezuela
- 14.1.8 Rest of South America
- 15. North America OpenStack Services Industry Analysis, Insights and Forecast, 2019-2031
- 15.1. Market Analysis, Insights and Forecast - By Country/Sub-region
- 15.1.1 United States
- 15.1.2 Canada
- 15.1.3 Mexico
- 16. MEA OpenStack Services Industry Analysis, Insights and Forecast, 2019-2031
- 16.1. Market Analysis, Insights and Forecast - By Country/Sub-region
- 16.1.1 United Arab Emirates
- 16.1.2 Saudi Arabia
- 16.1.3 South Africa
- 16.1.4 Rest of Middle East and Africa
- 17. Competitive Analysis
- 17.1. Global Market Share Analysis 2024
- 17.2. Company Profiles
- 17.2.1 Mirantis Inc
- 17.2.1.1. Overview
- 17.2.1.2. Products
- 17.2.1.3. SWOT Analysis
- 17.2.1.4. Recent Developments
- 17.2.1.5. Financials (Based on Availability)
- 17.2.2 Canonical Ltd
- 17.2.2.1. Overview
- 17.2.2.2. Products
- 17.2.2.3. SWOT Analysis
- 17.2.2.4. Recent Developments
- 17.2.2.5. Financials (Based on Availability)
- 17.2.3 NetApp Inc
- 17.2.3.1. Overview
- 17.2.3.2. Products
- 17.2.3.3. SWOT Analysis
- 17.2.3.4. Recent Developments
- 17.2.3.5. Financials (Based on Availability)
- 17.2.4 Cisco Systems Inc
- 17.2.4.1. Overview
- 17.2.4.2. Products
- 17.2.4.3. SWOT Analysis
- 17.2.4.4. Recent Developments
- 17.2.4.5. Financials (Based on Availability)
- 17.2.5 Rackspace US Inc
- 17.2.5.1. Overview
- 17.2.5.2. Products
- 17.2.5.3. SWOT Analysis
- 17.2.5.4. Recent Developments
- 17.2.5.5. Financials (Based on Availability)
- 17.2.6 Hewlett Packard Enterprise Development LP
- 17.2.6.1. Overview
- 17.2.6.2. Products
- 17.2.6.3. SWOT Analysis
- 17.2.6.4. Recent Developments
- 17.2.6.5. Financials (Based on Availability)
- 17.2.7 Red Hat Inc
- 17.2.7.1. Overview
- 17.2.7.2. Products
- 17.2.7.3. SWOT Analysis
- 17.2.7.4. Recent Developments
- 17.2.7.5. Financials (Based on Availability)
- 17.2.8 Dell Inc
- 17.2.8.1. Overview
- 17.2.8.2. Products
- 17.2.8.3. SWOT Analysis
- 17.2.8.4. Recent Developments
- 17.2.8.5. Financials (Based on Availability)
- 17.2.9 Huawei Technologies Co Ltd
- 17.2.9.1. Overview
- 17.2.9.2. Products
- 17.2.9.3. SWOT Analysis
- 17.2.9.4. Recent Developments
- 17.2.9.5. Financials (Based on Availability)
- 17.2.10 VMware Inc
- 17.2.10.1. Overview
- 17.2.10.2. Products
- 17.2.10.3. SWOT Analysis
- 17.2.10.4. Recent Developments
- 17.2.10.5. Financials (Based on Availability)
- 17.2.1 Mirantis Inc
List of Figures
- Figure 1: Global OpenStack Services Industry Revenue Breakdown (Million, %) by Region 2024 & 2032
- Figure 2: North America OpenStack Services Industry Revenue (Million), by Country 2024 & 2032
- Figure 3: North America OpenStack Services Industry Revenue Share (%), by Country 2024 & 2032
- Figure 4: Europe OpenStack Services Industry Revenue (Million), by Country 2024 & 2032
- Figure 5: Europe OpenStack Services Industry Revenue Share (%), by Country 2024 & 2032
- Figure 6: Asia Pacific OpenStack Services Industry Revenue (Million), by Country 2024 & 2032
- Figure 7: Asia Pacific OpenStack Services Industry Revenue Share (%), by Country 2024 & 2032
- Figure 8: South America OpenStack Services Industry Revenue (Million), by Country 2024 & 2032
- Figure 9: South America OpenStack Services Industry Revenue Share (%), by Country 2024 & 2032
- Figure 10: North America OpenStack Services Industry Revenue (Million), by Country 2024 & 2032
- Figure 11: North America OpenStack Services Industry Revenue Share (%), by Country 2024 & 2032
- Figure 12: MEA OpenStack Services Industry Revenue (Million), by Country 2024 & 2032
- Figure 13: MEA OpenStack Services Industry Revenue Share (%), by Country 2024 & 2032
- Figure 14: North America OpenStack Services Industry Revenue (Million), by Deployment Model 2024 & 2032
- Figure 15: North America OpenStack Services Industry Revenue Share (%), by Deployment Model 2024 & 2032
- Figure 16: North America OpenStack Services Industry Revenue (Million), by End-user Industry 2024 & 2032
- Figure 17: North America OpenStack Services Industry Revenue Share (%), by End-user Industry 2024 & 2032
- Figure 18: North America OpenStack Services Industry Revenue (Million), by Country 2024 & 2032
- Figure 19: North America OpenStack Services Industry Revenue Share (%), by Country 2024 & 2032
- Figure 20: Europe OpenStack Services Industry Revenue (Million), by Deployment Model 2024 & 2032
- Figure 21: Europe OpenStack Services Industry Revenue Share (%), by Deployment Model 2024 & 2032
- Figure 22: Europe OpenStack Services Industry Revenue (Million), by End-user Industry 2024 & 2032
- Figure 23: Europe OpenStack Services Industry Revenue Share (%), by End-user Industry 2024 & 2032
- Figure 24: Europe OpenStack Services Industry Revenue (Million), by Country 2024 & 2032
- Figure 25: Europe OpenStack Services Industry Revenue Share (%), by Country 2024 & 2032
- Figure 26: Asia OpenStack Services Industry Revenue (Million), by Deployment Model 2024 & 2032
- Figure 27: Asia OpenStack Services Industry Revenue Share (%), by Deployment Model 2024 & 2032
- Figure 28: Asia OpenStack Services Industry Revenue (Million), by End-user Industry 2024 & 2032
- Figure 29: Asia OpenStack Services Industry Revenue Share (%), by End-user Industry 2024 & 2032
- Figure 30: Asia OpenStack Services Industry Revenue (Million), by Country 2024 & 2032
- Figure 31: Asia OpenStack Services Industry Revenue Share (%), by Country 2024 & 2032
- Figure 32: Latin America OpenStack Services Industry Revenue (Million), by Deployment Model 2024 & 2032
- Figure 33: Latin America OpenStack Services Industry Revenue Share (%), by Deployment Model 2024 & 2032
- Figure 34: Latin America OpenStack Services Industry Revenue (Million), by End-user Industry 2024 & 2032
- Figure 35: Latin America OpenStack Services Industry Revenue Share (%), by End-user Industry 2024 & 2032
- Figure 36: Latin America OpenStack Services Industry Revenue (Million), by Country 2024 & 2032
- Figure 37: Latin America OpenStack Services Industry Revenue Share (%), by Country 2024 & 2032
- Figure 38: Middle East and Africa OpenStack Services Industry Revenue (Million), by Deployment Model 2024 & 2032
- Figure 39: Middle East and Africa OpenStack Services Industry Revenue Share (%), by Deployment Model 2024 & 2032
- Figure 40: Middle East and Africa OpenStack Services Industry Revenue (Million), by End-user Industry 2024 & 2032
- Figure 41: Middle East and Africa OpenStack Services Industry Revenue Share (%), by End-user Industry 2024 & 2032
- Figure 42: Middle East and Africa OpenStack Services Industry Revenue (Million), by Country 2024 & 2032
- Figure 43: Middle East and Africa OpenStack Services Industry Revenue Share (%), by Country 2024 & 2032
List of Tables
- Table 1: Global OpenStack Services Industry Revenue Million Forecast, by Region 2019 & 2032
- Table 2: Global OpenStack Services Industry Revenue Million Forecast, by Deployment Model 2019 & 2032
- Table 3: Global OpenStack Services Industry Revenue Million Forecast, by End-user Industry 2019 & 2032
- Table 4: Global OpenStack Services Industry Revenue Million Forecast, by Region 2019 & 2032
- Table 5: Global OpenStack Services Industry Revenue Million Forecast, by Country 2019 & 2032
- Table 6: United States OpenStack Services Industry Revenue (Million) Forecast, by Application 2019 & 2032
- Table 7: Canada OpenStack Services Industry Revenue (Million) Forecast, by Application 2019 & 2032
- Table 8: Mexico OpenStack Services Industry Revenue (Million) Forecast, by Application 2019 & 2032
- Table 9: Global OpenStack Services Industry Revenue Million Forecast, by Country 2019 & 2032
- Table 10: Germany OpenStack Services Industry Revenue (Million) Forecast, by Application 2019 & 2032
- Table 11: United Kingdom OpenStack Services Industry Revenue (Million) Forecast, by Application 2019 & 2032
- Table 12: France OpenStack Services Industry Revenue (Million) Forecast, by Application 2019 & 2032
- Table 13: Spain OpenStack Services Industry Revenue (Million) Forecast, by Application 2019 & 2032
- Table 14: Italy OpenStack Services Industry Revenue (Million) Forecast, by Application 2019 & 2032
- Table 15: Spain OpenStack Services Industry Revenue (Million) Forecast, by Application 2019 & 2032
- Table 16: Belgium OpenStack Services Industry Revenue (Million) Forecast, by Application 2019 & 2032
- Table 17: Netherland OpenStack Services Industry Revenue (Million) Forecast, by Application 2019 & 2032
- Table 18: Nordics OpenStack Services Industry Revenue (Million) Forecast, by Application 2019 & 2032
- Table 19: Rest of Europe OpenStack Services Industry Revenue (Million) Forecast, by Application 2019 & 2032
- Table 20: Global OpenStack Services Industry Revenue Million Forecast, by Country 2019 & 2032
- Table 21: China OpenStack Services Industry Revenue (Million) Forecast, by Application 2019 & 2032
- Table 22: Japan OpenStack Services Industry Revenue (Million) Forecast, by Application 2019 & 2032
- Table 23: India OpenStack Services Industry Revenue (Million) Forecast, by Application 2019 & 2032
- Table 24: South Korea OpenStack Services Industry Revenue (Million) Forecast, by Application 2019 & 2032
- Table 25: Southeast Asia OpenStack Services Industry Revenue (Million) Forecast, by Application 2019 & 2032
- Table 26: Australia OpenStack Services Industry Revenue (Million) Forecast, by Application 2019 & 2032
- Table 27: Indonesia OpenStack Services Industry Revenue (Million) Forecast, by Application 2019 & 2032
- Table 28: Phillipes OpenStack Services Industry Revenue (Million) Forecast, by Application 2019 & 2032
- Table 29: Singapore OpenStack Services Industry Revenue (Million) Forecast, by Application 2019 & 2032
- Table 30: Thailandc OpenStack Services Industry Revenue (Million) Forecast, by Application 2019 & 2032
- Table 31: Rest of Asia Pacific OpenStack Services Industry Revenue (Million) Forecast, by Application 2019 & 2032
- Table 32: Global OpenStack Services Industry Revenue Million Forecast, by Country 2019 & 2032
- Table 33: Brazil OpenStack Services Industry Revenue (Million) Forecast, by Application 2019 & 2032
- Table 34: Argentina OpenStack Services Industry Revenue (Million) Forecast, by Application 2019 & 2032
- Table 35: Peru OpenStack Services Industry Revenue (Million) Forecast, by Application 2019 & 2032
- Table 36: Chile OpenStack Services Industry Revenue (Million) Forecast, by Application 2019 & 2032
- Table 37: Colombia OpenStack Services Industry Revenue (Million) Forecast, by Application 2019 & 2032
- Table 38: Ecuador OpenStack Services Industry Revenue (Million) Forecast, by Application 2019 & 2032
- Table 39: Venezuela OpenStack Services Industry Revenue (Million) Forecast, by Application 2019 & 2032
- Table 40: Rest of South America OpenStack Services Industry Revenue (Million) Forecast, by Application 2019 & 2032
- Table 41: Global OpenStack Services Industry Revenue Million Forecast, by Country 2019 & 2032
- Table 42: United States OpenStack Services Industry Revenue (Million) Forecast, by Application 2019 & 2032
- Table 43: Canada OpenStack Services Industry Revenue (Million) Forecast, by Application 2019 & 2032
- Table 44: Mexico OpenStack Services Industry Revenue (Million) Forecast, by Application 2019 & 2032
- Table 45: Global OpenStack Services Industry Revenue Million Forecast, by Country 2019 & 2032
- Table 46: United Arab Emirates OpenStack Services Industry Revenue (Million) Forecast, by Application 2019 & 2032
- Table 47: Saudi Arabia OpenStack Services Industry Revenue (Million) Forecast, by Application 2019 & 2032
- Table 48: South Africa OpenStack Services Industry Revenue (Million) Forecast, by Application 2019 & 2032
- Table 49: Rest of Middle East and Africa OpenStack Services Industry Revenue (Million) Forecast, by Application 2019 & 2032
- Table 50: Global OpenStack Services Industry Revenue Million Forecast, by Deployment Model 2019 & 2032
- Table 51: Global OpenStack Services Industry Revenue Million Forecast, by End-user Industry 2019 & 2032
- Table 52: Global OpenStack Services Industry Revenue Million Forecast, by Country 2019 & 2032
- Table 53: Global OpenStack Services Industry Revenue Million Forecast, by Deployment Model 2019 & 2032
- Table 54: Global OpenStack Services Industry Revenue Million Forecast, by End-user Industry 2019 & 2032
- Table 55: Global OpenStack Services Industry Revenue Million Forecast, by Country 2019 & 2032
- Table 56: Global OpenStack Services Industry Revenue Million Forecast, by Deployment Model 2019 & 2032
- Table 57: Global OpenStack Services Industry Revenue Million Forecast, by End-user Industry 2019 & 2032
- Table 58: Global OpenStack Services Industry Revenue Million Forecast, by Country 2019 & 2032
- Table 59: Global OpenStack Services Industry Revenue Million Forecast, by Deployment Model 2019 & 2032
- Table 60: Global OpenStack Services Industry Revenue Million Forecast, by End-user Industry 2019 & 2032
- Table 61: Global OpenStack Services Industry Revenue Million Forecast, by Country 2019 & 2032
- Table 62: Global OpenStack Services Industry Revenue Million Forecast, by Deployment Model 2019 & 2032
- Table 63: Global OpenStack Services Industry Revenue Million Forecast, by End-user Industry 2019 & 2032
- Table 64: Global OpenStack Services Industry Revenue Million Forecast, by Country 2019 & 2032
Frequently Asked Questions
1. What is the projected Compound Annual Growth Rate (CAGR) of the OpenStack Services Industry?
The projected CAGR is approximately 32.01%.
2. Which companies are prominent players in the OpenStack Services Industry?
Key companies in the market include Mirantis Inc, Canonical Ltd, NetApp Inc, Cisco Systems Inc, Rackspace US Inc, Hewlett Packard Enterprise Development LP, Red Hat Inc, Dell Inc, Huawei Technologies Co Ltd, VMware Inc.
3. What are the main segments of the OpenStack Services Industry?
The market segments include Deployment Model, End-user Industry.
4. Can you provide details about the market size?
The market size is estimated to be USD 22.81 Million as of 2022.
5. What are some drivers contributing to market growth?
Increasing Need for Organizations to Improve Their Business Agility and Efficiency; OpenStack Being Open Source Provides the Flexibility for Customized Solution; Increasing use of OpenStack Services in Telecommunication Sector.
6. What are the notable trends driving market growth?
Increasing use of OpenStack Services in Telecommunication Sector is Driving the Market.
7. Are there any restraints impacting market growth?
Lack of Robustness that Enterprises Desire for Their Data Centers. Including IT Management Features. Such as Availability and Security.
8. Can you provide examples of recent developments in the market?
October 2023 - UNICC is Partnered with Canonical, the publisher of Ubuntu and provider of open-source security, support and services, to build and deliver the secure private cloud environment for the UN system, offering advanced security and data sovereignty for the UN’s most sensitive data and software applications.
9. What pricing options are available for accessing the report?
Pricing options include single-user, multi-user, and enterprise licenses priced at USD 4750, USD 5250, and USD 8750 respectively.
10. Is the market size provided in terms of value or volume?
The market size is provided in terms of value, measured in Million.
11. Are there any specific market keywords associated with the report?
Yes, the market keyword associated with the report is "OpenStack Services Industry," which aids in identifying and referencing the specific market segment covered.
12. How do I determine which pricing option suits my needs best?
The pricing options vary based on user requirements and access needs. Individual users may opt for single-user licenses, while businesses requiring broader access may choose multi-user or enterprise licenses for cost-effective access to the report.
13. Are there any additional resources or data provided in the OpenStack Services Industry report?
While the report offers comprehensive insights, it's advisable to review the specific contents or supplementary materials provided to ascertain if additional resources or data are available.
14. How can I stay updated on further developments or reports in the OpenStack Services Industry?
To stay informed about further developments, trends, and reports in the OpenStack Services Industry, consider subscribing to industry newsletters, following relevant companies and organizations, or regularly checking reputable industry news sources and publications.
Methodology
Step 1 - Identification of Relevant Samples Size from Population Database


Step 2 - Approaches for Defining Global Market Size (Value, Volume* & Price*)

Note*: In applicable scenarios
Step 3 - Data Sources
Primary Research
- Web Analytics
- Survey Reports
- Research Institute
- Latest Research Reports
- Opinion Leaders
Secondary Research
- Annual Reports
- White Paper
- Latest Press Release
- Industry Association
- Paid Database
- Investor Presentations

Step 4 - Data Triangulation
Involves using different sources of information in order to increase the validity of a study
These sources are likely to be stakeholders in a program - participants, other researchers, program staff, other community members, and so on.
Then we put all data in single framework & apply various statistical tools to find out the dynamic on the market.
During the analysis stage, feedback from the stakeholder groups would be compared to determine areas of agreement as well as areas of divergence


