

Key Insights
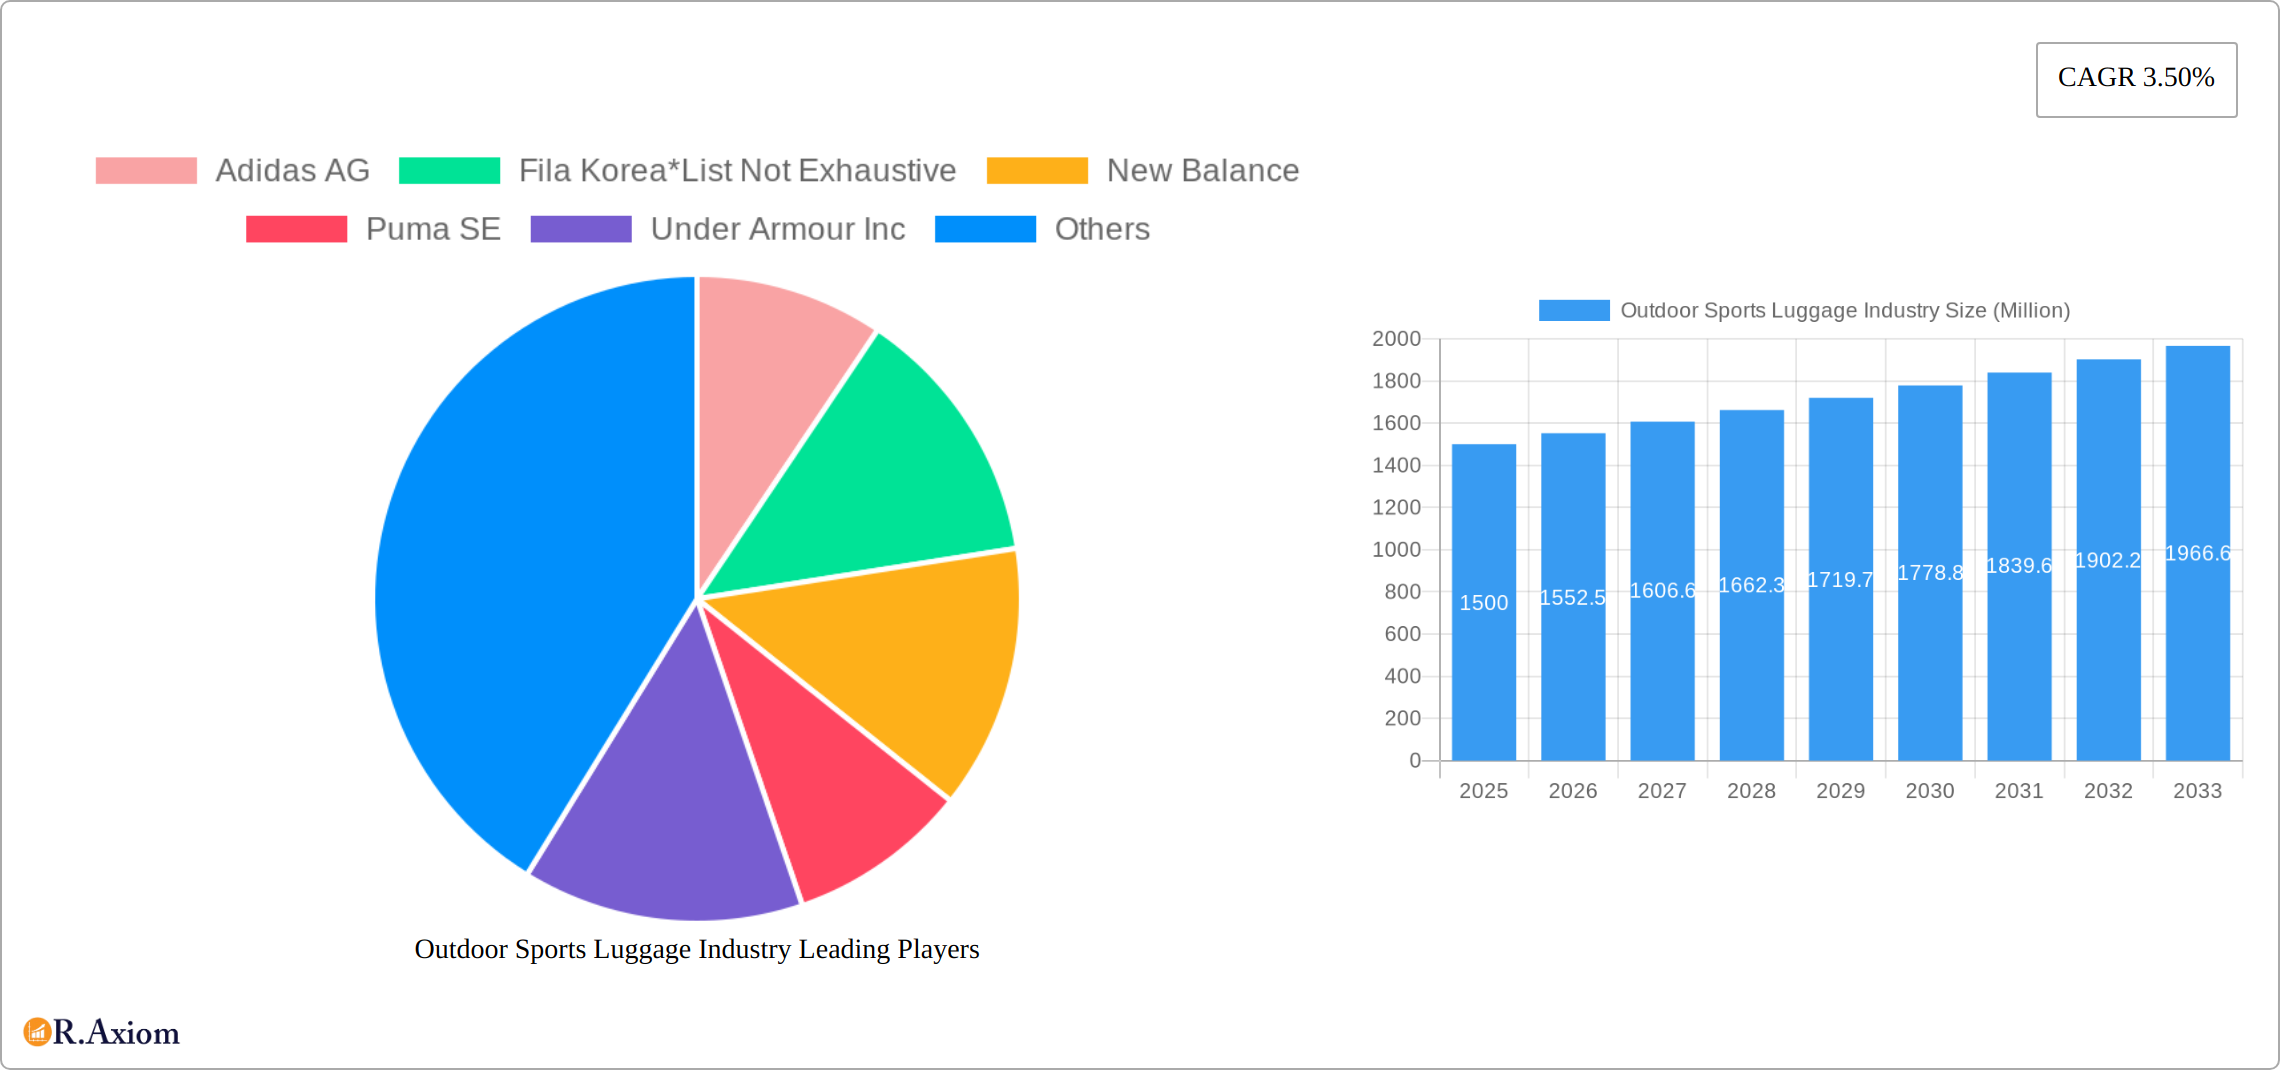
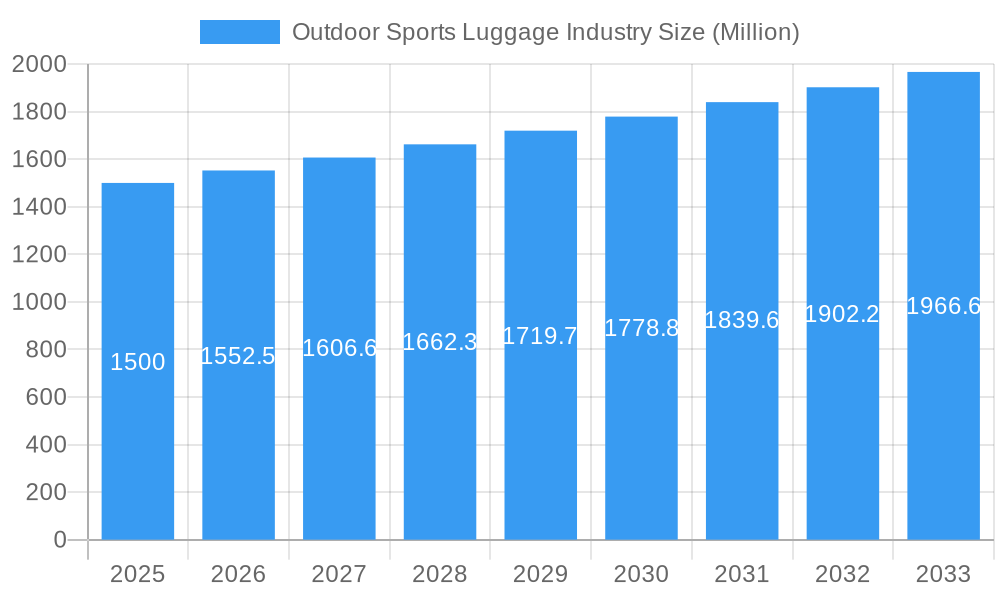
The global outdoor sports luggage market is projected to reach $2.08 billion by 2025, with an anticipated Compound Annual Growth Rate (CAGR) of 6.2% from 2025 to 2033. This expansion is primarily driven by the increasing adoption of outdoor recreational activities, such as hiking and camping, particularly among younger demographics. Growing disposable incomes and a heightened interest in adventure and eco-tourism in emerging economies are also significant growth catalysts. The proliferation of e-commerce provides accessible purchasing channels, while advancements in product design, including the use of lightweight materials and integrated technology, enhance consumer appeal. The rucksack segment remains dominant due to its versatility, and online retail channels are experiencing accelerated growth compared to traditional brick-and-mortar stores. Key industry players are focusing on innovation and expanding their distribution to leverage market opportunities. However, challenges such as fluctuating raw material costs, intense market competition, and environmental sustainability concerns persist.
Outdoor Sports Luggage Industry Market Size (In Billion)
Geographically, North America and Europe currently lead the market, supported by established outdoor sports cultures and robust consumer spending. The Asia-Pacific region is poised for substantial growth, fueled by a burgeoning middle class, increasing outdoor activity participation, and supportive government policies for tourism and sports. While precise regional market shares require deeper investigation, the overall market dynamics indicate a competitive and evolving landscape. The forecast period of 2025-2033 is expected to witness considerable market expansion, underpinned by sustained growth in outdoor pursuits and ongoing product innovation. Strategic collaborations, mergers, and acquisitions are also anticipated to influence market development.
Outdoor Sports Luggage Industry Company Market Share
Outdoor Sports Luggage Industry: A Comprehensive Market Analysis (2019-2033)
This comprehensive report provides a detailed analysis of the global Outdoor Sports Luggage industry, offering invaluable insights for stakeholders, investors, and industry professionals. The report covers the period from 2019 to 2033, with a focus on the estimated year 2025 and a forecast period of 2025-2033. The market size is valued in Millions of USD throughout the report. Key players such as Adidas AG, Fila Korea, New Balance, Puma SE, Under Armour Inc, Mizuno Corporation, Nike Inc, and ASICS Corporation are analyzed, though the list is not exhaustive.
Outdoor Sports Luggage Industry Market Concentration & Innovation
The outdoor sports luggage market presents a dynamic landscape shaped by intense competition, relentless innovation, and evolving regulatory pressures. Market concentration is significant, with leading players like Nike, Adidas, and Under Armour commanding a substantial collective market share (estimated at xx% in 2024). However, the market also features numerous smaller, specialized brands vying for position. This competitive intensity is further fueled by consistent mergers and acquisitions (M&A) activity, with an estimated $xx million in deal value transacted between 2019 and 2024. This activity reflects ongoing efforts to consolidate market share and access new technologies or distribution channels.
Innovation is a key differentiator. Advancements in material science, including the development of lightweight yet exceptionally durable fabrics, are paramount. Ergonomic design improvements enhance user comfort and functionality, while the integration of smart technologies, such as GPS tracking and smart locks, provides added convenience and security. Sustainability is a powerful driver, with a growing emphasis on ethically sourced and recycled materials. This trend is impacting design and manufacturing processes, though the emergence of alternative solutions like minimalist packing cubes presents challenges to traditional luggage models. Consumer preferences are shifting towards versatile, multi-functional luggage adaptable to various outdoor activities, demanding greater adaptability and durability from manufacturers. Regulatory frameworks focused on product safety, environmental impact, and fair labor practices significantly influence the industry's trajectory, demanding compliance and driving innovative solutions.
- Market Concentration: High concentration with top 5 players holding xx% market share in 2024; however, a fragmented market also exists with numerous niche players.
- Innovation Drivers: Advancements in lightweight and durable materials, ergonomic designs, smart technology integration (GPS tracking, smart locks), and the increasing adoption of sustainable and ethically sourced materials.
- M&A Activity: Estimated value of M&A deals exceeding $xx Million (2019-2024), indicating a trend of consolidation and expansion.
- Regulatory Framework: Stringent regulations concerning product safety, environmental sustainability, and ethical sourcing practices are shaping industry standards.
Outdoor Sports Luggage Industry Industry Trends & Insights
The global outdoor sports luggage market experienced robust growth during the historical period (2019-2024), driven primarily by rising disposable incomes, increased participation in outdoor activities, and the growing popularity of travel and adventure tourism. Technological advancements such as the incorporation of GPS tracking and smart features in luggage have further stimulated demand. Consumer preferences are shifting towards lightweight, durable, and aesthetically pleasing luggage options. The competitive dynamics are characterized by intense rivalry among established brands and the emergence of niche players offering specialized products. The market’s Compound Annual Growth Rate (CAGR) during 2019-2024 is estimated at xx%, with a projected CAGR of xx% from 2025 to 2033. Market penetration is relatively high in developed economies, with significant growth potential in emerging markets. Technological disruptions, such as the use of 3D printing for customized luggage and the development of innovative materials, are expected to reshape the industry landscape in the coming years.
Dominant Markets & Segments in Outdoor Sports Luggage Industry
The North American region dominated the outdoor sports luggage market in 2024, followed by Europe and Asia-Pacific. Within these regions, key countries such as the United States, Germany, Japan, and China showcased robust growth. The duffel bag segment is the most dominant in terms of volume, driven by its versatility and affordability.
By Type:
- Duffel Bags: Largest segment driven by versatility and affordability. Key growth drivers include increasing participation in outdoor activities and the rising popularity of weekend getaways.
- Rucksacks: Strong growth driven by hiking, trekking, and backpacking enthusiasts. Technological advancements in materials and ergonomic design are key drivers.
- Other Types: This segment includes rolling suitcases, travel backpacks, and other specialized luggage. The growth is driven by increasing demand for diverse travel options and specific needs of outdoor enthusiasts.
By Distribution Channel:
- Offline Retail Stores: Maintain a significant market share due to the physical examination and purchase experience. Growth is driven by strategic store locations and expansion into new markets.
- Online Retail Stores: Experiencing rapid growth, driven by increased online shopping trends and convenience. Growth drivers include improved e-commerce platforms, competitive pricing, and customer reviews.
Key Drivers:
- Economic growth and rising disposable incomes.
- Increased participation in outdoor recreational activities.
- Growth in travel and tourism.
- Advancements in material science and technology.
Outdoor Sports Luggage Industry Product Developments
Recent product innovations include the integration of smart features like GPS tracking and USB charging ports, lightweight and durable materials such as recycled fabrics, and improved ergonomic designs for enhanced comfort. These advancements cater to the growing demand for functional, sustainable, and technologically advanced luggage. The focus on maximizing durability and minimizing environmental impact drives the development of products tailored to different outdoor activities and preferences.
Report Scope & Segmentation Analysis
This report segments the outdoor sports luggage market by type (Duffel, Rucksack, Other Types) and distribution channel (Offline Retail Stores, Online Retail Stores). Each segment's growth projections, market size, and competitive dynamics are analyzed. The Duffel segment is projected to experience significant growth due to its versatility. The Rucksack segment's growth will be driven by technological innovation and increasing interest in outdoor activities. The “Other Types” segment will show steady growth, reflecting the diversification of consumer needs. Online retail stores will continue to gain market share, driven by e-commerce expansion and improved logistics.
Key Drivers of Outdoor Sports Luggage Industry Growth
The burgeoning outdoor sports luggage market is propelled by several key factors: a global surge in participation in outdoor recreational activities, increased disposable incomes, particularly in emerging economies, fostering greater consumer spending on recreational equipment. The expansion of e-commerce platforms has significantly broadened market reach, while technological advancements in materials and designs continuously improve product offerings. Government initiatives promoting tourism and outdoor adventures further stimulate market expansion by encouraging participation and raising awareness.
Challenges in the Outdoor Sports Luggage Industry Sector
Despite its growth trajectory, the industry confronts significant hurdles. Fluctuations in raw material costs, particularly for specialized fabrics and components, impact profitability. Intense competition, from both established brands and disruptive newcomers, necessitates continuous innovation and efficient cost management. Evolving consumer preferences demand adaptability, requiring brands to stay ahead of trends. Supply chain vulnerabilities and disruptions remain a persistent threat, impacting production timelines and increasing costs. Increasingly stringent environmental regulations add to manufacturing complexities and expenses. Furthermore, the prevalence of counterfeit products poses a considerable challenge, impacting brand reputation and market share. These factors, taken together, can significantly constrain profit margins and impede overall growth.
Emerging Opportunities in Outdoor Sports Luggage Industry
Despite the challenges, significant opportunities abound. The rising demand for eco-friendly and sustainable products presents a lucrative niche market. Expanding into new and emerging markets offers untapped potential for growth. The integration of advanced technologies, including AI-powered features for luggage tracking and management, enhances product value and user experience. The increasing popularity of personalized and customizable luggage options caters to a growing segment of consumers seeking unique and tailored solutions. These trends collectively position the industry for continued evolution and expansion.
Leading Players in the Outdoor Sports Luggage Industry Market
Key Developments in Outdoor Sports Luggage Industry Industry
- 2022 Q4: Adidas launched a new line of sustainable duffel bags made from recycled materials.
- 2023 Q1: Nike partnered with a technology company to integrate smart tracking features into its backpacks.
- 2024 Q2: Under Armour acquired a smaller luggage company specializing in innovative designs. (Further details on this acquisition are available in the full report).
Strategic Outlook for Outdoor Sports Luggage Industry Market
The outdoor sports luggage market is poised for continued growth, driven by evolving consumer preferences, technological advancements, and the expanding global tourism sector. Companies that invest in sustainability, innovation, and strategic partnerships will be well-positioned to capitalize on the market's potential. Focusing on personalization, customization, and integration of smart technology will be crucial to maintain a competitive edge.
Outdoor Sports Luggage Industry Segmentation
-
1. Type
- 1.1. Duffel
- 1.2. Rucksack
- 1.3. Other Types
-
2. Distribution Channel
- 2.1. Offline Retail Stores
- 2.2. Online Retail Stores
Outdoor Sports Luggage Industry Segmentation By Geography
-
1. North America
- 1.1. United States
- 1.2. Canada
- 1.3. Mexico
- 1.4. Rest of North America
-
2. Europe
- 2.1. Spain
- 2.2. United Kingdom
- 2.3. Germany
- 2.4. France
- 2.5. Italy
- 2.6. Russia
- 2.7. Rest of Europe
-
3. Asia Pacific
- 3.1. China
- 3.2. Japan
- 3.3. India
- 3.4. Australia
- 3.5. Rest of Asia Pacific
-
4. South America
- 4.1. Brazil
- 4.2. Argentina
- 4.3. Rest of South America
- 5. Middle East
-
6. South Africa
- 6.1. Saudi Arabia
- 6.2. Rest of Middle East
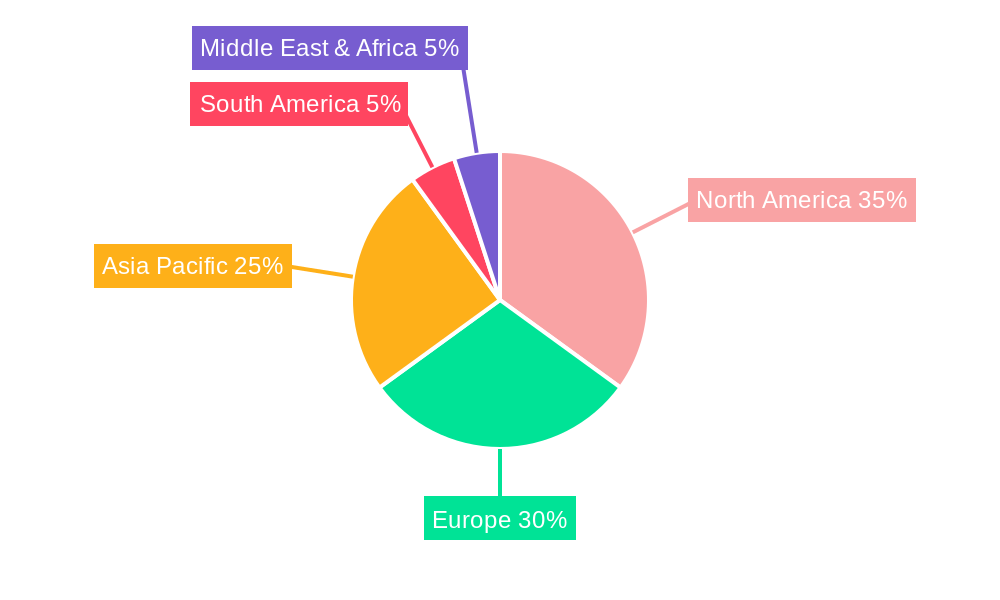
Outdoor Sports Luggage Industry Regional Market Share
Geographic Coverage of Outdoor Sports Luggage Industry
Outdoor Sports Luggage Industry REPORT HIGHLIGHTS
| Aspects | Details |
|---|---|
| Study Period | 2020-2034 |
| Base Year | 2025 |
| Estimated Year | 2026 |
| Forecast Period | 2026-2034 |
| Historical Period | 2020-2025 |
| Growth Rate | CAGR of 6.2% from 2020-2034 |
| Segmentation |
|
Table of Contents
- 1. Introduction
- 1.1. Research Scope
- 1.2. Market Segmentation
- 1.3. Research Objective
- 1.4. Definitions and Assumptions
- 2. Executive Summary
- 2.1. Market Snapshot
- 3. Market Dynamics
- 3.1. Market Drivers
- 3.2. Market Restrains
- 3.3. Market Trends
- 3.4. Market Opportunities
- 4. Market Factor Analysis
- 4.1. Porters Five Forces
- 4.1.1. Bargaining Power of Suppliers
- 4.1.2. Bargaining Power of Buyers
- 4.1.3. Threat of New Entrants
- 4.1.4. Threat of Substitutes
- 4.1.5. Competitive Rivalry
- 4.2. PESTEL analysis
- 4.3. BCG Analysis
- 4.3.1. Stars (High Growth, High Market Share)
- 4.3.2. Cash Cows (Low Growth, High Market Share)
- 4.3.3. Question Mark (High Growth, Low Market Share)
- 4.3.4. Dogs (Low Growth, Low Market Share)
- 4.4. Ansoff Matrix Analysis
- 4.5. Supply Chain Analysis
- 4.6. Regulatory Landscape
- 4.7. Current Market Potential and Opportunity Assessment (TAM–SAM–SOM Framework)
- 4.8. RAX Analyst Note
- 4.1. Porters Five Forces
- 5. Market Analysis, Insights and Forecast 2021-2033
- 5.1. Market Analysis, Insights and Forecast - by Type
- 5.1.1. Duffel
- 5.1.2. Rucksack
- 5.1.3. Other Types
- 5.2. Market Analysis, Insights and Forecast - by Distribution Channel
- 5.2.1. Offline Retail Stores
- 5.2.2. Online Retail Stores
- 5.3. Market Analysis, Insights and Forecast - by Region
- 5.3.1. North America
- 5.3.2. Europe
- 5.3.3. Asia Pacific
- 5.3.4. South America
- 5.3.5. Middle East
- 5.3.6. South Africa
- 5.1. Market Analysis, Insights and Forecast - by Type
- 6. Global Outdoor Sports Luggage Industry Analysis, Insights and Forecast, 2021-2033
- 6.1. Market Analysis, Insights and Forecast - by Type
- 6.1.1. Duffel
- 6.1.2. Rucksack
- 6.1.3. Other Types
- 6.2. Market Analysis, Insights and Forecast - by Distribution Channel
- 6.2.1. Offline Retail Stores
- 6.2.2. Online Retail Stores
- 6.1. Market Analysis, Insights and Forecast - by Type
- 7. North America Outdoor Sports Luggage Industry Analysis, Insights and Forecast, 2020-2032
- 7.1. Market Analysis, Insights and Forecast - by Type
- 7.1.1. Duffel
- 7.1.2. Rucksack
- 7.1.3. Other Types
- 7.2. Market Analysis, Insights and Forecast - by Distribution Channel
- 7.2.1. Offline Retail Stores
- 7.2.2. Online Retail Stores
- 7.1. Market Analysis, Insights and Forecast - by Type
- 8. Europe Outdoor Sports Luggage Industry Analysis, Insights and Forecast, 2020-2032
- 8.1. Market Analysis, Insights and Forecast - by Type
- 8.1.1. Duffel
- 8.1.2. Rucksack
- 8.1.3. Other Types
- 8.2. Market Analysis, Insights and Forecast - by Distribution Channel
- 8.2.1. Offline Retail Stores
- 8.2.2. Online Retail Stores
- 8.1. Market Analysis, Insights and Forecast - by Type
- 9. Asia Pacific Outdoor Sports Luggage Industry Analysis, Insights and Forecast, 2020-2032
- 9.1. Market Analysis, Insights and Forecast - by Type
- 9.1.1. Duffel
- 9.1.2. Rucksack
- 9.1.3. Other Types
- 9.2. Market Analysis, Insights and Forecast - by Distribution Channel
- 9.2.1. Offline Retail Stores
- 9.2.2. Online Retail Stores
- 9.1. Market Analysis, Insights and Forecast - by Type
- 10. South America Outdoor Sports Luggage Industry Analysis, Insights and Forecast, 2020-2032
- 10.1. Market Analysis, Insights and Forecast - by Type
- 10.1.1. Duffel
- 10.1.2. Rucksack
- 10.1.3. Other Types
- 10.2. Market Analysis, Insights and Forecast - by Distribution Channel
- 10.2.1. Offline Retail Stores
- 10.2.2. Online Retail Stores
- 10.1. Market Analysis, Insights and Forecast - by Type
- 11. Middle East Outdoor Sports Luggage Industry Analysis, Insights and Forecast, 2020-2032
- 11.1. Market Analysis, Insights and Forecast - by Type
- 11.1.1. Duffel
- 11.1.2. Rucksack
- 11.1.3. Other Types
- 11.2. Market Analysis, Insights and Forecast - by Distribution Channel
- 11.2.1. Offline Retail Stores
- 11.2.2. Online Retail Stores
- 11.1. Market Analysis, Insights and Forecast - by Type
- 12. South Africa Outdoor Sports Luggage Industry Analysis, Insights and Forecast, 2020-2032
- 12.1. Market Analysis, Insights and Forecast - by Type
- 12.1.1. Duffel
- 12.1.2. Rucksack
- 12.1.3. Other Types
- 12.2. Market Analysis, Insights and Forecast - by Distribution Channel
- 12.2.1. Offline Retail Stores
- 12.2.2. Online Retail Stores
- 12.1. Market Analysis, Insights and Forecast - by Type
- 13. Competitive Analysis
- 13.1. Company Profiles
- 13.1.1 Adidas AG
- 13.1.1.1. Company Overview
- 13.1.1.2. Products
- 13.1.1.3. Company Financials
- 13.1.1.4. SWOT Analysis
- 13.1.2 Fila Korea*List Not Exhaustive
- 13.1.2.1. Company Overview
- 13.1.2.2. Products
- 13.1.2.3. Company Financials
- 13.1.2.4. SWOT Analysis
- 13.1.3 New Balance
- 13.1.3.1. Company Overview
- 13.1.3.2. Products
- 13.1.3.3. Company Financials
- 13.1.3.4. SWOT Analysis
- 13.1.4 Puma SE
- 13.1.4.1. Company Overview
- 13.1.4.2. Products
- 13.1.4.3. Company Financials
- 13.1.4.4. SWOT Analysis
- 13.1.5 Under Armour Inc
- 13.1.5.1. Company Overview
- 13.1.5.2. Products
- 13.1.5.3. Company Financials
- 13.1.5.4. SWOT Analysis
- 13.1.6 Mizuno Corporation
- 13.1.6.1. Company Overview
- 13.1.6.2. Products
- 13.1.6.3. Company Financials
- 13.1.6.4. SWOT Analysis
- 13.1.7 Nike Inc
- 13.1.7.1. Company Overview
- 13.1.7.2. Products
- 13.1.7.3. Company Financials
- 13.1.7.4. SWOT Analysis
- 13.1.8 ASICS Corporation
- 13.1.8.1. Company Overview
- 13.1.8.2. Products
- 13.1.8.3. Company Financials
- 13.1.8.4. SWOT Analysis
- 13.1.1 Adidas AG
- 13.2. Market Entropy
- 13.2.1 Company's Key Areas Served
- 13.2.2 Recent Developments
- 13.3. Company Market Share Analysis 2025
- 13.3.1 Top 5 Companies Market Share Analysis
- 13.3.2 Top 3 Companies Market Share Analysis
- 13.4. List of Potential Customers
- 14. Research Methodology
List of Figures
- Figure 1: Global Outdoor Sports Luggage Industry Revenue Breakdown (billion, %) by Region 2025 & 2033
- Figure 2: Global Outdoor Sports Luggage Industry Volume Breakdown (K Units, %) by Region 2025 & 2033
- Figure 3: North America Outdoor Sports Luggage Industry Revenue (billion), by Type 2025 & 2033
- Figure 4: North America Outdoor Sports Luggage Industry Volume (K Units), by Type 2025 & 2033
- Figure 5: North America Outdoor Sports Luggage Industry Revenue Share (%), by Type 2025 & 2033
- Figure 6: North America Outdoor Sports Luggage Industry Volume Share (%), by Type 2025 & 2033
- Figure 7: North America Outdoor Sports Luggage Industry Revenue (billion), by Distribution Channel 2025 & 2033
- Figure 8: North America Outdoor Sports Luggage Industry Volume (K Units), by Distribution Channel 2025 & 2033
- Figure 9: North America Outdoor Sports Luggage Industry Revenue Share (%), by Distribution Channel 2025 & 2033
- Figure 10: North America Outdoor Sports Luggage Industry Volume Share (%), by Distribution Channel 2025 & 2033
- Figure 11: North America Outdoor Sports Luggage Industry Revenue (billion), by Country 2025 & 2033
- Figure 12: North America Outdoor Sports Luggage Industry Volume (K Units), by Country 2025 & 2033
- Figure 13: North America Outdoor Sports Luggage Industry Revenue Share (%), by Country 2025 & 2033
- Figure 14: North America Outdoor Sports Luggage Industry Volume Share (%), by Country 2025 & 2033
- Figure 15: Europe Outdoor Sports Luggage Industry Revenue (billion), by Type 2025 & 2033
- Figure 16: Europe Outdoor Sports Luggage Industry Volume (K Units), by Type 2025 & 2033
- Figure 17: Europe Outdoor Sports Luggage Industry Revenue Share (%), by Type 2025 & 2033
- Figure 18: Europe Outdoor Sports Luggage Industry Volume Share (%), by Type 2025 & 2033
- Figure 19: Europe Outdoor Sports Luggage Industry Revenue (billion), by Distribution Channel 2025 & 2033
- Figure 20: Europe Outdoor Sports Luggage Industry Volume (K Units), by Distribution Channel 2025 & 2033
- Figure 21: Europe Outdoor Sports Luggage Industry Revenue Share (%), by Distribution Channel 2025 & 2033
- Figure 22: Europe Outdoor Sports Luggage Industry Volume Share (%), by Distribution Channel 2025 & 2033
- Figure 23: Europe Outdoor Sports Luggage Industry Revenue (billion), by Country 2025 & 2033
- Figure 24: Europe Outdoor Sports Luggage Industry Volume (K Units), by Country 2025 & 2033
- Figure 25: Europe Outdoor Sports Luggage Industry Revenue Share (%), by Country 2025 & 2033
- Figure 26: Europe Outdoor Sports Luggage Industry Volume Share (%), by Country 2025 & 2033
- Figure 27: Asia Pacific Outdoor Sports Luggage Industry Revenue (billion), by Type 2025 & 2033
- Figure 28: Asia Pacific Outdoor Sports Luggage Industry Volume (K Units), by Type 2025 & 2033
- Figure 29: Asia Pacific Outdoor Sports Luggage Industry Revenue Share (%), by Type 2025 & 2033
- Figure 30: Asia Pacific Outdoor Sports Luggage Industry Volume Share (%), by Type 2025 & 2033
- Figure 31: Asia Pacific Outdoor Sports Luggage Industry Revenue (billion), by Distribution Channel 2025 & 2033
- Figure 32: Asia Pacific Outdoor Sports Luggage Industry Volume (K Units), by Distribution Channel 2025 & 2033
- Figure 33: Asia Pacific Outdoor Sports Luggage Industry Revenue Share (%), by Distribution Channel 2025 & 2033
- Figure 34: Asia Pacific Outdoor Sports Luggage Industry Volume Share (%), by Distribution Channel 2025 & 2033
- Figure 35: Asia Pacific Outdoor Sports Luggage Industry Revenue (billion), by Country 2025 & 2033
- Figure 36: Asia Pacific Outdoor Sports Luggage Industry Volume (K Units), by Country 2025 & 2033
- Figure 37: Asia Pacific Outdoor Sports Luggage Industry Revenue Share (%), by Country 2025 & 2033
- Figure 38: Asia Pacific Outdoor Sports Luggage Industry Volume Share (%), by Country 2025 & 2033
- Figure 39: South America Outdoor Sports Luggage Industry Revenue (billion), by Type 2025 & 2033
- Figure 40: South America Outdoor Sports Luggage Industry Volume (K Units), by Type 2025 & 2033
- Figure 41: South America Outdoor Sports Luggage Industry Revenue Share (%), by Type 2025 & 2033
- Figure 42: South America Outdoor Sports Luggage Industry Volume Share (%), by Type 2025 & 2033
- Figure 43: South America Outdoor Sports Luggage Industry Revenue (billion), by Distribution Channel 2025 & 2033
- Figure 44: South America Outdoor Sports Luggage Industry Volume (K Units), by Distribution Channel 2025 & 2033
- Figure 45: South America Outdoor Sports Luggage Industry Revenue Share (%), by Distribution Channel 2025 & 2033
- Figure 46: South America Outdoor Sports Luggage Industry Volume Share (%), by Distribution Channel 2025 & 2033
- Figure 47: South America Outdoor Sports Luggage Industry Revenue (billion), by Country 2025 & 2033
- Figure 48: South America Outdoor Sports Luggage Industry Volume (K Units), by Country 2025 & 2033
- Figure 49: South America Outdoor Sports Luggage Industry Revenue Share (%), by Country 2025 & 2033
- Figure 50: South America Outdoor Sports Luggage Industry Volume Share (%), by Country 2025 & 2033
- Figure 51: Middle East Outdoor Sports Luggage Industry Revenue (billion), by Type 2025 & 2033
- Figure 52: Middle East Outdoor Sports Luggage Industry Volume (K Units), by Type 2025 & 2033
- Figure 53: Middle East Outdoor Sports Luggage Industry Revenue Share (%), by Type 2025 & 2033
- Figure 54: Middle East Outdoor Sports Luggage Industry Volume Share (%), by Type 2025 & 2033
- Figure 55: Middle East Outdoor Sports Luggage Industry Revenue (billion), by Distribution Channel 2025 & 2033
- Figure 56: Middle East Outdoor Sports Luggage Industry Volume (K Units), by Distribution Channel 2025 & 2033
- Figure 57: Middle East Outdoor Sports Luggage Industry Revenue Share (%), by Distribution Channel 2025 & 2033
- Figure 58: Middle East Outdoor Sports Luggage Industry Volume Share (%), by Distribution Channel 2025 & 2033
- Figure 59: Middle East Outdoor Sports Luggage Industry Revenue (billion), by Country 2025 & 2033
- Figure 60: Middle East Outdoor Sports Luggage Industry Volume (K Units), by Country 2025 & 2033
- Figure 61: Middle East Outdoor Sports Luggage Industry Revenue Share (%), by Country 2025 & 2033
- Figure 62: Middle East Outdoor Sports Luggage Industry Volume Share (%), by Country 2025 & 2033
- Figure 63: South Africa Outdoor Sports Luggage Industry Revenue (billion), by Type 2025 & 2033
- Figure 64: South Africa Outdoor Sports Luggage Industry Volume (K Units), by Type 2025 & 2033
- Figure 65: South Africa Outdoor Sports Luggage Industry Revenue Share (%), by Type 2025 & 2033
- Figure 66: South Africa Outdoor Sports Luggage Industry Volume Share (%), by Type 2025 & 2033
- Figure 67: South Africa Outdoor Sports Luggage Industry Revenue (billion), by Distribution Channel 2025 & 2033
- Figure 68: South Africa Outdoor Sports Luggage Industry Volume (K Units), by Distribution Channel 2025 & 2033
- Figure 69: South Africa Outdoor Sports Luggage Industry Revenue Share (%), by Distribution Channel 2025 & 2033
- Figure 70: South Africa Outdoor Sports Luggage Industry Volume Share (%), by Distribution Channel 2025 & 2033
- Figure 71: South Africa Outdoor Sports Luggage Industry Revenue (billion), by Country 2025 & 2033
- Figure 72: South Africa Outdoor Sports Luggage Industry Volume (K Units), by Country 2025 & 2033
- Figure 73: South Africa Outdoor Sports Luggage Industry Revenue Share (%), by Country 2025 & 2033
- Figure 74: South Africa Outdoor Sports Luggage Industry Volume Share (%), by Country 2025 & 2033
List of Tables
- Table 1: Global Outdoor Sports Luggage Industry Revenue billion Forecast, by Type 2020 & 2033
- Table 2: Global Outdoor Sports Luggage Industry Volume K Units Forecast, by Type 2020 & 2033
- Table 3: Global Outdoor Sports Luggage Industry Revenue billion Forecast, by Distribution Channel 2020 & 2033
- Table 4: Global Outdoor Sports Luggage Industry Volume K Units Forecast, by Distribution Channel 2020 & 2033
- Table 5: Global Outdoor Sports Luggage Industry Revenue billion Forecast, by Region 2020 & 2033
- Table 6: Global Outdoor Sports Luggage Industry Volume K Units Forecast, by Region 2020 & 2033
- Table 7: Global Outdoor Sports Luggage Industry Revenue billion Forecast, by Type 2020 & 2033
- Table 8: Global Outdoor Sports Luggage Industry Volume K Units Forecast, by Type 2020 & 2033
- Table 9: Global Outdoor Sports Luggage Industry Revenue billion Forecast, by Distribution Channel 2020 & 2033
- Table 10: Global Outdoor Sports Luggage Industry Volume K Units Forecast, by Distribution Channel 2020 & 2033
- Table 11: Global Outdoor Sports Luggage Industry Revenue billion Forecast, by Country 2020 & 2033
- Table 12: Global Outdoor Sports Luggage Industry Volume K Units Forecast, by Country 2020 & 2033
- Table 13: United States Outdoor Sports Luggage Industry Revenue (billion) Forecast, by Application 2020 & 2033
- Table 14: United States Outdoor Sports Luggage Industry Volume (K Units) Forecast, by Application 2020 & 2033
- Table 15: Canada Outdoor Sports Luggage Industry Revenue (billion) Forecast, by Application 2020 & 2033
- Table 16: Canada Outdoor Sports Luggage Industry Volume (K Units) Forecast, by Application 2020 & 2033
- Table 17: Mexico Outdoor Sports Luggage Industry Revenue (billion) Forecast, by Application 2020 & 2033
- Table 18: Mexico Outdoor Sports Luggage Industry Volume (K Units) Forecast, by Application 2020 & 2033
- Table 19: Rest of North America Outdoor Sports Luggage Industry Revenue (billion) Forecast, by Application 2020 & 2033
- Table 20: Rest of North America Outdoor Sports Luggage Industry Volume (K Units) Forecast, by Application 2020 & 2033
- Table 21: Global Outdoor Sports Luggage Industry Revenue billion Forecast, by Type 2020 & 2033
- Table 22: Global Outdoor Sports Luggage Industry Volume K Units Forecast, by Type 2020 & 2033
- Table 23: Global Outdoor Sports Luggage Industry Revenue billion Forecast, by Distribution Channel 2020 & 2033
- Table 24: Global Outdoor Sports Luggage Industry Volume K Units Forecast, by Distribution Channel 2020 & 2033
- Table 25: Global Outdoor Sports Luggage Industry Revenue billion Forecast, by Country 2020 & 2033
- Table 26: Global Outdoor Sports Luggage Industry Volume K Units Forecast, by Country 2020 & 2033
- Table 27: Spain Outdoor Sports Luggage Industry Revenue (billion) Forecast, by Application 2020 & 2033
- Table 28: Spain Outdoor Sports Luggage Industry Volume (K Units) Forecast, by Application 2020 & 2033
- Table 29: United Kingdom Outdoor Sports Luggage Industry Revenue (billion) Forecast, by Application 2020 & 2033
- Table 30: United Kingdom Outdoor Sports Luggage Industry Volume (K Units) Forecast, by Application 2020 & 2033
- Table 31: Germany Outdoor Sports Luggage Industry Revenue (billion) Forecast, by Application 2020 & 2033
- Table 32: Germany Outdoor Sports Luggage Industry Volume (K Units) Forecast, by Application 2020 & 2033
- Table 33: France Outdoor Sports Luggage Industry Revenue (billion) Forecast, by Application 2020 & 2033
- Table 34: France Outdoor Sports Luggage Industry Volume (K Units) Forecast, by Application 2020 & 2033
- Table 35: Italy Outdoor Sports Luggage Industry Revenue (billion) Forecast, by Application 2020 & 2033
- Table 36: Italy Outdoor Sports Luggage Industry Volume (K Units) Forecast, by Application 2020 & 2033
- Table 37: Russia Outdoor Sports Luggage Industry Revenue (billion) Forecast, by Application 2020 & 2033
- Table 38: Russia Outdoor Sports Luggage Industry Volume (K Units) Forecast, by Application 2020 & 2033
- Table 39: Rest of Europe Outdoor Sports Luggage Industry Revenue (billion) Forecast, by Application 2020 & 2033
- Table 40: Rest of Europe Outdoor Sports Luggage Industry Volume (K Units) Forecast, by Application 2020 & 2033
- Table 41: Global Outdoor Sports Luggage Industry Revenue billion Forecast, by Type 2020 & 2033
- Table 42: Global Outdoor Sports Luggage Industry Volume K Units Forecast, by Type 2020 & 2033
- Table 43: Global Outdoor Sports Luggage Industry Revenue billion Forecast, by Distribution Channel 2020 & 2033
- Table 44: Global Outdoor Sports Luggage Industry Volume K Units Forecast, by Distribution Channel 2020 & 2033
- Table 45: Global Outdoor Sports Luggage Industry Revenue billion Forecast, by Country 2020 & 2033
- Table 46: Global Outdoor Sports Luggage Industry Volume K Units Forecast, by Country 2020 & 2033
- Table 47: China Outdoor Sports Luggage Industry Revenue (billion) Forecast, by Application 2020 & 2033
- Table 48: China Outdoor Sports Luggage Industry Volume (K Units) Forecast, by Application 2020 & 2033
- Table 49: Japan Outdoor Sports Luggage Industry Revenue (billion) Forecast, by Application 2020 & 2033
- Table 50: Japan Outdoor Sports Luggage Industry Volume (K Units) Forecast, by Application 2020 & 2033
- Table 51: India Outdoor Sports Luggage Industry Revenue (billion) Forecast, by Application 2020 & 2033
- Table 52: India Outdoor Sports Luggage Industry Volume (K Units) Forecast, by Application 2020 & 2033
- Table 53: Australia Outdoor Sports Luggage Industry Revenue (billion) Forecast, by Application 2020 & 2033
- Table 54: Australia Outdoor Sports Luggage Industry Volume (K Units) Forecast, by Application 2020 & 2033
- Table 55: Rest of Asia Pacific Outdoor Sports Luggage Industry Revenue (billion) Forecast, by Application 2020 & 2033
- Table 56: Rest of Asia Pacific Outdoor Sports Luggage Industry Volume (K Units) Forecast, by Application 2020 & 2033
- Table 57: Global Outdoor Sports Luggage Industry Revenue billion Forecast, by Type 2020 & 2033
- Table 58: Global Outdoor Sports Luggage Industry Volume K Units Forecast, by Type 2020 & 2033
- Table 59: Global Outdoor Sports Luggage Industry Revenue billion Forecast, by Distribution Channel 2020 & 2033
- Table 60: Global Outdoor Sports Luggage Industry Volume K Units Forecast, by Distribution Channel 2020 & 2033
- Table 61: Global Outdoor Sports Luggage Industry Revenue billion Forecast, by Country 2020 & 2033
- Table 62: Global Outdoor Sports Luggage Industry Volume K Units Forecast, by Country 2020 & 2033
- Table 63: Brazil Outdoor Sports Luggage Industry Revenue (billion) Forecast, by Application 2020 & 2033
- Table 64: Brazil Outdoor Sports Luggage Industry Volume (K Units) Forecast, by Application 2020 & 2033
- Table 65: Argentina Outdoor Sports Luggage Industry Revenue (billion) Forecast, by Application 2020 & 2033
- Table 66: Argentina Outdoor Sports Luggage Industry Volume (K Units) Forecast, by Application 2020 & 2033
- Table 67: Rest of South America Outdoor Sports Luggage Industry Revenue (billion) Forecast, by Application 2020 & 2033
- Table 68: Rest of South America Outdoor Sports Luggage Industry Volume (K Units) Forecast, by Application 2020 & 2033
- Table 69: Global Outdoor Sports Luggage Industry Revenue billion Forecast, by Type 2020 & 2033
- Table 70: Global Outdoor Sports Luggage Industry Volume K Units Forecast, by Type 2020 & 2033
- Table 71: Global Outdoor Sports Luggage Industry Revenue billion Forecast, by Distribution Channel 2020 & 2033
- Table 72: Global Outdoor Sports Luggage Industry Volume K Units Forecast, by Distribution Channel 2020 & 2033
- Table 73: Global Outdoor Sports Luggage Industry Revenue billion Forecast, by Country 2020 & 2033
- Table 74: Global Outdoor Sports Luggage Industry Volume K Units Forecast, by Country 2020 & 2033
- Table 75: Global Outdoor Sports Luggage Industry Revenue billion Forecast, by Type 2020 & 2033
- Table 76: Global Outdoor Sports Luggage Industry Volume K Units Forecast, by Type 2020 & 2033
- Table 77: Global Outdoor Sports Luggage Industry Revenue billion Forecast, by Distribution Channel 2020 & 2033
- Table 78: Global Outdoor Sports Luggage Industry Volume K Units Forecast, by Distribution Channel 2020 & 2033
- Table 79: Global Outdoor Sports Luggage Industry Revenue billion Forecast, by Country 2020 & 2033
- Table 80: Global Outdoor Sports Luggage Industry Volume K Units Forecast, by Country 2020 & 2033
- Table 81: Saudi Arabia Outdoor Sports Luggage Industry Revenue (billion) Forecast, by Application 2020 & 2033
- Table 82: Saudi Arabia Outdoor Sports Luggage Industry Volume (K Units) Forecast, by Application 2020 & 2033
- Table 83: Rest of Middle East Outdoor Sports Luggage Industry Revenue (billion) Forecast, by Application 2020 & 2033
- Table 84: Rest of Middle East Outdoor Sports Luggage Industry Volume (K Units) Forecast, by Application 2020 & 2033
Frequently Asked Questions
1. What is the projected Compound Annual Growth Rate (CAGR) of the Outdoor Sports Luggage Industry?
The projected CAGR is approximately 6.2%.
2. Which companies are prominent players in the Outdoor Sports Luggage Industry?
Key companies in the market include Adidas AG, Fila Korea*List Not Exhaustive, New Balance, Puma SE, Under Armour Inc, Mizuno Corporation, Nike Inc, ASICS Corporation.
3. What are the main segments of the Outdoor Sports Luggage Industry?
The market segments include Type, Distribution Channel.
4. Can you provide details about the market size?
The market size is estimated to be USD 2.08 billion as of 2022.
5. What are some drivers contributing to market growth?
Social Media Influence and Aggressive Marketing Fueling Market Demand; Augmented Expenditure on Advertisement and Promotional Activities by Key players.
6. What are the notable trends driving market growth?
Rising Sports Participation Rate Owing to Favorable Government Initiatives.
7. Are there any restraints impacting market growth?
Availability of Counterfiet Products.
8. Can you provide examples of recent developments in the market?
N/A
9. What pricing options are available for accessing the report?
Pricing options include single-user, multi-user, and enterprise licenses priced at USD 4750, USD 5250, and USD 8750 respectively.
10. Is the market size provided in terms of value or volume?
The market size is provided in terms of value, measured in billion and volume, measured in K Units.
11. Are there any specific market keywords associated with the report?
Yes, the market keyword associated with the report is "Outdoor Sports Luggage Industry," which aids in identifying and referencing the specific market segment covered.
12. How do I determine which pricing option suits my needs best?
The pricing options vary based on user requirements and access needs. Individual users may opt for single-user licenses, while businesses requiring broader access may choose multi-user or enterprise licenses for cost-effective access to the report.
13. Are there any additional resources or data provided in the Outdoor Sports Luggage Industry report?
While the report offers comprehensive insights, it's advisable to review the specific contents or supplementary materials provided to ascertain if additional resources or data are available.
14. How can I stay updated on further developments or reports in the Outdoor Sports Luggage Industry?
To stay informed about further developments, trends, and reports in the Outdoor Sports Luggage Industry, consider subscribing to industry newsletters, following relevant companies and organizations, or regularly checking reputable industry news sources and publications.
Methodology
Step 1 - Identification of Relevant Samples Size from Population Database


Step 2 - Approaches for Defining Global Market Size (Value, Volume* & Price*)

Note*: In applicable scenarios
Step 3 - Data Sources
Primary Research
- Web Analytics
- Survey Reports
- Research Institute
- Latest Research Reports
- Opinion Leaders
Secondary Research
- Annual Reports
- White Paper
- Latest Press Release
- Industry Association
- Paid Database
- Investor Presentations

Step 4 - Data Triangulation
Involves using different sources of information in order to increase the validity of a study
These sources are likely to be stakeholders in a program - participants, other researchers, program staff, other community members, and so on.
Then we put all data in single framework & apply various statistical tools to find out the dynamic on the market.
During the analysis stage, feedback from the stakeholder groups would be compared to determine areas of agreement as well as areas of divergence