
Key Insights
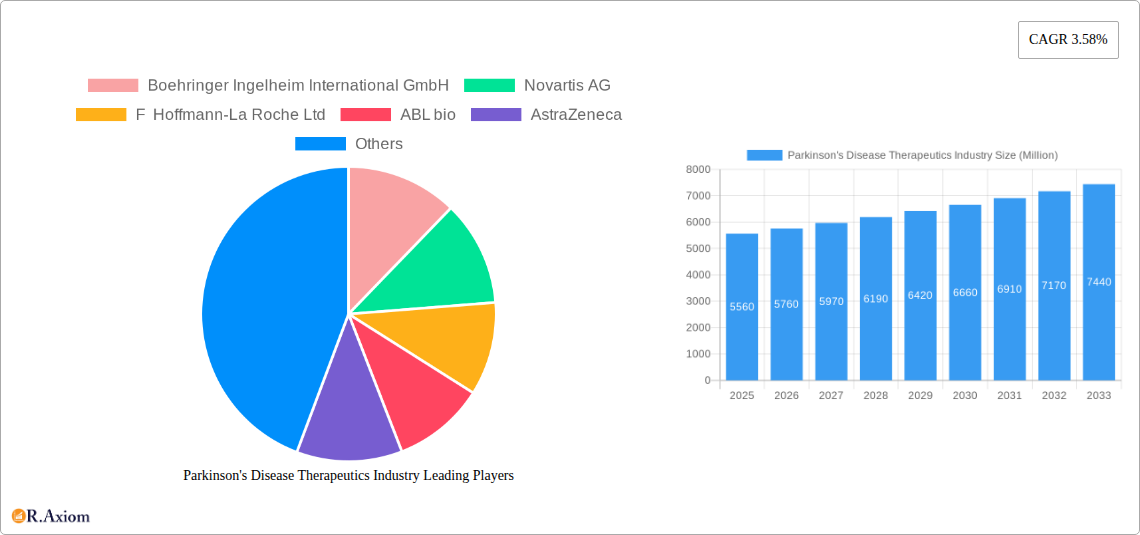
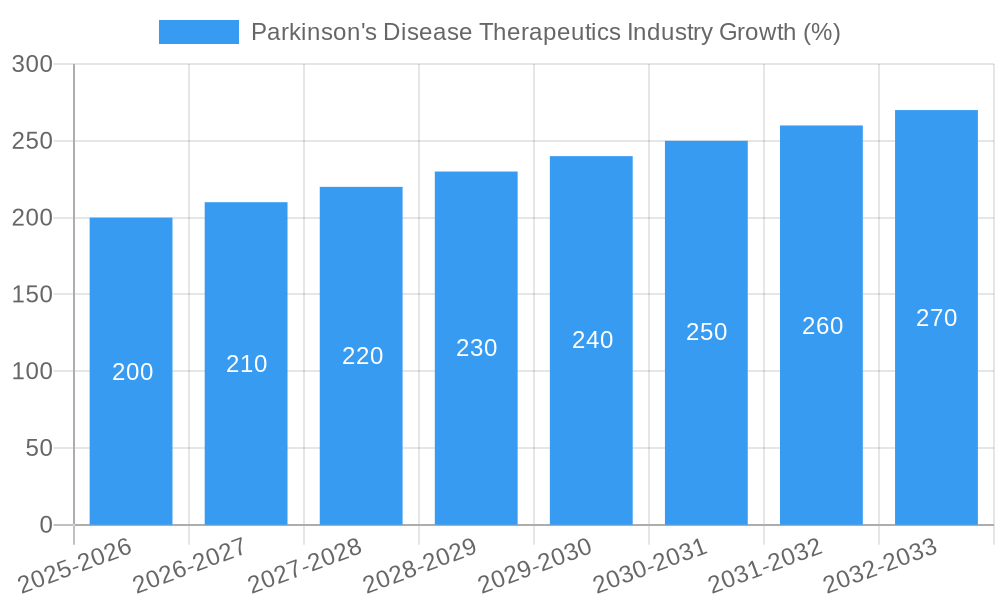
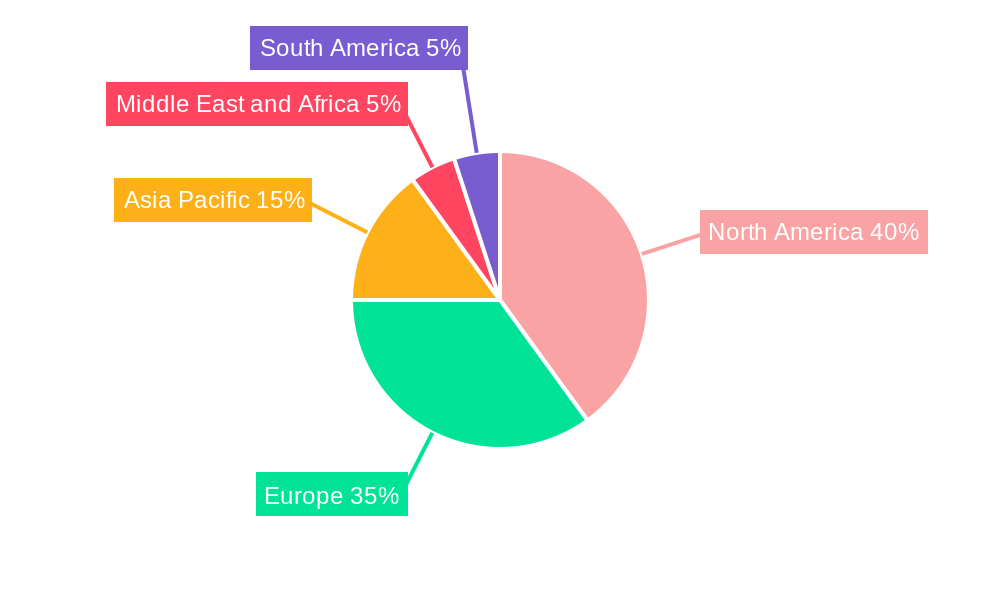
The Parkinson's Disease Therapeutics market, valued at $5.56 billion in 2025, is projected to experience steady growth, driven by an aging global population and increasing prevalence of Parkinson's disease. A compound annual growth rate (CAGR) of 3.58% from 2025 to 2033 indicates a substantial market expansion over the forecast period. Key growth drivers include the ongoing development and launch of novel therapeutics targeting diverse mechanisms of action, a heightened focus on improving patient quality of life through advanced therapies, and increasing investment in research and development from both pharmaceutical companies and government agencies. Market segmentation reveals significant contributions from various drug classes, including dopamine agonists, anticholinergics, MAO-B inhibitors, and levodopa-based therapies, reflecting diverse treatment approaches for managing Parkinson's symptoms. The market is geographically diverse, with North America and Europe currently holding significant market share, but regions such as Asia-Pacific are expected to demonstrate significant growth potential due to rising prevalence and increasing healthcare expenditure. Challenges such as the high cost of advanced therapies, the potential for adverse drug reactions, and the unmet need for disease-modifying treatments pose restraints to overall market growth.
The competitive landscape is characterized by the presence of established pharmaceutical giants such as Boehringer Ingelheim, Novartis, Roche, and AstraZeneca alongside emerging biotechnology companies focused on innovative treatment approaches. Strategic partnerships, mergers and acquisitions, and the development of innovative formulations are shaping market dynamics. Further research into the underlying mechanisms of Parkinson's disease, development of more effective therapies, and improved access to existing treatments across varying healthcare systems will be crucial for shaping the future trajectory of this market. Future market growth will depend heavily on successful clinical trials for newer drug candidates focusing on disease modification, thus potentially extending the market beyond symptom management.
This detailed report provides a comprehensive analysis of the Parkinson's Disease Therapeutics industry, encompassing market size, segmentation, key players, growth drivers, challenges, and future opportunities. The study period covers 2019-2033, with 2025 as the base and estimated year. This report is an invaluable resource for industry stakeholders, investors, researchers, and anyone seeking a deep understanding of this rapidly evolving sector. The report is meticulously researched and leverages high-impact keywords for optimal search engine visibility.
Parkinson's Disease Therapeutics Industry Market Concentration & Innovation
This section analyzes the competitive landscape of the Parkinson's Disease Therapeutics market, focusing on market concentration, innovation drivers, regulatory frameworks, product substitutes, end-user trends, and mergers & acquisitions (M&A) activities.
The market exhibits a moderately concentrated structure, with a few large pharmaceutical companies holding significant market share. Precise market share figures for each company vary depending on the specific therapeutic segment and region, but companies like Boehringer Ingelheim International GmbH, Novartis AG, and F Hoffmann-La Roche Ltd consistently command substantial portions. Smaller biotech firms are also actively contributing to innovation, particularly in novel treatment modalities. M&A activity is significant, driven by the desire to acquire innovative therapies and expand market presence. Deal values vary widely, ranging from millions to billions of USD, reflecting the strategic importance of acquiring promising drug candidates.
- Innovation Drivers: Growing understanding of Parkinson's disease pathophysiology, advancements in drug delivery systems (e.g., blood-brain barrier penetration), and increased funding for research and development are key drivers of innovation.
- Regulatory Frameworks: Stringent regulatory approvals influence market entry and impact pricing strategies.
- Product Substitutes: While no perfect substitutes exist, alternative treatments and management strategies influence market dynamics.
- End-User Trends: Aging populations and rising disease prevalence are significant factors driving market growth.
- M&A Activities: Examples include the January 2022 licensing agreement between ABL Bio Inc. and Sanofi for ABL301. The total value of M&A deals in the sector during the study period (2019-2024) is estimated at xx Million USD.
Parkinson's Disease Therapeutics Industry Industry Trends & Insights
The Parkinson's Disease Therapeutics market is experiencing robust growth, driven by several key factors. The global market size reached xx Million USD in 2024 and is projected to grow at a CAGR of xx% during the forecast period (2025-2033), reaching xx Million USD by 2033. Increased disease prevalence due to aging populations, unmet medical needs, and the emergence of novel therapies are driving this expansion. However, challenges exist, including high drug costs, potential side effects, and the complexity of the disease itself.
Technological advancements, particularly in gene therapy and precision medicine, are transforming the therapeutic landscape. Patient preferences are shifting towards less invasive treatments with improved efficacy and reduced side effects. Competitive dynamics are intense, with both large pharmaceutical companies and smaller biotech firms vying for market share. The market penetration of newly approved therapies varies depending on their effectiveness and cost-effectiveness compared to existing treatments. Future market growth will hinge on successful clinical trials, regulatory approvals, and the successful launch of innovative therapies.
Dominant Markets & Segments in Parkinson's Disease Therapeutics Industry
North America (particularly the US) and Europe currently dominate the Parkinson's Disease Therapeutics market, accounting for the largest market share. This dominance is attributable to higher disease prevalence, established healthcare infrastructure, and robust regulatory frameworks. However, other regions, such as Asia Pacific, are experiencing significant growth due to rising healthcare expenditure and increased awareness of the disease.
- Mechanism of Action:
- Carbidopa-levodopa: Remains the dominant segment due to its established efficacy and widespread use.
- Dopamine Agonists: Significant market share due to their effectiveness in managing motor symptoms.
- MAO-B inhibitors: Moderate market penetration due to their role as adjunctive therapy.
- COMT Inhibitors: Growing market share as adjunctive therapy to improve levodopa efficacy.
- Amantadine: Relatively smaller segment but still a clinically relevant treatment option.
- Anticholinergics: Declining market share due to limited efficacy and significant side effects.
- Other Mechanisms of Action: This segment is experiencing the most rapid growth due to emerging therapies targeting different disease pathways. Examples include those targeting alpha-synuclein aggregation or neuroinflammation.
Key Drivers for Dominant Regions:
- North America: High prevalence of Parkinson’s disease, advanced healthcare infrastructure, and high healthcare expenditure.
- Europe: Similar to North America, characterized by a high prevalence of the disease, a well-established healthcare system, and substantial investment in R&D.
- Asia Pacific: Rapidly growing market driven by an aging population, rising healthcare spending, and increasing awareness of Parkinson's disease.
Parkinson's Disease Therapeutics Industry Product Developments
Recent product developments highlight a shift toward novel therapies targeting various aspects of Parkinson's disease pathophysiology, including alpha-synuclein aggregation, neuroinflammation, and mitochondrial dysfunction. There's significant focus on enhancing drug delivery to improve brain penetration and minimizing side effects. Several companies are developing advanced therapies, such as gene therapies and cell-based therapies, which are still in the early stages of development but hold significant potential. The market fit for these therapies largely depends on their efficacy, safety profiles, and cost-effectiveness.
Report Scope & Segmentation Analysis
This report segments the Parkinson's Disease Therapeutics market based on mechanism of action (Dopamine Agonists, Anticholinergics, MAO-B inhibitors, Amantadine, Carbidopa-levodopa, COMT Inhibitors, Other Mechanisms of Action), geography (North America, Europe, Asia Pacific, Rest of the World), and drug type (oral, injectable). Each segment's growth trajectory, market size, and competitive landscape are analyzed in detail, offering projections for the forecast period (2025-2033). The competitive dynamics of each segment vary, influenced by the number of existing players, the presence of novel therapies, and regulatory approvals.
- Dopamine Agonists: Mature market with established players, but also potential for new formulations and combinations.
- Anticholinergics: Declining segment due to side effects.
- MAO-B inhibitors: Stable segment with some potential for new drugs.
- Amantadine: Small, niche segment.
- Carbidopa-levodopa: Dominant segment, but newer formulations continue to be developed.
- COMT Inhibitors: Growing segment as adjunctive therapies.
- Other Mechanisms of Action: High growth potential with novel therapies.
Key Drivers of Parkinson's Disease Therapeutics Industry Growth
The Parkinson's Disease Therapeutics market is fueled by several key growth drivers:
- Rising Prevalence: The aging global population is leading to a significant increase in Parkinson's disease cases.
- Technological Advancements: Innovations in drug delivery, gene therapy, and precision medicine offer opportunities for new treatments.
- Increased R&D Investment: Pharmaceutical and biotech companies are investing heavily in developing new therapies.
- Favorable Regulatory Environment: Regulatory agencies are supportive of drug development for unmet medical needs.
Challenges in the Parkinson's Disease Therapeutics Industry Sector
Despite the promising outlook, several challenges hinder market growth:
- High Drug Costs: New therapies often come with high price tags, limiting access for patients.
- Side Effects: Many existing treatments have significant side effects that affect patient compliance.
- Complex Disease Pathophysiology: The complex nature of Parkinson's disease makes it difficult to develop effective therapies.
- Long Clinical Trial Times: The lengthy nature of clinical trials for new therapies delays market entry.
Emerging Opportunities in Parkinson's Disease Therapeutics Industry
Significant opportunities exist for market expansion:
- Novel Therapies: New treatment approaches, such as gene therapy and cell-based therapies, offer considerable potential.
- Personalized Medicine: Tailoring treatments to individual patient characteristics could improve efficacy.
- Diagnostics: Advancements in early diagnostics could lead to earlier treatment intervention.
- Expanding into Emerging Markets: Growth potential in developing countries with increasing healthcare expenditure.
Leading Players in the Parkinson's Disease Therapeutics Industry Market
- Boehringer Ingelheim International GmbH
- Novartis AG
- F Hoffmann-La Roche Ltd
- ABL bio
- AstraZeneca
- Teva Pharmaceuticals Industries Ltd
- Prevail Therapeutics
- Kissei Pharmaceutical Co Ltd
- Newron Pharmaceuticals SPA
- Viatris
- AbbVie Inc
- GSK plc
- Amneal Pharmaceuticals LLC
- Pfizer Inc
Key Developments in Parkinson's Disease Therapeutics Industry Industry
- March 2022: Neuron23 raised USD 100 Million to advance Parkinson's disease therapy, planning to commence trials of NEU-723 by the end of the year. This signals significant investment in novel treatment approaches.
- January 2022: ABL Bio Inc. partnered with Sanofi for the worldwide development and commercialization of ABL301, a bispecific antibody targeting alpha-synuclein and IGF1R. This collaboration highlights the strategic importance of innovative drug candidates.
Strategic Outlook for Parkinson's Disease Therapeutics Market
The Parkinson's Disease Therapeutics market is poised for continued growth, driven by aging populations, technological advancements, and increased research and development efforts. The emergence of novel therapies targeting diverse disease mechanisms presents significant opportunities. Future market success will depend on addressing challenges such as high drug costs, side effects, and the complexity of the disease itself. A focus on personalized medicine, early diagnostics, and expanding into emerging markets will further drive market expansion. The market is anticipated to reach a substantial size in the coming years, with significant potential for growth within emerging therapeutic segments.
Parkinson's Disease Therapeutics Industry Segmentation
-
1. Mechanism of Action
- 1.1. Dopamine Agonists
- 1.2. Anticholinergic
- 1.3. MAO-B inhibitors
- 1.4. Amantadine
- 1.5. Carbidopa-levodopa
- 1.6. COMT Inhibitors
- 1.7. Other Mechanisms of Action
Parkinson's Disease Therapeutics Industry Segmentation By Geography
-
1. North America
- 1.1. United States
- 1.2. Canada
- 1.3. Mexico
-
2. Europe
- 2.1. Germany
- 2.2. United Kingdom
- 2.3. France
- 2.4. Italy
- 2.5. Spain
- 2.6. Rest of Europe
-
3. Asia Pacific
- 3.1. China
- 3.2. Japan
- 3.3. India
- 3.4. Australia
- 3.5. South Korea
- 3.6. Rest of Asia Pacific
-
4. Middle East and Africa
- 4.1. GCC
- 4.2. South Africa
- 4.3. Rest of Middle East and Africa
-
5. South America
- 5.1. Brazil
- 5.2. Argentina
- 5.3. Rest of South America
Parkinson's Disease Therapeutics Industry REPORT HIGHLIGHTS
| Aspects | Details |
|---|---|
| Study Period | 2019-2033 |
| Base Year | 2024 |
| Estimated Year | 2025 |
| Forecast Period | 2025-2033 |
| Historical Period | 2019-2024 |
| Growth Rate | CAGR of 3.58% from 2019-2033 |
| Segmentation |
|
Table of Contents
- 1. Introduction
- 1.1. Research Scope
- 1.2. Market Segmentation
- 1.3. Research Methodology
- 1.4. Definitions and Assumptions
- 2. Executive Summary
- 2.1. Introduction
- 3. Market Dynamics
- 3.1. Introduction
- 3.2. Market Drivers
- 3.2.1. Rising Geriatric Population and Burden of Parkinson's Disease; Growing Awareness Among the Population; Increasing R&D and Continuous Drug Approvals
- 3.3. Market Restrains
- 3.3.1. Adverse Events Associated with Therapeutics; High Cost of Treatments Followed by Extremely High R&D Expenditure
- 3.4. Market Trends
- 3.4.1. MAO-B inhibitors Segment is Expected to Dominate the Market Over the Forecast Period
- 4. Market Factor Analysis
- 4.1. Porters Five Forces
- 4.2. Supply/Value Chain
- 4.3. PESTEL analysis
- 4.4. Market Entropy
- 4.5. Patent/Trademark Analysis
- 5. Global Parkinson's Disease Therapeutics Industry Analysis, Insights and Forecast, 2019-2031
- 5.1. Market Analysis, Insights and Forecast - by Mechanism of Action
- 5.1.1. Dopamine Agonists
- 5.1.2. Anticholinergic
- 5.1.3. MAO-B inhibitors
- 5.1.4. Amantadine
- 5.1.5. Carbidopa-levodopa
- 5.1.6. COMT Inhibitors
- 5.1.7. Other Mechanisms of Action
- 5.2. Market Analysis, Insights and Forecast - by Region
- 5.2.1. North America
- 5.2.2. Europe
- 5.2.3. Asia Pacific
- 5.2.4. Middle East and Africa
- 5.2.5. South America
- 5.1. Market Analysis, Insights and Forecast - by Mechanism of Action
- 6. North America Parkinson's Disease Therapeutics Industry Analysis, Insights and Forecast, 2019-2031
- 6.1. Market Analysis, Insights and Forecast - by Mechanism of Action
- 6.1.1. Dopamine Agonists
- 6.1.2. Anticholinergic
- 6.1.3. MAO-B inhibitors
- 6.1.4. Amantadine
- 6.1.5. Carbidopa-levodopa
- 6.1.6. COMT Inhibitors
- 6.1.7. Other Mechanisms of Action
- 6.1. Market Analysis, Insights and Forecast - by Mechanism of Action
- 7. Europe Parkinson's Disease Therapeutics Industry Analysis, Insights and Forecast, 2019-2031
- 7.1. Market Analysis, Insights and Forecast - by Mechanism of Action
- 7.1.1. Dopamine Agonists
- 7.1.2. Anticholinergic
- 7.1.3. MAO-B inhibitors
- 7.1.4. Amantadine
- 7.1.5. Carbidopa-levodopa
- 7.1.6. COMT Inhibitors
- 7.1.7. Other Mechanisms of Action
- 7.1. Market Analysis, Insights and Forecast - by Mechanism of Action
- 8. Asia Pacific Parkinson's Disease Therapeutics Industry Analysis, Insights and Forecast, 2019-2031
- 8.1. Market Analysis, Insights and Forecast - by Mechanism of Action
- 8.1.1. Dopamine Agonists
- 8.1.2. Anticholinergic
- 8.1.3. MAO-B inhibitors
- 8.1.4. Amantadine
- 8.1.5. Carbidopa-levodopa
- 8.1.6. COMT Inhibitors
- 8.1.7. Other Mechanisms of Action
- 8.1. Market Analysis, Insights and Forecast - by Mechanism of Action
- 9. Middle East and Africa Parkinson's Disease Therapeutics Industry Analysis, Insights and Forecast, 2019-2031
- 9.1. Market Analysis, Insights and Forecast - by Mechanism of Action
- 9.1.1. Dopamine Agonists
- 9.1.2. Anticholinergic
- 9.1.3. MAO-B inhibitors
- 9.1.4. Amantadine
- 9.1.5. Carbidopa-levodopa
- 9.1.6. COMT Inhibitors
- 9.1.7. Other Mechanisms of Action
- 9.1. Market Analysis, Insights and Forecast - by Mechanism of Action
- 10. South America Parkinson's Disease Therapeutics Industry Analysis, Insights and Forecast, 2019-2031
- 10.1. Market Analysis, Insights and Forecast - by Mechanism of Action
- 10.1.1. Dopamine Agonists
- 10.1.2. Anticholinergic
- 10.1.3. MAO-B inhibitors
- 10.1.4. Amantadine
- 10.1.5. Carbidopa-levodopa
- 10.1.6. COMT Inhibitors
- 10.1.7. Other Mechanisms of Action
- 10.1. Market Analysis, Insights and Forecast - by Mechanism of Action
- 11. North America Parkinson's Disease Therapeutics Industry Analysis, Insights and Forecast, 2019-2031
- 11.1. Market Analysis, Insights and Forecast - By Country/Sub-region
- 11.1.1 United States
- 11.1.2 Canada
- 11.1.3 Mexico
- 12. Europe Parkinson's Disease Therapeutics Industry Analysis, Insights and Forecast, 2019-2031
- 12.1. Market Analysis, Insights and Forecast - By Country/Sub-region
- 12.1.1 Germany
- 12.1.2 United Kingdom
- 12.1.3 France
- 12.1.4 Italy
- 12.1.5 Spain
- 12.1.6 Rest of Europe
- 13. Asia Pacific Parkinson's Disease Therapeutics Industry Analysis, Insights and Forecast, 2019-2031
- 13.1. Market Analysis, Insights and Forecast - By Country/Sub-region
- 13.1.1 China
- 13.1.2 Japan
- 13.1.3 India
- 13.1.4 Australia
- 13.1.5 South Korea
- 13.1.6 Rest of Asia Pacific
- 14. Middle East and Africa Parkinson's Disease Therapeutics Industry Analysis, Insights and Forecast, 2019-2031
- 14.1. Market Analysis, Insights and Forecast - By Country/Sub-region
- 14.1.1 GCC
- 14.1.2 South Africa
- 14.1.3 Rest of Middle East and Africa
- 15. South America Parkinson's Disease Therapeutics Industry Analysis, Insights and Forecast, 2019-2031
- 15.1. Market Analysis, Insights and Forecast - By Country/Sub-region
- 15.1.1 Brazil
- 15.1.2 Argentina
- 15.1.3 Rest of South America
- 16. Competitive Analysis
- 16.1. Global Market Share Analysis 2024
- 16.2. Company Profiles
- 16.2.1 Boehringer Ingelheim International GmbH
- 16.2.1.1. Overview
- 16.2.1.2. Products
- 16.2.1.3. SWOT Analysis
- 16.2.1.4. Recent Developments
- 16.2.1.5. Financials (Based on Availability)
- 16.2.2 Novartis AG
- 16.2.2.1. Overview
- 16.2.2.2. Products
- 16.2.2.3. SWOT Analysis
- 16.2.2.4. Recent Developments
- 16.2.2.5. Financials (Based on Availability)
- 16.2.3 F Hoffmann-La Roche Ltd
- 16.2.3.1. Overview
- 16.2.3.2. Products
- 16.2.3.3. SWOT Analysis
- 16.2.3.4. Recent Developments
- 16.2.3.5. Financials (Based on Availability)
- 16.2.4 ABL bio
- 16.2.4.1. Overview
- 16.2.4.2. Products
- 16.2.4.3. SWOT Analysis
- 16.2.4.4. Recent Developments
- 16.2.4.5. Financials (Based on Availability)
- 16.2.5 AstraZeneca
- 16.2.5.1. Overview
- 16.2.5.2. Products
- 16.2.5.3. SWOT Analysis
- 16.2.5.4. Recent Developments
- 16.2.5.5. Financials (Based on Availability)
- 16.2.6 Teva Pharmaceuticals Industries Ltd
- 16.2.6.1. Overview
- 16.2.6.2. Products
- 16.2.6.3. SWOT Analysis
- 16.2.6.4. Recent Developments
- 16.2.6.5. Financials (Based on Availability)
- 16.2.7 Prevail Therapeutics
- 16.2.7.1. Overview
- 16.2.7.2. Products
- 16.2.7.3. SWOT Analysis
- 16.2.7.4. Recent Developments
- 16.2.7.5. Financials (Based on Availability)
- 16.2.8 Kissei Pharmaceutical Co Ltd
- 16.2.8.1. Overview
- 16.2.8.2. Products
- 16.2.8.3. SWOT Analysis
- 16.2.8.4. Recent Developments
- 16.2.8.5. Financials (Based on Availability)
- 16.2.9 Newron Pharmaceuticals SPA
- 16.2.9.1. Overview
- 16.2.9.2. Products
- 16.2.9.3. SWOT Analysis
- 16.2.9.4. Recent Developments
- 16.2.9.5. Financials (Based on Availability)
- 16.2.10 Viatris
- 16.2.10.1. Overview
- 16.2.10.2. Products
- 16.2.10.3. SWOT Analysis
- 16.2.10.4. Recent Developments
- 16.2.10.5. Financials (Based on Availability)
- 16.2.11 AbbVie Inc
- 16.2.11.1. Overview
- 16.2.11.2. Products
- 16.2.11.3. SWOT Analysis
- 16.2.11.4. Recent Developments
- 16.2.11.5. Financials (Based on Availability)
- 16.2.12 GSK plc
- 16.2.12.1. Overview
- 16.2.12.2. Products
- 16.2.12.3. SWOT Analysis
- 16.2.12.4. Recent Developments
- 16.2.12.5. Financials (Based on Availability)
- 16.2.13 Amneal Pharmaceuticals LLC
- 16.2.13.1. Overview
- 16.2.13.2. Products
- 16.2.13.3. SWOT Analysis
- 16.2.13.4. Recent Developments
- 16.2.13.5. Financials (Based on Availability)
- 16.2.14 Pfizer Inc
- 16.2.14.1. Overview
- 16.2.14.2. Products
- 16.2.14.3. SWOT Analysis
- 16.2.14.4. Recent Developments
- 16.2.14.5. Financials (Based on Availability)
- 16.2.1 Boehringer Ingelheim International GmbH
List of Figures
- Figure 1: Global Parkinson's Disease Therapeutics Industry Revenue Breakdown (Million, %) by Region 2024 & 2032
- Figure 2: Global Parkinson's Disease Therapeutics Industry Volume Breakdown (K Unit, %) by Region 2024 & 2032
- Figure 3: North America Parkinson's Disease Therapeutics Industry Revenue (Million), by Country 2024 & 2032
- Figure 4: North America Parkinson's Disease Therapeutics Industry Volume (K Unit), by Country 2024 & 2032
- Figure 5: North America Parkinson's Disease Therapeutics Industry Revenue Share (%), by Country 2024 & 2032
- Figure 6: North America Parkinson's Disease Therapeutics Industry Volume Share (%), by Country 2024 & 2032
- Figure 7: Europe Parkinson's Disease Therapeutics Industry Revenue (Million), by Country 2024 & 2032
- Figure 8: Europe Parkinson's Disease Therapeutics Industry Volume (K Unit), by Country 2024 & 2032
- Figure 9: Europe Parkinson's Disease Therapeutics Industry Revenue Share (%), by Country 2024 & 2032
- Figure 10: Europe Parkinson's Disease Therapeutics Industry Volume Share (%), by Country 2024 & 2032
- Figure 11: Asia Pacific Parkinson's Disease Therapeutics Industry Revenue (Million), by Country 2024 & 2032
- Figure 12: Asia Pacific Parkinson's Disease Therapeutics Industry Volume (K Unit), by Country 2024 & 2032
- Figure 13: Asia Pacific Parkinson's Disease Therapeutics Industry Revenue Share (%), by Country 2024 & 2032
- Figure 14: Asia Pacific Parkinson's Disease Therapeutics Industry Volume Share (%), by Country 2024 & 2032
- Figure 15: Middle East and Africa Parkinson's Disease Therapeutics Industry Revenue (Million), by Country 2024 & 2032
- Figure 16: Middle East and Africa Parkinson's Disease Therapeutics Industry Volume (K Unit), by Country 2024 & 2032
- Figure 17: Middle East and Africa Parkinson's Disease Therapeutics Industry Revenue Share (%), by Country 2024 & 2032
- Figure 18: Middle East and Africa Parkinson's Disease Therapeutics Industry Volume Share (%), by Country 2024 & 2032
- Figure 19: South America Parkinson's Disease Therapeutics Industry Revenue (Million), by Country 2024 & 2032
- Figure 20: South America Parkinson's Disease Therapeutics Industry Volume (K Unit), by Country 2024 & 2032
- Figure 21: South America Parkinson's Disease Therapeutics Industry Revenue Share (%), by Country 2024 & 2032
- Figure 22: South America Parkinson's Disease Therapeutics Industry Volume Share (%), by Country 2024 & 2032
- Figure 23: North America Parkinson's Disease Therapeutics Industry Revenue (Million), by Mechanism of Action 2024 & 2032
- Figure 24: North America Parkinson's Disease Therapeutics Industry Volume (K Unit), by Mechanism of Action 2024 & 2032
- Figure 25: North America Parkinson's Disease Therapeutics Industry Revenue Share (%), by Mechanism of Action 2024 & 2032
- Figure 26: North America Parkinson's Disease Therapeutics Industry Volume Share (%), by Mechanism of Action 2024 & 2032
- Figure 27: North America Parkinson's Disease Therapeutics Industry Revenue (Million), by Country 2024 & 2032
- Figure 28: North America Parkinson's Disease Therapeutics Industry Volume (K Unit), by Country 2024 & 2032
- Figure 29: North America Parkinson's Disease Therapeutics Industry Revenue Share (%), by Country 2024 & 2032
- Figure 30: North America Parkinson's Disease Therapeutics Industry Volume Share (%), by Country 2024 & 2032
- Figure 31: Europe Parkinson's Disease Therapeutics Industry Revenue (Million), by Mechanism of Action 2024 & 2032
- Figure 32: Europe Parkinson's Disease Therapeutics Industry Volume (K Unit), by Mechanism of Action 2024 & 2032
- Figure 33: Europe Parkinson's Disease Therapeutics Industry Revenue Share (%), by Mechanism of Action 2024 & 2032
- Figure 34: Europe Parkinson's Disease Therapeutics Industry Volume Share (%), by Mechanism of Action 2024 & 2032
- Figure 35: Europe Parkinson's Disease Therapeutics Industry Revenue (Million), by Country 2024 & 2032
- Figure 36: Europe Parkinson's Disease Therapeutics Industry Volume (K Unit), by Country 2024 & 2032
- Figure 37: Europe Parkinson's Disease Therapeutics Industry Revenue Share (%), by Country 2024 & 2032
- Figure 38: Europe Parkinson's Disease Therapeutics Industry Volume Share (%), by Country 2024 & 2032
- Figure 39: Asia Pacific Parkinson's Disease Therapeutics Industry Revenue (Million), by Mechanism of Action 2024 & 2032
- Figure 40: Asia Pacific Parkinson's Disease Therapeutics Industry Volume (K Unit), by Mechanism of Action 2024 & 2032
- Figure 41: Asia Pacific Parkinson's Disease Therapeutics Industry Revenue Share (%), by Mechanism of Action 2024 & 2032
- Figure 42: Asia Pacific Parkinson's Disease Therapeutics Industry Volume Share (%), by Mechanism of Action 2024 & 2032
- Figure 43: Asia Pacific Parkinson's Disease Therapeutics Industry Revenue (Million), by Country 2024 & 2032
- Figure 44: Asia Pacific Parkinson's Disease Therapeutics Industry Volume (K Unit), by Country 2024 & 2032
- Figure 45: Asia Pacific Parkinson's Disease Therapeutics Industry Revenue Share (%), by Country 2024 & 2032
- Figure 46: Asia Pacific Parkinson's Disease Therapeutics Industry Volume Share (%), by Country 2024 & 2032
- Figure 47: Middle East and Africa Parkinson's Disease Therapeutics Industry Revenue (Million), by Mechanism of Action 2024 & 2032
- Figure 48: Middle East and Africa Parkinson's Disease Therapeutics Industry Volume (K Unit), by Mechanism of Action 2024 & 2032
- Figure 49: Middle East and Africa Parkinson's Disease Therapeutics Industry Revenue Share (%), by Mechanism of Action 2024 & 2032
- Figure 50: Middle East and Africa Parkinson's Disease Therapeutics Industry Volume Share (%), by Mechanism of Action 2024 & 2032
- Figure 51: Middle East and Africa Parkinson's Disease Therapeutics Industry Revenue (Million), by Country 2024 & 2032
- Figure 52: Middle East and Africa Parkinson's Disease Therapeutics Industry Volume (K Unit), by Country 2024 & 2032
- Figure 53: Middle East and Africa Parkinson's Disease Therapeutics Industry Revenue Share (%), by Country 2024 & 2032
- Figure 54: Middle East and Africa Parkinson's Disease Therapeutics Industry Volume Share (%), by Country 2024 & 2032
- Figure 55: South America Parkinson's Disease Therapeutics Industry Revenue (Million), by Mechanism of Action 2024 & 2032
- Figure 56: South America Parkinson's Disease Therapeutics Industry Volume (K Unit), by Mechanism of Action 2024 & 2032
- Figure 57: South America Parkinson's Disease Therapeutics Industry Revenue Share (%), by Mechanism of Action 2024 & 2032
- Figure 58: South America Parkinson's Disease Therapeutics Industry Volume Share (%), by Mechanism of Action 2024 & 2032
- Figure 59: South America Parkinson's Disease Therapeutics Industry Revenue (Million), by Country 2024 & 2032
- Figure 60: South America Parkinson's Disease Therapeutics Industry Volume (K Unit), by Country 2024 & 2032
- Figure 61: South America Parkinson's Disease Therapeutics Industry Revenue Share (%), by Country 2024 & 2032
- Figure 62: South America Parkinson's Disease Therapeutics Industry Volume Share (%), by Country 2024 & 2032
List of Tables
- Table 1: Global Parkinson's Disease Therapeutics Industry Revenue Million Forecast, by Region 2019 & 2032
- Table 2: Global Parkinson's Disease Therapeutics Industry Volume K Unit Forecast, by Region 2019 & 2032
- Table 3: Global Parkinson's Disease Therapeutics Industry Revenue Million Forecast, by Mechanism of Action 2019 & 2032
- Table 4: Global Parkinson's Disease Therapeutics Industry Volume K Unit Forecast, by Mechanism of Action 2019 & 2032
- Table 5: Global Parkinson's Disease Therapeutics Industry Revenue Million Forecast, by Region 2019 & 2032
- Table 6: Global Parkinson's Disease Therapeutics Industry Volume K Unit Forecast, by Region 2019 & 2032
- Table 7: Global Parkinson's Disease Therapeutics Industry Revenue Million Forecast, by Country 2019 & 2032
- Table 8: Global Parkinson's Disease Therapeutics Industry Volume K Unit Forecast, by Country 2019 & 2032
- Table 9: United States Parkinson's Disease Therapeutics Industry Revenue (Million) Forecast, by Application 2019 & 2032
- Table 10: United States Parkinson's Disease Therapeutics Industry Volume (K Unit) Forecast, by Application 2019 & 2032
- Table 11: Canada Parkinson's Disease Therapeutics Industry Revenue (Million) Forecast, by Application 2019 & 2032
- Table 12: Canada Parkinson's Disease Therapeutics Industry Volume (K Unit) Forecast, by Application 2019 & 2032
- Table 13: Mexico Parkinson's Disease Therapeutics Industry Revenue (Million) Forecast, by Application 2019 & 2032
- Table 14: Mexico Parkinson's Disease Therapeutics Industry Volume (K Unit) Forecast, by Application 2019 & 2032
- Table 15: Global Parkinson's Disease Therapeutics Industry Revenue Million Forecast, by Country 2019 & 2032
- Table 16: Global Parkinson's Disease Therapeutics Industry Volume K Unit Forecast, by Country 2019 & 2032
- Table 17: Germany Parkinson's Disease Therapeutics Industry Revenue (Million) Forecast, by Application 2019 & 2032
- Table 18: Germany Parkinson's Disease Therapeutics Industry Volume (K Unit) Forecast, by Application 2019 & 2032
- Table 19: United Kingdom Parkinson's Disease Therapeutics Industry Revenue (Million) Forecast, by Application 2019 & 2032
- Table 20: United Kingdom Parkinson's Disease Therapeutics Industry Volume (K Unit) Forecast, by Application 2019 & 2032
- Table 21: France Parkinson's Disease Therapeutics Industry Revenue (Million) Forecast, by Application 2019 & 2032
- Table 22: France Parkinson's Disease Therapeutics Industry Volume (K Unit) Forecast, by Application 2019 & 2032
- Table 23: Italy Parkinson's Disease Therapeutics Industry Revenue (Million) Forecast, by Application 2019 & 2032
- Table 24: Italy Parkinson's Disease Therapeutics Industry Volume (K Unit) Forecast, by Application 2019 & 2032
- Table 25: Spain Parkinson's Disease Therapeutics Industry Revenue (Million) Forecast, by Application 2019 & 2032
- Table 26: Spain Parkinson's Disease Therapeutics Industry Volume (K Unit) Forecast, by Application 2019 & 2032
- Table 27: Rest of Europe Parkinson's Disease Therapeutics Industry Revenue (Million) Forecast, by Application 2019 & 2032
- Table 28: Rest of Europe Parkinson's Disease Therapeutics Industry Volume (K Unit) Forecast, by Application 2019 & 2032
- Table 29: Global Parkinson's Disease Therapeutics Industry Revenue Million Forecast, by Country 2019 & 2032
- Table 30: Global Parkinson's Disease Therapeutics Industry Volume K Unit Forecast, by Country 2019 & 2032
- Table 31: China Parkinson's Disease Therapeutics Industry Revenue (Million) Forecast, by Application 2019 & 2032
- Table 32: China Parkinson's Disease Therapeutics Industry Volume (K Unit) Forecast, by Application 2019 & 2032
- Table 33: Japan Parkinson's Disease Therapeutics Industry Revenue (Million) Forecast, by Application 2019 & 2032
- Table 34: Japan Parkinson's Disease Therapeutics Industry Volume (K Unit) Forecast, by Application 2019 & 2032
- Table 35: India Parkinson's Disease Therapeutics Industry Revenue (Million) Forecast, by Application 2019 & 2032
- Table 36: India Parkinson's Disease Therapeutics Industry Volume (K Unit) Forecast, by Application 2019 & 2032
- Table 37: Australia Parkinson's Disease Therapeutics Industry Revenue (Million) Forecast, by Application 2019 & 2032
- Table 38: Australia Parkinson's Disease Therapeutics Industry Volume (K Unit) Forecast, by Application 2019 & 2032
- Table 39: South Korea Parkinson's Disease Therapeutics Industry Revenue (Million) Forecast, by Application 2019 & 2032
- Table 40: South Korea Parkinson's Disease Therapeutics Industry Volume (K Unit) Forecast, by Application 2019 & 2032
- Table 41: Rest of Asia Pacific Parkinson's Disease Therapeutics Industry Revenue (Million) Forecast, by Application 2019 & 2032
- Table 42: Rest of Asia Pacific Parkinson's Disease Therapeutics Industry Volume (K Unit) Forecast, by Application 2019 & 2032
- Table 43: Global Parkinson's Disease Therapeutics Industry Revenue Million Forecast, by Country 2019 & 2032
- Table 44: Global Parkinson's Disease Therapeutics Industry Volume K Unit Forecast, by Country 2019 & 2032
- Table 45: GCC Parkinson's Disease Therapeutics Industry Revenue (Million) Forecast, by Application 2019 & 2032
- Table 46: GCC Parkinson's Disease Therapeutics Industry Volume (K Unit) Forecast, by Application 2019 & 2032
- Table 47: South Africa Parkinson's Disease Therapeutics Industry Revenue (Million) Forecast, by Application 2019 & 2032
- Table 48: South Africa Parkinson's Disease Therapeutics Industry Volume (K Unit) Forecast, by Application 2019 & 2032
- Table 49: Rest of Middle East and Africa Parkinson's Disease Therapeutics Industry Revenue (Million) Forecast, by Application 2019 & 2032
- Table 50: Rest of Middle East and Africa Parkinson's Disease Therapeutics Industry Volume (K Unit) Forecast, by Application 2019 & 2032
- Table 51: Global Parkinson's Disease Therapeutics Industry Revenue Million Forecast, by Country 2019 & 2032
- Table 52: Global Parkinson's Disease Therapeutics Industry Volume K Unit Forecast, by Country 2019 & 2032
- Table 53: Brazil Parkinson's Disease Therapeutics Industry Revenue (Million) Forecast, by Application 2019 & 2032
- Table 54: Brazil Parkinson's Disease Therapeutics Industry Volume (K Unit) Forecast, by Application 2019 & 2032
- Table 55: Argentina Parkinson's Disease Therapeutics Industry Revenue (Million) Forecast, by Application 2019 & 2032
- Table 56: Argentina Parkinson's Disease Therapeutics Industry Volume (K Unit) Forecast, by Application 2019 & 2032
- Table 57: Rest of South America Parkinson's Disease Therapeutics Industry Revenue (Million) Forecast, by Application 2019 & 2032
- Table 58: Rest of South America Parkinson's Disease Therapeutics Industry Volume (K Unit) Forecast, by Application 2019 & 2032
- Table 59: Global Parkinson's Disease Therapeutics Industry Revenue Million Forecast, by Mechanism of Action 2019 & 2032
- Table 60: Global Parkinson's Disease Therapeutics Industry Volume K Unit Forecast, by Mechanism of Action 2019 & 2032
- Table 61: Global Parkinson's Disease Therapeutics Industry Revenue Million Forecast, by Country 2019 & 2032
- Table 62: Global Parkinson's Disease Therapeutics Industry Volume K Unit Forecast, by Country 2019 & 2032
- Table 63: United States Parkinson's Disease Therapeutics Industry Revenue (Million) Forecast, by Application 2019 & 2032
- Table 64: United States Parkinson's Disease Therapeutics Industry Volume (K Unit) Forecast, by Application 2019 & 2032
- Table 65: Canada Parkinson's Disease Therapeutics Industry Revenue (Million) Forecast, by Application 2019 & 2032
- Table 66: Canada Parkinson's Disease Therapeutics Industry Volume (K Unit) Forecast, by Application 2019 & 2032
- Table 67: Mexico Parkinson's Disease Therapeutics Industry Revenue (Million) Forecast, by Application 2019 & 2032
- Table 68: Mexico Parkinson's Disease Therapeutics Industry Volume (K Unit) Forecast, by Application 2019 & 2032
- Table 69: Global Parkinson's Disease Therapeutics Industry Revenue Million Forecast, by Mechanism of Action 2019 & 2032
- Table 70: Global Parkinson's Disease Therapeutics Industry Volume K Unit Forecast, by Mechanism of Action 2019 & 2032
- Table 71: Global Parkinson's Disease Therapeutics Industry Revenue Million Forecast, by Country 2019 & 2032
- Table 72: Global Parkinson's Disease Therapeutics Industry Volume K Unit Forecast, by Country 2019 & 2032
- Table 73: Germany Parkinson's Disease Therapeutics Industry Revenue (Million) Forecast, by Application 2019 & 2032
- Table 74: Germany Parkinson's Disease Therapeutics Industry Volume (K Unit) Forecast, by Application 2019 & 2032
- Table 75: United Kingdom Parkinson's Disease Therapeutics Industry Revenue (Million) Forecast, by Application 2019 & 2032
- Table 76: United Kingdom Parkinson's Disease Therapeutics Industry Volume (K Unit) Forecast, by Application 2019 & 2032
- Table 77: France Parkinson's Disease Therapeutics Industry Revenue (Million) Forecast, by Application 2019 & 2032
- Table 78: France Parkinson's Disease Therapeutics Industry Volume (K Unit) Forecast, by Application 2019 & 2032
- Table 79: Italy Parkinson's Disease Therapeutics Industry Revenue (Million) Forecast, by Application 2019 & 2032
- Table 80: Italy Parkinson's Disease Therapeutics Industry Volume (K Unit) Forecast, by Application 2019 & 2032
- Table 81: Spain Parkinson's Disease Therapeutics Industry Revenue (Million) Forecast, by Application 2019 & 2032
- Table 82: Spain Parkinson's Disease Therapeutics Industry Volume (K Unit) Forecast, by Application 2019 & 2032
- Table 83: Rest of Europe Parkinson's Disease Therapeutics Industry Revenue (Million) Forecast, by Application 2019 & 2032
- Table 84: Rest of Europe Parkinson's Disease Therapeutics Industry Volume (K Unit) Forecast, by Application 2019 & 2032
- Table 85: Global Parkinson's Disease Therapeutics Industry Revenue Million Forecast, by Mechanism of Action 2019 & 2032
- Table 86: Global Parkinson's Disease Therapeutics Industry Volume K Unit Forecast, by Mechanism of Action 2019 & 2032
- Table 87: Global Parkinson's Disease Therapeutics Industry Revenue Million Forecast, by Country 2019 & 2032
- Table 88: Global Parkinson's Disease Therapeutics Industry Volume K Unit Forecast, by Country 2019 & 2032
- Table 89: China Parkinson's Disease Therapeutics Industry Revenue (Million) Forecast, by Application 2019 & 2032
- Table 90: China Parkinson's Disease Therapeutics Industry Volume (K Unit) Forecast, by Application 2019 & 2032
- Table 91: Japan Parkinson's Disease Therapeutics Industry Revenue (Million) Forecast, by Application 2019 & 2032
- Table 92: Japan Parkinson's Disease Therapeutics Industry Volume (K Unit) Forecast, by Application 2019 & 2032
- Table 93: India Parkinson's Disease Therapeutics Industry Revenue (Million) Forecast, by Application 2019 & 2032
- Table 94: India Parkinson's Disease Therapeutics Industry Volume (K Unit) Forecast, by Application 2019 & 2032
- Table 95: Australia Parkinson's Disease Therapeutics Industry Revenue (Million) Forecast, by Application 2019 & 2032
- Table 96: Australia Parkinson's Disease Therapeutics Industry Volume (K Unit) Forecast, by Application 2019 & 2032
- Table 97: South Korea Parkinson's Disease Therapeutics Industry Revenue (Million) Forecast, by Application 2019 & 2032
- Table 98: South Korea Parkinson's Disease Therapeutics Industry Volume (K Unit) Forecast, by Application 2019 & 2032
- Table 99: Rest of Asia Pacific Parkinson's Disease Therapeutics Industry Revenue (Million) Forecast, by Application 2019 & 2032
- Table 100: Rest of Asia Pacific Parkinson's Disease Therapeutics Industry Volume (K Unit) Forecast, by Application 2019 & 2032
- Table 101: Global Parkinson's Disease Therapeutics Industry Revenue Million Forecast, by Mechanism of Action 2019 & 2032
- Table 102: Global Parkinson's Disease Therapeutics Industry Volume K Unit Forecast, by Mechanism of Action 2019 & 2032
- Table 103: Global Parkinson's Disease Therapeutics Industry Revenue Million Forecast, by Country 2019 & 2032
- Table 104: Global Parkinson's Disease Therapeutics Industry Volume K Unit Forecast, by Country 2019 & 2032
- Table 105: GCC Parkinson's Disease Therapeutics Industry Revenue (Million) Forecast, by Application 2019 & 2032
- Table 106: GCC Parkinson's Disease Therapeutics Industry Volume (K Unit) Forecast, by Application 2019 & 2032
- Table 107: South Africa Parkinson's Disease Therapeutics Industry Revenue (Million) Forecast, by Application 2019 & 2032
- Table 108: South Africa Parkinson's Disease Therapeutics Industry Volume (K Unit) Forecast, by Application 2019 & 2032
- Table 109: Rest of Middle East and Africa Parkinson's Disease Therapeutics Industry Revenue (Million) Forecast, by Application 2019 & 2032
- Table 110: Rest of Middle East and Africa Parkinson's Disease Therapeutics Industry Volume (K Unit) Forecast, by Application 2019 & 2032
- Table 111: Global Parkinson's Disease Therapeutics Industry Revenue Million Forecast, by Mechanism of Action 2019 & 2032
- Table 112: Global Parkinson's Disease Therapeutics Industry Volume K Unit Forecast, by Mechanism of Action 2019 & 2032
- Table 113: Global Parkinson's Disease Therapeutics Industry Revenue Million Forecast, by Country 2019 & 2032
- Table 114: Global Parkinson's Disease Therapeutics Industry Volume K Unit Forecast, by Country 2019 & 2032
- Table 115: Brazil Parkinson's Disease Therapeutics Industry Revenue (Million) Forecast, by Application 2019 & 2032
- Table 116: Brazil Parkinson's Disease Therapeutics Industry Volume (K Unit) Forecast, by Application 2019 & 2032
- Table 117: Argentina Parkinson's Disease Therapeutics Industry Revenue (Million) Forecast, by Application 2019 & 2032
- Table 118: Argentina Parkinson's Disease Therapeutics Industry Volume (K Unit) Forecast, by Application 2019 & 2032
- Table 119: Rest of South America Parkinson's Disease Therapeutics Industry Revenue (Million) Forecast, by Application 2019 & 2032
- Table 120: Rest of South America Parkinson's Disease Therapeutics Industry Volume (K Unit) Forecast, by Application 2019 & 2032
Frequently Asked Questions
1. What is the projected Compound Annual Growth Rate (CAGR) of the Parkinson's Disease Therapeutics Industry?
The projected CAGR is approximately 3.58%.
2. Which companies are prominent players in the Parkinson's Disease Therapeutics Industry?
Key companies in the market include Boehringer Ingelheim International GmbH, Novartis AG, F Hoffmann-La Roche Ltd, ABL bio, AstraZeneca, Teva Pharmaceuticals Industries Ltd, Prevail Therapeutics, Kissei Pharmaceutical Co Ltd, Newron Pharmaceuticals SPA, Viatris, AbbVie Inc, GSK plc, Amneal Pharmaceuticals LLC, Pfizer Inc.
3. What are the main segments of the Parkinson's Disease Therapeutics Industry?
The market segments include Mechanism of Action.
4. Can you provide details about the market size?
The market size is estimated to be USD 5.56 Million as of 2022.
5. What are some drivers contributing to market growth?
Rising Geriatric Population and Burden of Parkinson's Disease; Growing Awareness Among the Population; Increasing R&D and Continuous Drug Approvals.
6. What are the notable trends driving market growth?
MAO-B inhibitors Segment is Expected to Dominate the Market Over the Forecast Period.
7. Are there any restraints impacting market growth?
Adverse Events Associated with Therapeutics; High Cost of Treatments Followed by Extremely High R&D Expenditure.
8. Can you provide examples of recent developments in the market?
In March 2022, Neuron23 raised USD 100 million to advance Parkinson's disease therapy. The company intends to commence the trials of NEU-723 to potentially treat Parkinson's disease by the end of this year.
9. What pricing options are available for accessing the report?
Pricing options include single-user, multi-user, and enterprise licenses priced at USD 4750, USD 5250, and USD 8750 respectively.
10. Is the market size provided in terms of value or volume?
The market size is provided in terms of value, measured in Million and volume, measured in K Unit.
11. Are there any specific market keywords associated with the report?
Yes, the market keyword associated with the report is "Parkinson's Disease Therapeutics Industry," which aids in identifying and referencing the specific market segment covered.
12. How do I determine which pricing option suits my needs best?
The pricing options vary based on user requirements and access needs. Individual users may opt for single-user licenses, while businesses requiring broader access may choose multi-user or enterprise licenses for cost-effective access to the report.
13. Are there any additional resources or data provided in the Parkinson's Disease Therapeutics Industry report?
While the report offers comprehensive insights, it's advisable to review the specific contents or supplementary materials provided to ascertain if additional resources or data are available.
14. How can I stay updated on further developments or reports in the Parkinson's Disease Therapeutics Industry?
To stay informed about further developments, trends, and reports in the Parkinson's Disease Therapeutics Industry, consider subscribing to industry newsletters, following relevant companies and organizations, or regularly checking reputable industry news sources and publications.
Methodology
Step 1 - Identification of Relevant Samples Size from Population Database


Step 2 - Approaches for Defining Global Market Size (Value, Volume* & Price*)

Note*: In applicable scenarios
Step 3 - Data Sources
Primary Research
- Web Analytics
- Survey Reports
- Research Institute
- Latest Research Reports
- Opinion Leaders
Secondary Research
- Annual Reports
- White Paper
- Latest Press Release
- Industry Association
- Paid Database
- Investor Presentations

Step 4 - Data Triangulation
Involves using different sources of information in order to increase the validity of a study
These sources are likely to be stakeholders in a program - participants, other researchers, program staff, other community members, and so on.
Then we put all data in single framework & apply various statistical tools to find out the dynamic on the market.
During the analysis stage, feedback from the stakeholder groups would be compared to determine areas of agreement as well as areas of divergence


