
Key Insights
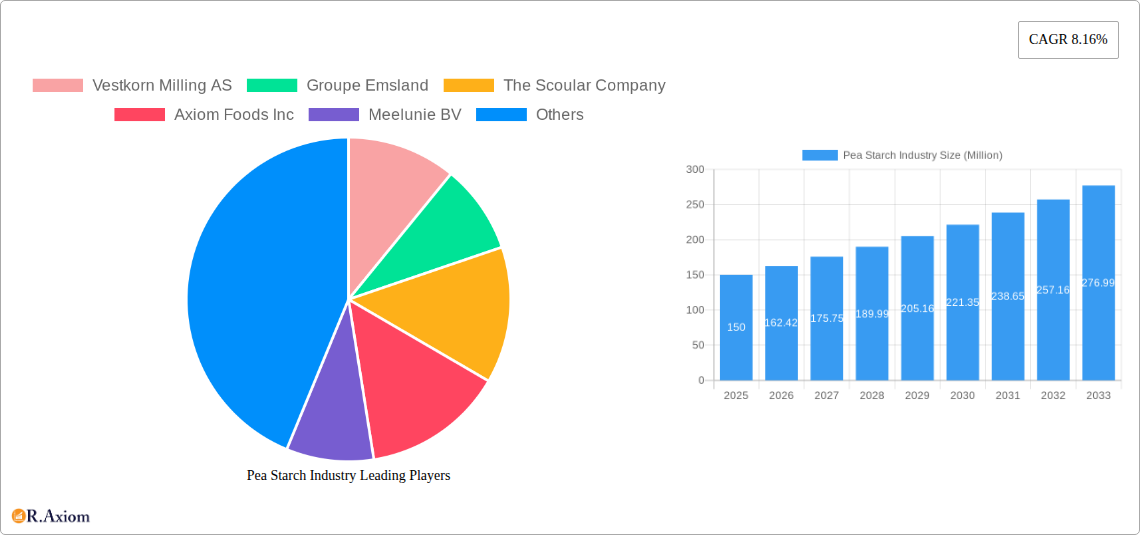
The pea starch market, valued at approximately $XX million in 2025, is experiencing robust growth, projected to expand at a compound annual growth rate (CAGR) of 8.16% from 2025 to 2033. This growth is driven by increasing consumer demand for plant-based and non-GMO food products, coupled with the rising popularity of clean-label ingredients in the food and beverage industry. Pea starch's unique functional properties, including its ability to improve texture, viscosity, and stability in various applications, contribute to its rising adoption. Furthermore, the growing awareness of the health benefits associated with pea protein and its by-product, pea starch, further fuels market expansion. The food and beverage sector dominates the market, with significant contributions from applications in processed foods, bakery items, and beverages. However, burgeoning interest in the use of pea starch in animal feed, pet food, and personal care products presents significant untapped potential for future growth. The market is geographically diverse, with North America and Europe currently holding substantial market shares, but Asia-Pacific is anticipated to witness significant growth in the coming years due to rising disposable incomes and changing dietary preferences.
Competitive dynamics are shaping the market landscape, with key players like Vestkorn Milling AS, Groupe Emsland, and Ingredion Incorporated vying for market share through strategic partnerships, product innovation, and geographical expansion. The market is segmented by both type (organic and conventional) and application, allowing for a granular understanding of market trends. While challenges such as fluctuating raw material prices and the need for continuous innovation to meet evolving consumer preferences exist, the overall outlook for the pea starch market remains positive, indicating substantial growth opportunities in both established and emerging markets. Continued research and development efforts focusing on enhancing functional properties and exploring new applications will further propel market expansion throughout the forecast period.
Pea Starch Industry: A Comprehensive Market Report (2019-2033)
This comprehensive report provides a detailed analysis of the global pea starch industry, offering invaluable insights for industry stakeholders, investors, and market researchers. Covering the period from 2019 to 2033, with a focus on 2025, this report examines market dynamics, competitive landscapes, and future growth potential. The report's detailed segmentation, encompassing source (organic, conventional), application (food and beverage, animal feed and pet food, personal care and cosmetics), and key players, provides a granular understanding of the market's structure and evolution. The global pea starch market size is estimated at xx Million in 2025 and is projected to reach xx Million by 2033, exhibiting a CAGR of xx% during the forecast period (2025-2033).
Pea Starch Industry Market Concentration & Innovation
The pea starch market exhibits a moderately concentrated structure, with several key players holding significant market share. While precise market share figures for each company remain proprietary, companies such as Roquette Freres, Ingredion Incorporated, and Cosucra-Groupe Warcoing are recognized as major players. The market is witnessing continuous innovation, driven by the growing demand for clean-label, plant-based ingredients. This is reflected in the increasing number of new product launches featuring pea starch in diverse applications. Regulatory frameworks related to food safety and labeling influence market dynamics, while the presence of substitute ingredients like corn starch and tapioca starch creates competitive pressure. Mergers and acquisitions (M&A) activity in the sector, although not frequent, shapes the market landscape. Recent M&A deal values are not publicly disclosed but contribute to the consolidation of the market.
- Key Innovation Drivers: Clean label trends, growing demand for plant-based ingredients, functional food applications.
- Regulatory Frameworks: Food safety regulations, labeling requirements impacting ingredient sourcing and processing.
- Product Substitutes: Corn starch, tapioca starch, potato starch.
- End-User Trends: Rising preference for healthy and sustainable food products.
- M&A Activities: While data on M&A deal values is limited, the activity contributes to market consolidation and innovation.
Pea Starch Industry Industry Trends & Insights
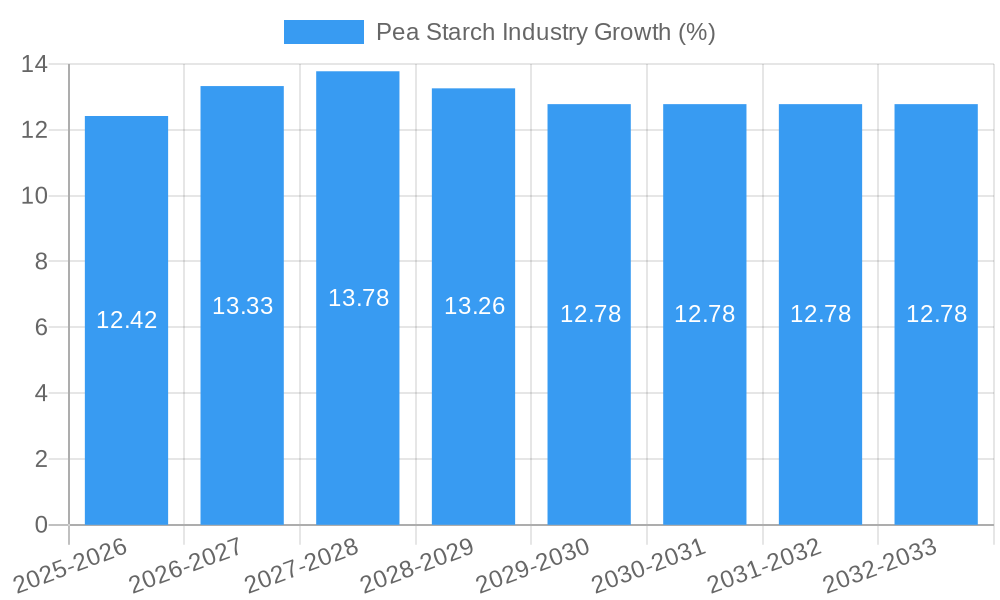
The global pea starch market is experiencing robust growth, fueled by several key factors. The surging demand for plant-based and vegan products across various sectors, including food and beverage, is a major driver. The increasing health consciousness among consumers, coupled with the clean-label appeal of pea starch, further contributes to market expansion. Technological advancements in pea starch processing and extraction techniques are enhancing product quality and efficiency. The market's competitive dynamics are characterized by innovation, product diversification, and strategic partnerships.
The market penetration of pea starch is steadily increasing, driven by its versatility in numerous applications and its sustainable production methods. The CAGR for the pea starch market during the historical period (2019-2024) is estimated at xx%, while the projected CAGR for the forecast period (2025-2033) is xx%. This signifies a strong growth trajectory for the industry, fueled by consumer preference shifts towards healthier and more sustainable food options and the continuous advancement in pea starch processing technology.
Dominant Markets & Segments in Pea Starch Industry
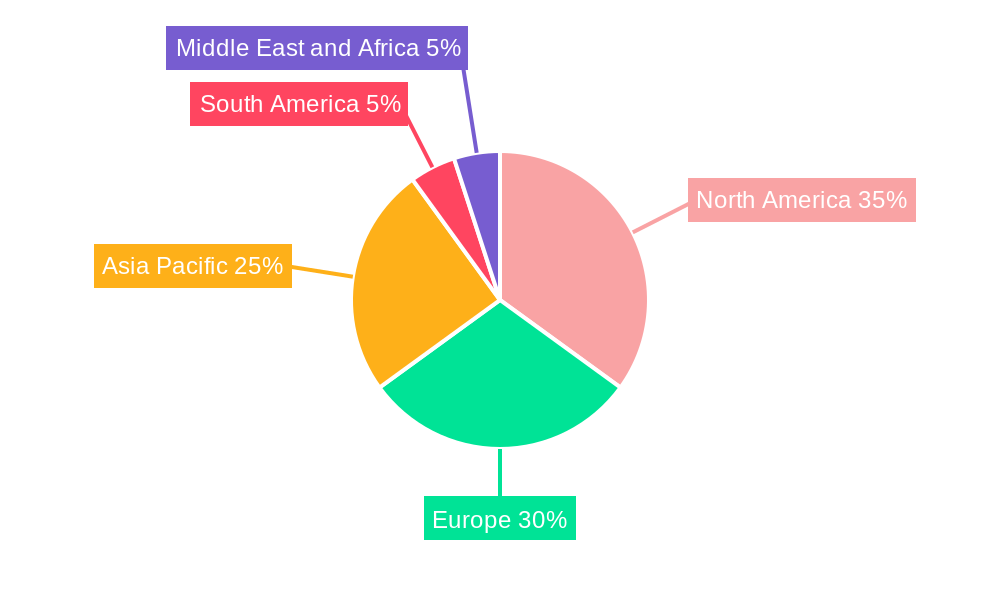
The food and beverage segment currently dominates the pea starch market, driven by the increasing use of pea starch as a thickening agent, stabilizer, and binder in various food products. The organic pea starch segment is also experiencing rapid growth due to the rising demand for organic and sustainably produced food ingredients. Geographically, North America and Europe are currently the leading regions for pea starch consumption, owing to the presence of major pea starch producers and robust demand from the food and beverage sector.
- Key Drivers in Dominant Segments:
- Food & Beverage: Growing demand for plant-based foods, health consciousness, clean-label trends.
- Organic: Growing consumer preference for organic and sustainably sourced ingredients.
- North America & Europe: Strong established food processing industries, high consumer disposable income, proactive regulatory frameworks encouraging sustainable food systems.
Pea Starch Industry Product Developments
Recent product innovations in the pea starch market include the development of new, functional pea starches with improved properties, such as enhanced texture and stability. This is driven by the need to meet the varied requirements of different food applications. Companies are focusing on developing customized pea starch solutions tailored to specific food products to enhance the appeal and functionality of their products. This trend highlights the close relationship between technological advancements and market demands, as manufacturers constantly seek to improve product features to meet consumer expectations and stand out in the competitive landscape.
Report Scope & Segmentation Analysis
This report segments the pea starch market based on source (organic and conventional) and application (food and beverage, animal feed and pet food, and personal care and cosmetics).
Source: The organic segment is projected to experience faster growth than the conventional segment due to increasing consumer preference for organically produced food ingredients.
Application: The food and beverage segment is currently the largest application segment, followed by animal feed and pet food, and personal care and cosmetics. Each segment's growth is projected based on specific market dynamics, including regulatory trends and consumer preferences. Competitive dynamics vary across segments, reflecting the specialized nature of product formulations and customer demands.
Key Drivers of Pea Starch Industry Growth
The pea starch industry's growth is driven by several factors: the increasing demand for plant-based ingredients, growing consumer awareness of health and wellness, and the rising preference for clean-label products. Technological advancements, particularly in the extraction and processing of pea starch, are also enhancing efficiency and enabling the production of higher-quality products. Favorable government policies supporting sustainable agriculture and the development of plant-based industries are providing additional impetus to the market's expansion.
Challenges in the Pea Starch Industry Sector
The pea starch industry faces challenges such as price volatility in raw materials (peas), fluctuating energy costs influencing production expenses, and competition from established starch alternatives like corn and potato starch. Supply chain disruptions can affect pea starch availability and prices, while stringent regulatory compliance requirements add to operational complexity and costs. Maintaining consistent product quality across batches and meeting the evolving needs of diverse applications remain ongoing challenges.
Emerging Opportunities in Pea Starch Industry
Emerging opportunities exist in expanding pea starch applications into niche sectors, such as pharmaceuticals and bioplastics. The development of novel pea starch derivatives with enhanced functionality opens new avenues for market penetration. Targeting emerging markets in Asia and Latin America, characterized by growing consumer populations and increasing disposable incomes, presents significant potential for market expansion. Sustainable sourcing and transparent supply chain management can attract environmentally conscious consumers, further enhancing the industry's appeal.
Leading Players in the Pea Starch Industry Market
- Vestkorn Milling AS
- Groupe Emsland
- The Scoular Company
- Axiom Foods Inc
- Meelunie BV
- Ingredion Incorporated
- Cosucra- Groupe Warcoing
- Roquette Freres
- Puris Foods
- Yantai Shuangta Food Co Ltd
Key Developments in Pea Starch Industry Industry
- October 2022: Roquette Freres launched a new line of organic pea ingredients, including pea starch and organic pea protein, expanding its product portfolio and solidifying its position in the market.
- May 2021: Gillco Ingredients and Cosucra Inc. entered a distribution agreement, broadening the reach of Cosucra's pea starch products in the US market.
- March 2021: Ingredion added Purity P 1002 pea starch to its plant-based portfolio, enhancing its offerings in the growing plant-based food sector.
Strategic Outlook for Pea Starch Industry Market
The pea starch industry is poised for sustained growth, driven by ongoing trends towards plant-based diets and increased consumer demand for clean-label products. Further innovation in pea starch processing and the exploration of new applications will be crucial for market expansion. Companies that invest in research and development, prioritize sustainable sourcing practices, and effectively address supply chain challenges will be best positioned to capitalize on the significant growth opportunities in this dynamic market.
Pea Starch Industry Segmentation
-
1. Source
- 1.1. Organic
- 1.2. Conventional
-
2. Application
-
2.1. Food and Beverage
- 2.1.1. Bakery Products
- 2.1.2. Soups and Sauces
- 2.1.3. Snacks and Cereals
- 2.1.4. Meat and Meat Products
- 2.1.5. Dairy
- 2.1.6. Other Food and Beverage Applications
- 2.2. Animal Feed and Pet Food
- 2.3. Personal Care and Cosmetics
-
2.1. Food and Beverage
Pea Starch Industry Segmentation By Geography
-
1. North America
- 1.1. United States
- 1.2. Canada
- 1.3. Mexico
- 1.4. Rest of North America
-
2. Europe
- 2.1. United Kingdom
- 2.2. Germany
- 2.3. Spain
- 2.4. France
- 2.5. Italy
- 2.6. Russia
- 2.7. Rest of Europe
-
3. Asia Pacific
- 3.1. China
- 3.2. Japan
- 3.3. India
- 3.4. Australia
- 3.5. Rest of Asia Pacific
-
4. South America
- 4.1. Brazil
- 4.2. Argentina
- 4.3. Rest of South America
-
5. Middle East and Africa
- 5.1. Saudi Arabia
- 5.2. South Africa
- 5.3. Rest of Middle East and Africa
Pea Starch Industry REPORT HIGHLIGHTS
| Aspects | Details |
|---|---|
| Study Period | 2019-2033 |
| Base Year | 2024 |
| Estimated Year | 2025 |
| Forecast Period | 2025-2033 |
| Historical Period | 2019-2024 |
| Growth Rate | CAGR of 8.16% from 2019-2033 |
| Segmentation |
|
Table of Contents
- 1. Introduction
- 1.1. Research Scope
- 1.2. Market Segmentation
- 1.3. Research Methodology
- 1.4. Definitions and Assumptions
- 2. Executive Summary
- 2.1. Introduction
- 3. Market Dynamics
- 3.1. Introduction
- 3.2. Market Drivers
- 3.2.1. Growing Awareness About Insect & Other Alternative Proteins; Increasing Applications Surge Demand for Insect Protein
- 3.3. Market Restrains
- 3.3.1. Augmenting Market Penetration of Other Proteins
- 3.4. Market Trends
- 3.4.1. Consumer Preference for Free-from Food is Driving the Pea Starch Demand
- 4. Market Factor Analysis
- 4.1. Porters Five Forces
- 4.2. Supply/Value Chain
- 4.3. PESTEL analysis
- 4.4. Market Entropy
- 4.5. Patent/Trademark Analysis
- 5. Global Pea Starch Industry Analysis, Insights and Forecast, 2019-2031
- 5.1. Market Analysis, Insights and Forecast - by Source
- 5.1.1. Organic
- 5.1.2. Conventional
- 5.2. Market Analysis, Insights and Forecast - by Application
- 5.2.1. Food and Beverage
- 5.2.1.1. Bakery Products
- 5.2.1.2. Soups and Sauces
- 5.2.1.3. Snacks and Cereals
- 5.2.1.4. Meat and Meat Products
- 5.2.1.5. Dairy
- 5.2.1.6. Other Food and Beverage Applications
- 5.2.2. Animal Feed and Pet Food
- 5.2.3. Personal Care and Cosmetics
- 5.2.1. Food and Beverage
- 5.3. Market Analysis, Insights and Forecast - by Region
- 5.3.1. North America
- 5.3.2. Europe
- 5.3.3. Asia Pacific
- 5.3.4. South America
- 5.3.5. Middle East and Africa
- 5.1. Market Analysis, Insights and Forecast - by Source
- 6. North America Pea Starch Industry Analysis, Insights and Forecast, 2019-2031
- 6.1. Market Analysis, Insights and Forecast - by Source
- 6.1.1. Organic
- 6.1.2. Conventional
- 6.2. Market Analysis, Insights and Forecast - by Application
- 6.2.1. Food and Beverage
- 6.2.1.1. Bakery Products
- 6.2.1.2. Soups and Sauces
- 6.2.1.3. Snacks and Cereals
- 6.2.1.4. Meat and Meat Products
- 6.2.1.5. Dairy
- 6.2.1.6. Other Food and Beverage Applications
- 6.2.2. Animal Feed and Pet Food
- 6.2.3. Personal Care and Cosmetics
- 6.2.1. Food and Beverage
- 6.1. Market Analysis, Insights and Forecast - by Source
- 7. Europe Pea Starch Industry Analysis, Insights and Forecast, 2019-2031
- 7.1. Market Analysis, Insights and Forecast - by Source
- 7.1.1. Organic
- 7.1.2. Conventional
- 7.2. Market Analysis, Insights and Forecast - by Application
- 7.2.1. Food and Beverage
- 7.2.1.1. Bakery Products
- 7.2.1.2. Soups and Sauces
- 7.2.1.3. Snacks and Cereals
- 7.2.1.4. Meat and Meat Products
- 7.2.1.5. Dairy
- 7.2.1.6. Other Food and Beverage Applications
- 7.2.2. Animal Feed and Pet Food
- 7.2.3. Personal Care and Cosmetics
- 7.2.1. Food and Beverage
- 7.1. Market Analysis, Insights and Forecast - by Source
- 8. Asia Pacific Pea Starch Industry Analysis, Insights and Forecast, 2019-2031
- 8.1. Market Analysis, Insights and Forecast - by Source
- 8.1.1. Organic
- 8.1.2. Conventional
- 8.2. Market Analysis, Insights and Forecast - by Application
- 8.2.1. Food and Beverage
- 8.2.1.1. Bakery Products
- 8.2.1.2. Soups and Sauces
- 8.2.1.3. Snacks and Cereals
- 8.2.1.4. Meat and Meat Products
- 8.2.1.5. Dairy
- 8.2.1.6. Other Food and Beverage Applications
- 8.2.2. Animal Feed and Pet Food
- 8.2.3. Personal Care and Cosmetics
- 8.2.1. Food and Beverage
- 8.1. Market Analysis, Insights and Forecast - by Source
- 9. South America Pea Starch Industry Analysis, Insights and Forecast, 2019-2031
- 9.1. Market Analysis, Insights and Forecast - by Source
- 9.1.1. Organic
- 9.1.2. Conventional
- 9.2. Market Analysis, Insights and Forecast - by Application
- 9.2.1. Food and Beverage
- 9.2.1.1. Bakery Products
- 9.2.1.2. Soups and Sauces
- 9.2.1.3. Snacks and Cereals
- 9.2.1.4. Meat and Meat Products
- 9.2.1.5. Dairy
- 9.2.1.6. Other Food and Beverage Applications
- 9.2.2. Animal Feed and Pet Food
- 9.2.3. Personal Care and Cosmetics
- 9.2.1. Food and Beverage
- 9.1. Market Analysis, Insights and Forecast - by Source
- 10. Middle East and Africa Pea Starch Industry Analysis, Insights and Forecast, 2019-2031
- 10.1. Market Analysis, Insights and Forecast - by Source
- 10.1.1. Organic
- 10.1.2. Conventional
- 10.2. Market Analysis, Insights and Forecast - by Application
- 10.2.1. Food and Beverage
- 10.2.1.1. Bakery Products
- 10.2.1.2. Soups and Sauces
- 10.2.1.3. Snacks and Cereals
- 10.2.1.4. Meat and Meat Products
- 10.2.1.5. Dairy
- 10.2.1.6. Other Food and Beverage Applications
- 10.2.2. Animal Feed and Pet Food
- 10.2.3. Personal Care and Cosmetics
- 10.2.1. Food and Beverage
- 10.1. Market Analysis, Insights and Forecast - by Source
- 11. North America Pea Starch Industry Analysis, Insights and Forecast, 2019-2031
- 11.1. Market Analysis, Insights and Forecast - By Country/Sub-region
- 11.1.1 United States
- 11.1.2 Canada
- 11.1.3 Mexico
- 11.1.4 Rest of North America
- 12. Europe Pea Starch Industry Analysis, Insights and Forecast, 2019-2031
- 12.1. Market Analysis, Insights and Forecast - By Country/Sub-region
- 12.1.1 United Kingdom
- 12.1.2 Germany
- 12.1.3 Spain
- 12.1.4 France
- 12.1.5 Italy
- 12.1.6 Russia
- 12.1.7 Rest of Europe
- 13. Asia Pacific Pea Starch Industry Analysis, Insights and Forecast, 2019-2031
- 13.1. Market Analysis, Insights and Forecast - By Country/Sub-region
- 13.1.1 China
- 13.1.2 Japan
- 13.1.3 India
- 13.1.4 Australia
- 13.1.5 Rest of Asia Pacific
- 14. South America Pea Starch Industry Analysis, Insights and Forecast, 2019-2031
- 14.1. Market Analysis, Insights and Forecast - By Country/Sub-region
- 14.1.1 Brazil
- 14.1.2 Argentina
- 14.1.3 Rest of South America
- 15. Middle East and Africa Pea Starch Industry Analysis, Insights and Forecast, 2019-2031
- 15.1. Market Analysis, Insights and Forecast - By Country/Sub-region
- 15.1.1 Saudi Arabia
- 15.1.2 South Africa
- 15.1.3 Rest of Middle East and Africa
- 16. Competitive Analysis
- 16.1. Global Market Share Analysis 2024
- 16.2. Company Profiles
- 16.2.1 Vestkorn Milling AS
- 16.2.1.1. Overview
- 16.2.1.2. Products
- 16.2.1.3. SWOT Analysis
- 16.2.1.4. Recent Developments
- 16.2.1.5. Financials (Based on Availability)
- 16.2.2 Groupe Emsland
- 16.2.2.1. Overview
- 16.2.2.2. Products
- 16.2.2.3. SWOT Analysis
- 16.2.2.4. Recent Developments
- 16.2.2.5. Financials (Based on Availability)
- 16.2.3 The Scoular Company
- 16.2.3.1. Overview
- 16.2.3.2. Products
- 16.2.3.3. SWOT Analysis
- 16.2.3.4. Recent Developments
- 16.2.3.5. Financials (Based on Availability)
- 16.2.4 Axiom Foods Inc
- 16.2.4.1. Overview
- 16.2.4.2. Products
- 16.2.4.3. SWOT Analysis
- 16.2.4.4. Recent Developments
- 16.2.4.5. Financials (Based on Availability)
- 16.2.5 Meelunie BV
- 16.2.5.1. Overview
- 16.2.5.2. Products
- 16.2.5.3. SWOT Analysis
- 16.2.5.4. Recent Developments
- 16.2.5.5. Financials (Based on Availability)
- 16.2.6 Ingredion Incorporated
- 16.2.6.1. Overview
- 16.2.6.2. Products
- 16.2.6.3. SWOT Analysis
- 16.2.6.4. Recent Developments
- 16.2.6.5. Financials (Based on Availability)
- 16.2.7 Cosucra- Groupe Warcoing
- 16.2.7.1. Overview
- 16.2.7.2. Products
- 16.2.7.3. SWOT Analysis
- 16.2.7.4. Recent Developments
- 16.2.7.5. Financials (Based on Availability)
- 16.2.8 Roquette Freres
- 16.2.8.1. Overview
- 16.2.8.2. Products
- 16.2.8.3. SWOT Analysis
- 16.2.8.4. Recent Developments
- 16.2.8.5. Financials (Based on Availability)
- 16.2.9 Puris Foods*List Not Exhaustive
- 16.2.9.1. Overview
- 16.2.9.2. Products
- 16.2.9.3. SWOT Analysis
- 16.2.9.4. Recent Developments
- 16.2.9.5. Financials (Based on Availability)
- 16.2.10 Yantai Shuangta Food Co Ltd
- 16.2.10.1. Overview
- 16.2.10.2. Products
- 16.2.10.3. SWOT Analysis
- 16.2.10.4. Recent Developments
- 16.2.10.5. Financials (Based on Availability)
- 16.2.1 Vestkorn Milling AS
List of Figures
- Figure 1: Global Pea Starch Industry Revenue Breakdown (Million, %) by Region 2024 & 2032
- Figure 2: North America Pea Starch Industry Revenue (Million), by Country 2024 & 2032
- Figure 3: North America Pea Starch Industry Revenue Share (%), by Country 2024 & 2032
- Figure 4: Europe Pea Starch Industry Revenue (Million), by Country 2024 & 2032
- Figure 5: Europe Pea Starch Industry Revenue Share (%), by Country 2024 & 2032
- Figure 6: Asia Pacific Pea Starch Industry Revenue (Million), by Country 2024 & 2032
- Figure 7: Asia Pacific Pea Starch Industry Revenue Share (%), by Country 2024 & 2032
- Figure 8: South America Pea Starch Industry Revenue (Million), by Country 2024 & 2032
- Figure 9: South America Pea Starch Industry Revenue Share (%), by Country 2024 & 2032
- Figure 10: Middle East and Africa Pea Starch Industry Revenue (Million), by Country 2024 & 2032
- Figure 11: Middle East and Africa Pea Starch Industry Revenue Share (%), by Country 2024 & 2032
- Figure 12: North America Pea Starch Industry Revenue (Million), by Source 2024 & 2032
- Figure 13: North America Pea Starch Industry Revenue Share (%), by Source 2024 & 2032
- Figure 14: North America Pea Starch Industry Revenue (Million), by Application 2024 & 2032
- Figure 15: North America Pea Starch Industry Revenue Share (%), by Application 2024 & 2032
- Figure 16: North America Pea Starch Industry Revenue (Million), by Country 2024 & 2032
- Figure 17: North America Pea Starch Industry Revenue Share (%), by Country 2024 & 2032
- Figure 18: Europe Pea Starch Industry Revenue (Million), by Source 2024 & 2032
- Figure 19: Europe Pea Starch Industry Revenue Share (%), by Source 2024 & 2032
- Figure 20: Europe Pea Starch Industry Revenue (Million), by Application 2024 & 2032
- Figure 21: Europe Pea Starch Industry Revenue Share (%), by Application 2024 & 2032
- Figure 22: Europe Pea Starch Industry Revenue (Million), by Country 2024 & 2032
- Figure 23: Europe Pea Starch Industry Revenue Share (%), by Country 2024 & 2032
- Figure 24: Asia Pacific Pea Starch Industry Revenue (Million), by Source 2024 & 2032
- Figure 25: Asia Pacific Pea Starch Industry Revenue Share (%), by Source 2024 & 2032
- Figure 26: Asia Pacific Pea Starch Industry Revenue (Million), by Application 2024 & 2032
- Figure 27: Asia Pacific Pea Starch Industry Revenue Share (%), by Application 2024 & 2032
- Figure 28: Asia Pacific Pea Starch Industry Revenue (Million), by Country 2024 & 2032
- Figure 29: Asia Pacific Pea Starch Industry Revenue Share (%), by Country 2024 & 2032
- Figure 30: South America Pea Starch Industry Revenue (Million), by Source 2024 & 2032
- Figure 31: South America Pea Starch Industry Revenue Share (%), by Source 2024 & 2032
- Figure 32: South America Pea Starch Industry Revenue (Million), by Application 2024 & 2032
- Figure 33: South America Pea Starch Industry Revenue Share (%), by Application 2024 & 2032
- Figure 34: South America Pea Starch Industry Revenue (Million), by Country 2024 & 2032
- Figure 35: South America Pea Starch Industry Revenue Share (%), by Country 2024 & 2032
- Figure 36: Middle East and Africa Pea Starch Industry Revenue (Million), by Source 2024 & 2032
- Figure 37: Middle East and Africa Pea Starch Industry Revenue Share (%), by Source 2024 & 2032
- Figure 38: Middle East and Africa Pea Starch Industry Revenue (Million), by Application 2024 & 2032
- Figure 39: Middle East and Africa Pea Starch Industry Revenue Share (%), by Application 2024 & 2032
- Figure 40: Middle East and Africa Pea Starch Industry Revenue (Million), by Country 2024 & 2032
- Figure 41: Middle East and Africa Pea Starch Industry Revenue Share (%), by Country 2024 & 2032
List of Tables
- Table 1: Global Pea Starch Industry Revenue Million Forecast, by Region 2019 & 2032
- Table 2: Global Pea Starch Industry Revenue Million Forecast, by Source 2019 & 2032
- Table 3: Global Pea Starch Industry Revenue Million Forecast, by Application 2019 & 2032
- Table 4: Global Pea Starch Industry Revenue Million Forecast, by Region 2019 & 2032
- Table 5: Global Pea Starch Industry Revenue Million Forecast, by Country 2019 & 2032
- Table 6: United States Pea Starch Industry Revenue (Million) Forecast, by Application 2019 & 2032
- Table 7: Canada Pea Starch Industry Revenue (Million) Forecast, by Application 2019 & 2032
- Table 8: Mexico Pea Starch Industry Revenue (Million) Forecast, by Application 2019 & 2032
- Table 9: Rest of North America Pea Starch Industry Revenue (Million) Forecast, by Application 2019 & 2032
- Table 10: Global Pea Starch Industry Revenue Million Forecast, by Country 2019 & 2032
- Table 11: United Kingdom Pea Starch Industry Revenue (Million) Forecast, by Application 2019 & 2032
- Table 12: Germany Pea Starch Industry Revenue (Million) Forecast, by Application 2019 & 2032
- Table 13: Spain Pea Starch Industry Revenue (Million) Forecast, by Application 2019 & 2032
- Table 14: France Pea Starch Industry Revenue (Million) Forecast, by Application 2019 & 2032
- Table 15: Italy Pea Starch Industry Revenue (Million) Forecast, by Application 2019 & 2032
- Table 16: Russia Pea Starch Industry Revenue (Million) Forecast, by Application 2019 & 2032
- Table 17: Rest of Europe Pea Starch Industry Revenue (Million) Forecast, by Application 2019 & 2032
- Table 18: Global Pea Starch Industry Revenue Million Forecast, by Country 2019 & 2032
- Table 19: China Pea Starch Industry Revenue (Million) Forecast, by Application 2019 & 2032
- Table 20: Japan Pea Starch Industry Revenue (Million) Forecast, by Application 2019 & 2032
- Table 21: India Pea Starch Industry Revenue (Million) Forecast, by Application 2019 & 2032
- Table 22: Australia Pea Starch Industry Revenue (Million) Forecast, by Application 2019 & 2032
- Table 23: Rest of Asia Pacific Pea Starch Industry Revenue (Million) Forecast, by Application 2019 & 2032
- Table 24: Global Pea Starch Industry Revenue Million Forecast, by Country 2019 & 2032
- Table 25: Brazil Pea Starch Industry Revenue (Million) Forecast, by Application 2019 & 2032
- Table 26: Argentina Pea Starch Industry Revenue (Million) Forecast, by Application 2019 & 2032
- Table 27: Rest of South America Pea Starch Industry Revenue (Million) Forecast, by Application 2019 & 2032
- Table 28: Global Pea Starch Industry Revenue Million Forecast, by Country 2019 & 2032
- Table 29: Saudi Arabia Pea Starch Industry Revenue (Million) Forecast, by Application 2019 & 2032
- Table 30: South Africa Pea Starch Industry Revenue (Million) Forecast, by Application 2019 & 2032
- Table 31: Rest of Middle East and Africa Pea Starch Industry Revenue (Million) Forecast, by Application 2019 & 2032
- Table 32: Global Pea Starch Industry Revenue Million Forecast, by Source 2019 & 2032
- Table 33: Global Pea Starch Industry Revenue Million Forecast, by Application 2019 & 2032
- Table 34: Global Pea Starch Industry Revenue Million Forecast, by Country 2019 & 2032
- Table 35: United States Pea Starch Industry Revenue (Million) Forecast, by Application 2019 & 2032
- Table 36: Canada Pea Starch Industry Revenue (Million) Forecast, by Application 2019 & 2032
- Table 37: Mexico Pea Starch Industry Revenue (Million) Forecast, by Application 2019 & 2032
- Table 38: Rest of North America Pea Starch Industry Revenue (Million) Forecast, by Application 2019 & 2032
- Table 39: Global Pea Starch Industry Revenue Million Forecast, by Source 2019 & 2032
- Table 40: Global Pea Starch Industry Revenue Million Forecast, by Application 2019 & 2032
- Table 41: Global Pea Starch Industry Revenue Million Forecast, by Country 2019 & 2032
- Table 42: United Kingdom Pea Starch Industry Revenue (Million) Forecast, by Application 2019 & 2032
- Table 43: Germany Pea Starch Industry Revenue (Million) Forecast, by Application 2019 & 2032
- Table 44: Spain Pea Starch Industry Revenue (Million) Forecast, by Application 2019 & 2032
- Table 45: France Pea Starch Industry Revenue (Million) Forecast, by Application 2019 & 2032
- Table 46: Italy Pea Starch Industry Revenue (Million) Forecast, by Application 2019 & 2032
- Table 47: Russia Pea Starch Industry Revenue (Million) Forecast, by Application 2019 & 2032
- Table 48: Rest of Europe Pea Starch Industry Revenue (Million) Forecast, by Application 2019 & 2032
- Table 49: Global Pea Starch Industry Revenue Million Forecast, by Source 2019 & 2032
- Table 50: Global Pea Starch Industry Revenue Million Forecast, by Application 2019 & 2032
- Table 51: Global Pea Starch Industry Revenue Million Forecast, by Country 2019 & 2032
- Table 52: China Pea Starch Industry Revenue (Million) Forecast, by Application 2019 & 2032
- Table 53: Japan Pea Starch Industry Revenue (Million) Forecast, by Application 2019 & 2032
- Table 54: India Pea Starch Industry Revenue (Million) Forecast, by Application 2019 & 2032
- Table 55: Australia Pea Starch Industry Revenue (Million) Forecast, by Application 2019 & 2032
- Table 56: Rest of Asia Pacific Pea Starch Industry Revenue (Million) Forecast, by Application 2019 & 2032
- Table 57: Global Pea Starch Industry Revenue Million Forecast, by Source 2019 & 2032
- Table 58: Global Pea Starch Industry Revenue Million Forecast, by Application 2019 & 2032
- Table 59: Global Pea Starch Industry Revenue Million Forecast, by Country 2019 & 2032
- Table 60: Brazil Pea Starch Industry Revenue (Million) Forecast, by Application 2019 & 2032
- Table 61: Argentina Pea Starch Industry Revenue (Million) Forecast, by Application 2019 & 2032
- Table 62: Rest of South America Pea Starch Industry Revenue (Million) Forecast, by Application 2019 & 2032
- Table 63: Global Pea Starch Industry Revenue Million Forecast, by Source 2019 & 2032
- Table 64: Global Pea Starch Industry Revenue Million Forecast, by Application 2019 & 2032
- Table 65: Global Pea Starch Industry Revenue Million Forecast, by Country 2019 & 2032
- Table 66: Saudi Arabia Pea Starch Industry Revenue (Million) Forecast, by Application 2019 & 2032
- Table 67: South Africa Pea Starch Industry Revenue (Million) Forecast, by Application 2019 & 2032
- Table 68: Rest of Middle East and Africa Pea Starch Industry Revenue (Million) Forecast, by Application 2019 & 2032
Frequently Asked Questions
1. What is the projected Compound Annual Growth Rate (CAGR) of the Pea Starch Industry?
The projected CAGR is approximately 8.16%.
2. Which companies are prominent players in the Pea Starch Industry?
Key companies in the market include Vestkorn Milling AS, Groupe Emsland, The Scoular Company, Axiom Foods Inc, Meelunie BV, Ingredion Incorporated, Cosucra- Groupe Warcoing, Roquette Freres, Puris Foods*List Not Exhaustive, Yantai Shuangta Food Co Ltd.
3. What are the main segments of the Pea Starch Industry?
The market segments include Source, Application.
4. Can you provide details about the market size?
The market size is estimated to be USD XX Million as of 2022.
5. What are some drivers contributing to market growth?
Growing Awareness About Insect & Other Alternative Proteins; Increasing Applications Surge Demand for Insect Protein.
6. What are the notable trends driving market growth?
Consumer Preference for Free-from Food is Driving the Pea Starch Demand.
7. Are there any restraints impacting market growth?
Augmenting Market Penetration of Other Proteins.
8. Can you provide examples of recent developments in the market?
In October 2022, Roquette Freres, a plant-based ingredients company, launched a new line of organic pea ingredients, i.e., pea starch and organic pea protein. The products are available in North America, Mexico, and Europe.
9. What pricing options are available for accessing the report?
Pricing options include single-user, multi-user, and enterprise licenses priced at USD 4750, USD 5250, and USD 8750 respectively.
10. Is the market size provided in terms of value or volume?
The market size is provided in terms of value, measured in Million.
11. Are there any specific market keywords associated with the report?
Yes, the market keyword associated with the report is "Pea Starch Industry," which aids in identifying and referencing the specific market segment covered.
12. How do I determine which pricing option suits my needs best?
The pricing options vary based on user requirements and access needs. Individual users may opt for single-user licenses, while businesses requiring broader access may choose multi-user or enterprise licenses for cost-effective access to the report.
13. Are there any additional resources or data provided in the Pea Starch Industry report?
While the report offers comprehensive insights, it's advisable to review the specific contents or supplementary materials provided to ascertain if additional resources or data are available.
14. How can I stay updated on further developments or reports in the Pea Starch Industry?
To stay informed about further developments, trends, and reports in the Pea Starch Industry, consider subscribing to industry newsletters, following relevant companies and organizations, or regularly checking reputable industry news sources and publications.
Methodology
Step 1 - Identification of Relevant Samples Size from Population Database


Step 2 - Approaches for Defining Global Market Size (Value, Volume* & Price*)

Note*: In applicable scenarios
Step 3 - Data Sources
Primary Research
- Web Analytics
- Survey Reports
- Research Institute
- Latest Research Reports
- Opinion Leaders
Secondary Research
- Annual Reports
- White Paper
- Latest Press Release
- Industry Association
- Paid Database
- Investor Presentations

Step 4 - Data Triangulation
Involves using different sources of information in order to increase the validity of a study
These sources are likely to be stakeholders in a program - participants, other researchers, program staff, other community members, and so on.
Then we put all data in single framework & apply various statistical tools to find out the dynamic on the market.
During the analysis stage, feedback from the stakeholder groups would be compared to determine areas of agreement as well as areas of divergence


