
Key Insights
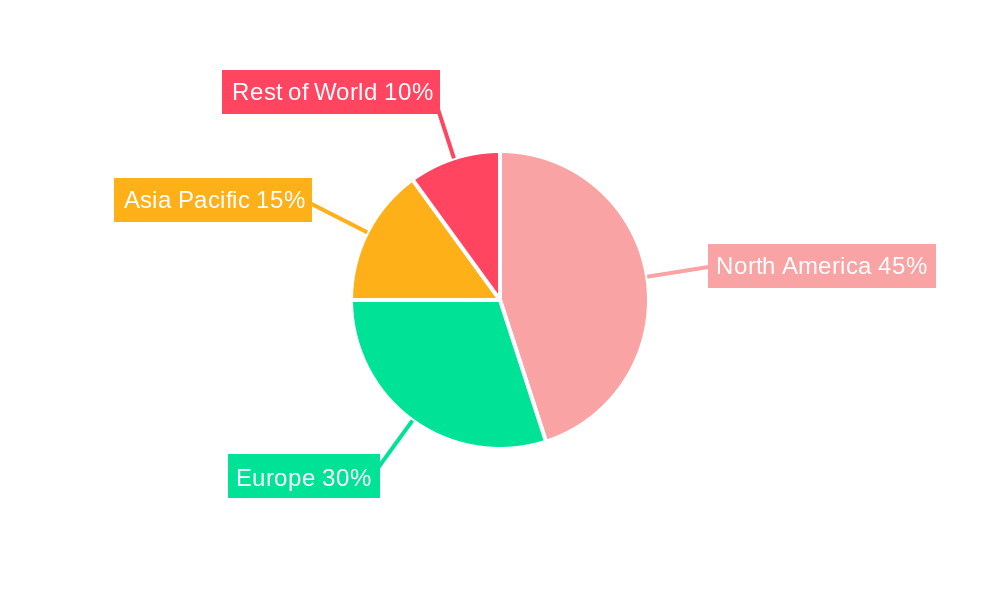
The pediatric neuroblastoma treatment market, while representing a smaller segment of the overall oncology landscape, exhibits significant growth potential driven by rising incidence rates, advancements in targeted therapies, and increased investment in research and development. The market's Compound Annual Growth Rate (CAGR) of 6.30% from 2019-2033 suggests a steady expansion, although fluctuations are likely due to the complexities of treating this aggressive childhood cancer. Key drivers include the ongoing development and adoption of innovative treatment modalities like immunotherapy and targeted therapies, offering improved efficacy and reduced toxicity compared to traditional chemotherapy. The segmenting of the market by treatment type (chemotherapy, immunotherapy, other) and distribution channel (hospital and retail pharmacies) provides valuable insights into market dynamics. Immunotherapy, with its potential for long-term remission, is expected to witness robust growth, while the "other treatments" category likely encompasses emerging therapies such as antibody-drug conjugates and oncolytic viruses, further fueling market expansion. Geographic variations exist, with North America and Europe currently dominating the market due to higher healthcare expenditure and advanced healthcare infrastructure. However, the Asia-Pacific region is poised for significant growth, driven by increasing awareness, rising disposable incomes, and expanding healthcare systems. Market restraints include the high cost of novel therapies, limited access to advanced treatments in developing countries, and the inherent challenges in treating highly heterogeneous neuroblastoma subtypes.
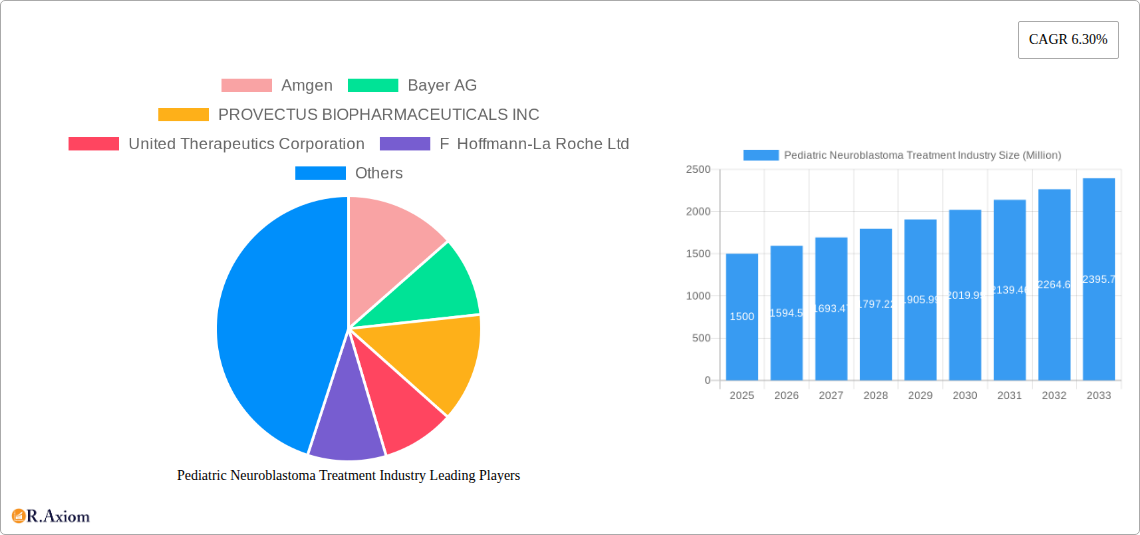
The competitive landscape is shaped by a mix of large pharmaceutical companies and specialized biotech firms, reflecting the complex nature of neuroblastoma treatment and the need for innovative solutions. Leading players such as Amgen, Bayer AG, and Pfizer Inc. leverage their established infrastructure and resources to develop and commercialize advanced therapies. Smaller, specialized companies like Y-mAbs Therapeutics Inc. and MacroGenics Inc. focus on targeted therapies and innovative treatment approaches, contributing significantly to the market's dynamism. The forecast period (2025-2033) will likely see continued innovation, focusing on personalized medicine approaches tailored to specific neuroblastoma subtypes, enhancing treatment efficacy and improving patient outcomes. Future market growth will hinge on factors such as the success of ongoing clinical trials, regulatory approvals of new therapies, and the continued expansion of access to advanced treatments globally.
Pediatric Neuroblastoma Treatment Industry: A Comprehensive Market Report (2019-2033)
This detailed report provides a comprehensive analysis of the pediatric neuroblastoma treatment industry, covering market size, growth drivers, competitive landscape, and future outlook. The study period spans from 2019 to 2033, with 2025 serving as both the base and estimated year. The report offers actionable insights for industry stakeholders, including pharmaceutical companies, investors, and healthcare professionals. The global market value is projected to reach xx Million by 2033.
Pediatric Neuroblastoma Treatment Industry Market Concentration & Innovation
This section analyzes the market concentration, innovation landscape, regulatory environment, and competitive dynamics within the pediatric neuroblastoma treatment market. The industry exhibits a moderately concentrated structure, with a few key players holding significant market share. Amgen, Bayer AG, and Pfizer Inc. are among the leading companies, collectively accounting for an estimated xx% of the global market share in 2025. However, the market is witnessing increased participation from smaller biotech firms focusing on novel therapies.
Innovation Drivers:
- Significant R&D investments in targeted therapies and immunotherapies.
- Growing adoption of advanced technologies like genomics and proteomics for personalized medicine.
- Increased focus on developing less toxic and more effective treatments to minimize long-term side effects in children.
Regulatory Landscape:
- Stringent regulatory approvals for pediatric cancer drugs, leading to longer development timelines and higher costs.
- Incentive programs by regulatory bodies to encourage the development of treatments for rare pediatric cancers.
- Fast track designations, such as the one granted to alrizomadlin in 2022, accelerate the approval process for promising new therapies.
Product Substitutes and End-User Trends:
- Limited availability of effective substitutes for existing treatment modalities.
- Growing demand for personalized and targeted therapies based on the child's specific genetic profile.
- Increased focus on improving patient quality of life and reducing treatment-related morbidity.
M&A Activities: The pediatric neuroblastoma treatment industry has witnessed a moderate level of M&A activity in recent years, with deal values totaling approximately xx Million between 2019 and 2024. These activities reflect strategic efforts by large pharmaceutical companies to expand their portfolios and gain access to innovative technologies.
Pediatric Neuroblastoma Treatment Industry Industry Trends & Insights
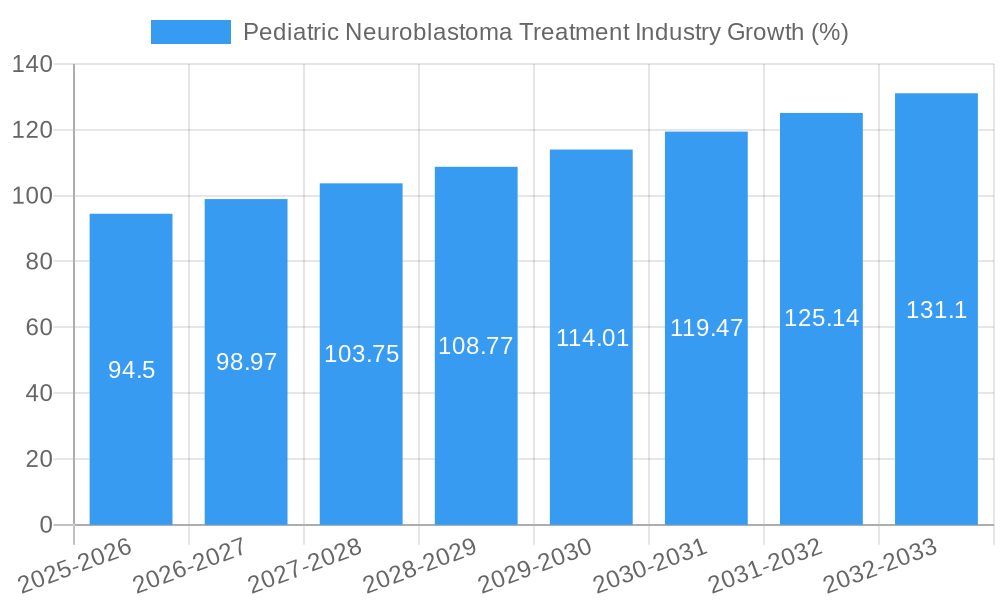
The pediatric neuroblastoma treatment market is experiencing robust growth, driven by increasing prevalence of the disease, rising awareness among healthcare professionals and patients, and advancements in treatment modalities. The Compound Annual Growth Rate (CAGR) is estimated to be xx% during the forecast period (2025-2033). Market penetration of novel therapies, such as immunotherapy and targeted therapies, is steadily increasing. Technological disruptions, primarily in the form of advanced diagnostics and personalized medicine approaches, are transforming the treatment landscape. Consumer preferences are shifting towards less toxic therapies with improved efficacy and reduced long-term side effects. Competitive dynamics are characterized by intense R&D efforts, strategic partnerships, and increasing market entry by smaller biotech companies. These factors, coupled with favorable regulatory environments and supportive government policies, are propelling the market's growth trajectory.
Dominant Markets & Segments in Pediatric Neuroblastoma Treatment Industry
By Treatment Type:
- Chemotherapy: Remains a cornerstone of neuroblastoma treatment, although the focus is shifting towards less toxic regimens and combination therapies.
- Immunotherapy: This segment is experiencing rapid growth driven by the development of novel antibody-based therapies and immune checkpoint inhibitors.
- Other Treatment Types: This category includes surgery, radiation therapy, stem cell transplantation, and targeted therapies.
By Distribution Channel:
- Hospital Pharmacies: Dominates the distribution channel, due to the complexity of treatment and the need for specialized healthcare infrastructure.
- Retail Pharmacies: Plays a relatively minor role, largely restricted to the distribution of supportive medications.
Regional Dominance:
North America currently holds the largest market share, driven by high healthcare expenditure, advanced healthcare infrastructure, and strong regulatory support. However, Asia-Pacific is expected to show robust growth due to increasing healthcare spending and rising incidence of the disease.
Key Drivers:
- Technological advancements leading to new therapies.
- Government initiatives and funding for research and development.
- Increasing awareness and improved diagnosis rates.
- Growing investments in healthcare infrastructure.
Pediatric Neuroblastoma Treatment Industry Product Developments
Recent advancements have focused on developing targeted therapies with reduced toxicity and improved efficacy. Immunotherapies, particularly antibody-drug conjugates (ADCs) and CAR T-cell therapies, represent significant breakthroughs, offering promising alternatives to traditional chemotherapy. These new products, coupled with improved diagnostic tools for early disease detection, are improving patient outcomes and expanding treatment options. The industry is witnessing a strong move toward personalized medicine, adapting treatment regimens based on individual genetic profiles. This approach aims to maximize efficacy while minimizing adverse effects.
Report Scope & Segmentation Analysis
This report segments the pediatric neuroblastoma treatment market based on treatment type (chemotherapy, immunotherapy, other treatment types) and distribution channel (hospital pharmacies, retail pharmacies). Growth projections for each segment are based on market size estimations and anticipated advancements in therapeutic options. The competitive dynamics are assessed considering the established players and emerging competitors within each segment. Market sizes for each segment are estimated using xx Million for 2025 and xx Million for 2033 with the CAGR being calculated.
By Treatment Type: Each segment shows unique growth trajectories, reflecting varying levels of innovation and adoption of new technologies. Immunotherapy is showing the highest growth potential due to ongoing clinical trials and new drug approvals.
By Distribution Channel: Hospital pharmacies are projected to maintain their dominance, driven by the complex nature of neuroblastoma treatment and the need for specialized medical personnel.
Key Drivers of Pediatric Neuroblastoma Treatment Industry Growth
Several factors are driving the growth of the pediatric neuroblastoma treatment market:
- Technological advancements: Development of novel therapies, including immunotherapies and targeted therapies, are significantly improving treatment outcomes.
- Economic factors: Increased healthcare spending and government funding for cancer research are fueling market growth.
- Regulatory changes: Favorable regulatory environments and incentive programs promote the development and adoption of new treatment options.
Challenges in the Pediatric Neuroblastoma Treatment Industry Sector
The industry faces several challenges, including:
- High cost of development and manufacturing of new drugs.
- Stringent regulatory approval processes, particularly for new therapies targeted at children.
- Limited treatment options for relapsed or refractory neuroblastoma. This results in a significant unmet medical need with xx Million in potential market value.
Emerging Opportunities in Pediatric Neuroblastoma Treatment Industry
Several emerging opportunities exist in this market, including:
- Development of personalized medicine approaches tailored to the specific genetic profile of each patient.
- Exploration of novel treatment modalities, such as gene therapy and oncolytic viruses.
- Expansion into emerging markets with a growing need for advanced cancer care.
Leading Players in the Pediatric Neuroblastoma Treatment Industry Market
- Amgen
- Bayer AG
- PROVECTUS BIOPHARMACEUTICALS INC
- United Therapeutics Corporation
- F Hoffmann-La Roche Ltd
- Eli Lilly and Company
- APEIRON Biologics AG
- Sartorius AG
- Y-mAbs Therapeutics Inc
- CELLECTAR BIOSCIENCES INC
- MacroGenics Inc
- Baxter International
- Pfizer Inc
Key Developments in Pediatric Neuroblastoma Treatment Industry Industry
- October 2022: Kyushu University initiated a clinical trial evaluating the safety and efficacy of GAIA-102 in refractory/relapse neuroblastoma. This highlights the ongoing efforts to improve treatment options for challenging cases.
- February 2022: The FDA granted Fast Track Designation to alrizomadlin (APG-115) for neuroblastoma, accelerating its development and approval process. This reflects the urgent need for improved therapies for this rare pediatric cancer.
Strategic Outlook for Pediatric Neuroblastoma Treatment Market
The future of the pediatric neuroblastoma treatment market is promising, with substantial growth potential driven by continuous innovation in therapeutic modalities, increasing healthcare spending, and supportive regulatory landscapes. The focus on personalized medicine, coupled with the development of less toxic and more effective therapies, will shape the industry’s trajectory in the coming years. The market is poised for substantial expansion, offering significant opportunities for both established players and emerging companies.
Pediatric Neuroblastoma Treatment Industry Segmentation
-
1. Treatment Type
- 1.1. Chemotherpy
- 1.2. Immunotherapy
- 1.3. Other Treatment Types
-
2. Distribution Channel
- 2.1. Hospital Pharmacies
- 2.2. Retail Pharmacies
Pediatric Neuroblastoma Treatment Industry Segmentation By Geography
-
1. North America
- 1.1. United States
- 1.2. Canada
- 1.3. Mexico
-
2. Europe
- 2.1. Germany
- 2.2. United Kingdom
- 2.3. France
- 2.4. Italy
- 2.5. Spain
- 2.6. Rest of Europe
-
3. Asia Pacific
- 3.1. China
- 3.2. Japan
- 3.3. India
- 3.4. Australia
- 3.5. South Korea
- 3.6. Rest of Asia Pacific
-
4. Middle East and Africa
- 4.1. GCC
- 4.2. South Africa
- 4.3. Rest of Middle East and Africa
-
5. South America
- 5.1. Brazil
- 5.2. Argentina
- 5.3. Rest of South America
Pediatric Neuroblastoma Treatment Industry REPORT HIGHLIGHTS
| Aspects | Details |
|---|---|
| Study Period | 2019-2033 |
| Base Year | 2024 |
| Estimated Year | 2025 |
| Forecast Period | 2025-2033 |
| Historical Period | 2019-2024 |
| Growth Rate | CAGR of 6.30% from 2019-2033 |
| Segmentation |
|
Table of Contents
- 1. Introduction
- 1.1. Research Scope
- 1.2. Market Segmentation
- 1.3. Research Methodology
- 1.4. Definitions and Assumptions
- 2. Executive Summary
- 2.1. Introduction
- 3. Market Dynamics
- 3.1. Introduction
- 3.2. Market Drivers
- 3.2.1. Increasing Burden Of Pediatric Neuroblastoma Coupled With Increasing R&D; Rise in Awareness of Available Treatment For Cancer
- 3.3. Market Restrains
- 3.3.1. High Cost And Side Effects Associated With Cancer Therapy
- 3.4. Market Trends
- 3.4.1. TheChemotherapy Segment is Anticipated to Witness a Growth in the Pediatric Neuroblastoma Treatment Market Over the Forecast Period
- 4. Market Factor Analysis
- 4.1. Porters Five Forces
- 4.2. Supply/Value Chain
- 4.3. PESTEL analysis
- 4.4. Market Entropy
- 4.5. Patent/Trademark Analysis
- 5. Global Pediatric Neuroblastoma Treatment Industry Analysis, Insights and Forecast, 2019-2031
- 5.1. Market Analysis, Insights and Forecast - by Treatment Type
- 5.1.1. Chemotherpy
- 5.1.2. Immunotherapy
- 5.1.3. Other Treatment Types
- 5.2. Market Analysis, Insights and Forecast - by Distribution Channel
- 5.2.1. Hospital Pharmacies
- 5.2.2. Retail Pharmacies
- 5.3. Market Analysis, Insights and Forecast - by Region
- 5.3.1. North America
- 5.3.2. Europe
- 5.3.3. Asia Pacific
- 5.3.4. Middle East and Africa
- 5.3.5. South America
- 5.1. Market Analysis, Insights and Forecast - by Treatment Type
- 6. North America Pediatric Neuroblastoma Treatment Industry Analysis, Insights and Forecast, 2019-2031
- 6.1. Market Analysis, Insights and Forecast - by Treatment Type
- 6.1.1. Chemotherpy
- 6.1.2. Immunotherapy
- 6.1.3. Other Treatment Types
- 6.2. Market Analysis, Insights and Forecast - by Distribution Channel
- 6.2.1. Hospital Pharmacies
- 6.2.2. Retail Pharmacies
- 6.1. Market Analysis, Insights and Forecast - by Treatment Type
- 7. Europe Pediatric Neuroblastoma Treatment Industry Analysis, Insights and Forecast, 2019-2031
- 7.1. Market Analysis, Insights and Forecast - by Treatment Type
- 7.1.1. Chemotherpy
- 7.1.2. Immunotherapy
- 7.1.3. Other Treatment Types
- 7.2. Market Analysis, Insights and Forecast - by Distribution Channel
- 7.2.1. Hospital Pharmacies
- 7.2.2. Retail Pharmacies
- 7.1. Market Analysis, Insights and Forecast - by Treatment Type
- 8. Asia Pacific Pediatric Neuroblastoma Treatment Industry Analysis, Insights and Forecast, 2019-2031
- 8.1. Market Analysis, Insights and Forecast - by Treatment Type
- 8.1.1. Chemotherpy
- 8.1.2. Immunotherapy
- 8.1.3. Other Treatment Types
- 8.2. Market Analysis, Insights and Forecast - by Distribution Channel
- 8.2.1. Hospital Pharmacies
- 8.2.2. Retail Pharmacies
- 8.1. Market Analysis, Insights and Forecast - by Treatment Type
- 9. Middle East and Africa Pediatric Neuroblastoma Treatment Industry Analysis, Insights and Forecast, 2019-2031
- 9.1. Market Analysis, Insights and Forecast - by Treatment Type
- 9.1.1. Chemotherpy
- 9.1.2. Immunotherapy
- 9.1.3. Other Treatment Types
- 9.2. Market Analysis, Insights and Forecast - by Distribution Channel
- 9.2.1. Hospital Pharmacies
- 9.2.2. Retail Pharmacies
- 9.1. Market Analysis, Insights and Forecast - by Treatment Type
- 10. South America Pediatric Neuroblastoma Treatment Industry Analysis, Insights and Forecast, 2019-2031
- 10.1. Market Analysis, Insights and Forecast - by Treatment Type
- 10.1.1. Chemotherpy
- 10.1.2. Immunotherapy
- 10.1.3. Other Treatment Types
- 10.2. Market Analysis, Insights and Forecast - by Distribution Channel
- 10.2.1. Hospital Pharmacies
- 10.2.2. Retail Pharmacies
- 10.1. Market Analysis, Insights and Forecast - by Treatment Type
- 11. North America Pediatric Neuroblastoma Treatment Industry Analysis, Insights and Forecast, 2019-2031
- 11.1. Market Analysis, Insights and Forecast - By Country/Sub-region
- 11.1.1 United States
- 11.1.2 Canada
- 11.1.3 Mexico
- 12. Europe Pediatric Neuroblastoma Treatment Industry Analysis, Insights and Forecast, 2019-2031
- 12.1. Market Analysis, Insights and Forecast - By Country/Sub-region
- 12.1.1 Germany
- 12.1.2 United Kingdom
- 12.1.3 France
- 12.1.4 Italy
- 12.1.5 Spain
- 12.1.6 Rest of Europe
- 13. Asia Pacific Pediatric Neuroblastoma Treatment Industry Analysis, Insights and Forecast, 2019-2031
- 13.1. Market Analysis, Insights and Forecast - By Country/Sub-region
- 13.1.1 China
- 13.1.2 Japan
- 13.1.3 India
- 13.1.4 Australia
- 13.1.5 South Korea
- 13.1.6 Rest of Asia Pacific
- 14. Middle East and Africa Pediatric Neuroblastoma Treatment Industry Analysis, Insights and Forecast, 2019-2031
- 14.1. Market Analysis, Insights and Forecast - By Country/Sub-region
- 14.1.1 GCC
- 14.1.2 South Africa
- 14.1.3 Rest of Middle East and Africa
- 15. South America Pediatric Neuroblastoma Treatment Industry Analysis, Insights and Forecast, 2019-2031
- 15.1. Market Analysis, Insights and Forecast - By Country/Sub-region
- 15.1.1 Brazil
- 15.1.2 Argentina
- 15.1.3 Rest of South America
- 16. Competitive Analysis
- 16.1. Global Market Share Analysis 2024
- 16.2. Company Profiles
- 16.2.1 Amgen
- 16.2.1.1. Overview
- 16.2.1.2. Products
- 16.2.1.3. SWOT Analysis
- 16.2.1.4. Recent Developments
- 16.2.1.5. Financials (Based on Availability)
- 16.2.2 Bayer AG
- 16.2.2.1. Overview
- 16.2.2.2. Products
- 16.2.2.3. SWOT Analysis
- 16.2.2.4. Recent Developments
- 16.2.2.5. Financials (Based on Availability)
- 16.2.3 PROVECTUS BIOPHARMACEUTICALS INC
- 16.2.3.1. Overview
- 16.2.3.2. Products
- 16.2.3.3. SWOT Analysis
- 16.2.3.4. Recent Developments
- 16.2.3.5. Financials (Based on Availability)
- 16.2.4 United Therapeutics Corporation
- 16.2.4.1. Overview
- 16.2.4.2. Products
- 16.2.4.3. SWOT Analysis
- 16.2.4.4. Recent Developments
- 16.2.4.5. Financials (Based on Availability)
- 16.2.5 F Hoffmann-La Roche Ltd
- 16.2.5.1. Overview
- 16.2.5.2. Products
- 16.2.5.3. SWOT Analysis
- 16.2.5.4. Recent Developments
- 16.2.5.5. Financials (Based on Availability)
- 16.2.6 Eli Lilly and Company
- 16.2.6.1. Overview
- 16.2.6.2. Products
- 16.2.6.3. SWOT Analysis
- 16.2.6.4. Recent Developments
- 16.2.6.5. Financials (Based on Availability)
- 16.2.7 APEIRON Biologics AG
- 16.2.7.1. Overview
- 16.2.7.2. Products
- 16.2.7.3. SWOT Analysis
- 16.2.7.4. Recent Developments
- 16.2.7.5. Financials (Based on Availability)
- 16.2.8 Sartorius AG
- 16.2.8.1. Overview
- 16.2.8.2. Products
- 16.2.8.3. SWOT Analysis
- 16.2.8.4. Recent Developments
- 16.2.8.5. Financials (Based on Availability)
- 16.2.9 Y-mAbs Therapeutics Inc
- 16.2.9.1. Overview
- 16.2.9.2. Products
- 16.2.9.3. SWOT Analysis
- 16.2.9.4. Recent Developments
- 16.2.9.5. Financials (Based on Availability)
- 16.2.10 CELLECTAR BIOSCIENCES INC
- 16.2.10.1. Overview
- 16.2.10.2. Products
- 16.2.10.3. SWOT Analysis
- 16.2.10.4. Recent Developments
- 16.2.10.5. Financials (Based on Availability)
- 16.2.11 MacroGenics Inc
- 16.2.11.1. Overview
- 16.2.11.2. Products
- 16.2.11.3. SWOT Analysis
- 16.2.11.4. Recent Developments
- 16.2.11.5. Financials (Based on Availability)
- 16.2.12 Baxter International
- 16.2.12.1. Overview
- 16.2.12.2. Products
- 16.2.12.3. SWOT Analysis
- 16.2.12.4. Recent Developments
- 16.2.12.5. Financials (Based on Availability)
- 16.2.13 Pfizer Inc
- 16.2.13.1. Overview
- 16.2.13.2. Products
- 16.2.13.3. SWOT Analysis
- 16.2.13.4. Recent Developments
- 16.2.13.5. Financials (Based on Availability)
- 16.2.1 Amgen
List of Figures
- Figure 1: Global Pediatric Neuroblastoma Treatment Industry Revenue Breakdown (Million, %) by Region 2024 & 2032
- Figure 2: Global Pediatric Neuroblastoma Treatment Industry Volume Breakdown (K Unit, %) by Region 2024 & 2032
- Figure 3: North America Pediatric Neuroblastoma Treatment Industry Revenue (Million), by Country 2024 & 2032
- Figure 4: North America Pediatric Neuroblastoma Treatment Industry Volume (K Unit), by Country 2024 & 2032
- Figure 5: North America Pediatric Neuroblastoma Treatment Industry Revenue Share (%), by Country 2024 & 2032
- Figure 6: North America Pediatric Neuroblastoma Treatment Industry Volume Share (%), by Country 2024 & 2032
- Figure 7: Europe Pediatric Neuroblastoma Treatment Industry Revenue (Million), by Country 2024 & 2032
- Figure 8: Europe Pediatric Neuroblastoma Treatment Industry Volume (K Unit), by Country 2024 & 2032
- Figure 9: Europe Pediatric Neuroblastoma Treatment Industry Revenue Share (%), by Country 2024 & 2032
- Figure 10: Europe Pediatric Neuroblastoma Treatment Industry Volume Share (%), by Country 2024 & 2032
- Figure 11: Asia Pacific Pediatric Neuroblastoma Treatment Industry Revenue (Million), by Country 2024 & 2032
- Figure 12: Asia Pacific Pediatric Neuroblastoma Treatment Industry Volume (K Unit), by Country 2024 & 2032
- Figure 13: Asia Pacific Pediatric Neuroblastoma Treatment Industry Revenue Share (%), by Country 2024 & 2032
- Figure 14: Asia Pacific Pediatric Neuroblastoma Treatment Industry Volume Share (%), by Country 2024 & 2032
- Figure 15: Middle East and Africa Pediatric Neuroblastoma Treatment Industry Revenue (Million), by Country 2024 & 2032
- Figure 16: Middle East and Africa Pediatric Neuroblastoma Treatment Industry Volume (K Unit), by Country 2024 & 2032
- Figure 17: Middle East and Africa Pediatric Neuroblastoma Treatment Industry Revenue Share (%), by Country 2024 & 2032
- Figure 18: Middle East and Africa Pediatric Neuroblastoma Treatment Industry Volume Share (%), by Country 2024 & 2032
- Figure 19: South America Pediatric Neuroblastoma Treatment Industry Revenue (Million), by Country 2024 & 2032
- Figure 20: South America Pediatric Neuroblastoma Treatment Industry Volume (K Unit), by Country 2024 & 2032
- Figure 21: South America Pediatric Neuroblastoma Treatment Industry Revenue Share (%), by Country 2024 & 2032
- Figure 22: South America Pediatric Neuroblastoma Treatment Industry Volume Share (%), by Country 2024 & 2032
- Figure 23: North America Pediatric Neuroblastoma Treatment Industry Revenue (Million), by Treatment Type 2024 & 2032
- Figure 24: North America Pediatric Neuroblastoma Treatment Industry Volume (K Unit), by Treatment Type 2024 & 2032
- Figure 25: North America Pediatric Neuroblastoma Treatment Industry Revenue Share (%), by Treatment Type 2024 & 2032
- Figure 26: North America Pediatric Neuroblastoma Treatment Industry Volume Share (%), by Treatment Type 2024 & 2032
- Figure 27: North America Pediatric Neuroblastoma Treatment Industry Revenue (Million), by Distribution Channel 2024 & 2032
- Figure 28: North America Pediatric Neuroblastoma Treatment Industry Volume (K Unit), by Distribution Channel 2024 & 2032
- Figure 29: North America Pediatric Neuroblastoma Treatment Industry Revenue Share (%), by Distribution Channel 2024 & 2032
- Figure 30: North America Pediatric Neuroblastoma Treatment Industry Volume Share (%), by Distribution Channel 2024 & 2032
- Figure 31: North America Pediatric Neuroblastoma Treatment Industry Revenue (Million), by Country 2024 & 2032
- Figure 32: North America Pediatric Neuroblastoma Treatment Industry Volume (K Unit), by Country 2024 & 2032
- Figure 33: North America Pediatric Neuroblastoma Treatment Industry Revenue Share (%), by Country 2024 & 2032
- Figure 34: North America Pediatric Neuroblastoma Treatment Industry Volume Share (%), by Country 2024 & 2032
- Figure 35: Europe Pediatric Neuroblastoma Treatment Industry Revenue (Million), by Treatment Type 2024 & 2032
- Figure 36: Europe Pediatric Neuroblastoma Treatment Industry Volume (K Unit), by Treatment Type 2024 & 2032
- Figure 37: Europe Pediatric Neuroblastoma Treatment Industry Revenue Share (%), by Treatment Type 2024 & 2032
- Figure 38: Europe Pediatric Neuroblastoma Treatment Industry Volume Share (%), by Treatment Type 2024 & 2032
- Figure 39: Europe Pediatric Neuroblastoma Treatment Industry Revenue (Million), by Distribution Channel 2024 & 2032
- Figure 40: Europe Pediatric Neuroblastoma Treatment Industry Volume (K Unit), by Distribution Channel 2024 & 2032
- Figure 41: Europe Pediatric Neuroblastoma Treatment Industry Revenue Share (%), by Distribution Channel 2024 & 2032
- Figure 42: Europe Pediatric Neuroblastoma Treatment Industry Volume Share (%), by Distribution Channel 2024 & 2032
- Figure 43: Europe Pediatric Neuroblastoma Treatment Industry Revenue (Million), by Country 2024 & 2032
- Figure 44: Europe Pediatric Neuroblastoma Treatment Industry Volume (K Unit), by Country 2024 & 2032
- Figure 45: Europe Pediatric Neuroblastoma Treatment Industry Revenue Share (%), by Country 2024 & 2032
- Figure 46: Europe Pediatric Neuroblastoma Treatment Industry Volume Share (%), by Country 2024 & 2032
- Figure 47: Asia Pacific Pediatric Neuroblastoma Treatment Industry Revenue (Million), by Treatment Type 2024 & 2032
- Figure 48: Asia Pacific Pediatric Neuroblastoma Treatment Industry Volume (K Unit), by Treatment Type 2024 & 2032
- Figure 49: Asia Pacific Pediatric Neuroblastoma Treatment Industry Revenue Share (%), by Treatment Type 2024 & 2032
- Figure 50: Asia Pacific Pediatric Neuroblastoma Treatment Industry Volume Share (%), by Treatment Type 2024 & 2032
- Figure 51: Asia Pacific Pediatric Neuroblastoma Treatment Industry Revenue (Million), by Distribution Channel 2024 & 2032
- Figure 52: Asia Pacific Pediatric Neuroblastoma Treatment Industry Volume (K Unit), by Distribution Channel 2024 & 2032
- Figure 53: Asia Pacific Pediatric Neuroblastoma Treatment Industry Revenue Share (%), by Distribution Channel 2024 & 2032
- Figure 54: Asia Pacific Pediatric Neuroblastoma Treatment Industry Volume Share (%), by Distribution Channel 2024 & 2032
- Figure 55: Asia Pacific Pediatric Neuroblastoma Treatment Industry Revenue (Million), by Country 2024 & 2032
- Figure 56: Asia Pacific Pediatric Neuroblastoma Treatment Industry Volume (K Unit), by Country 2024 & 2032
- Figure 57: Asia Pacific Pediatric Neuroblastoma Treatment Industry Revenue Share (%), by Country 2024 & 2032
- Figure 58: Asia Pacific Pediatric Neuroblastoma Treatment Industry Volume Share (%), by Country 2024 & 2032
- Figure 59: Middle East and Africa Pediatric Neuroblastoma Treatment Industry Revenue (Million), by Treatment Type 2024 & 2032
- Figure 60: Middle East and Africa Pediatric Neuroblastoma Treatment Industry Volume (K Unit), by Treatment Type 2024 & 2032
- Figure 61: Middle East and Africa Pediatric Neuroblastoma Treatment Industry Revenue Share (%), by Treatment Type 2024 & 2032
- Figure 62: Middle East and Africa Pediatric Neuroblastoma Treatment Industry Volume Share (%), by Treatment Type 2024 & 2032
- Figure 63: Middle East and Africa Pediatric Neuroblastoma Treatment Industry Revenue (Million), by Distribution Channel 2024 & 2032
- Figure 64: Middle East and Africa Pediatric Neuroblastoma Treatment Industry Volume (K Unit), by Distribution Channel 2024 & 2032
- Figure 65: Middle East and Africa Pediatric Neuroblastoma Treatment Industry Revenue Share (%), by Distribution Channel 2024 & 2032
- Figure 66: Middle East and Africa Pediatric Neuroblastoma Treatment Industry Volume Share (%), by Distribution Channel 2024 & 2032
- Figure 67: Middle East and Africa Pediatric Neuroblastoma Treatment Industry Revenue (Million), by Country 2024 & 2032
- Figure 68: Middle East and Africa Pediatric Neuroblastoma Treatment Industry Volume (K Unit), by Country 2024 & 2032
- Figure 69: Middle East and Africa Pediatric Neuroblastoma Treatment Industry Revenue Share (%), by Country 2024 & 2032
- Figure 70: Middle East and Africa Pediatric Neuroblastoma Treatment Industry Volume Share (%), by Country 2024 & 2032
- Figure 71: South America Pediatric Neuroblastoma Treatment Industry Revenue (Million), by Treatment Type 2024 & 2032
- Figure 72: South America Pediatric Neuroblastoma Treatment Industry Volume (K Unit), by Treatment Type 2024 & 2032
- Figure 73: South America Pediatric Neuroblastoma Treatment Industry Revenue Share (%), by Treatment Type 2024 & 2032
- Figure 74: South America Pediatric Neuroblastoma Treatment Industry Volume Share (%), by Treatment Type 2024 & 2032
- Figure 75: South America Pediatric Neuroblastoma Treatment Industry Revenue (Million), by Distribution Channel 2024 & 2032
- Figure 76: South America Pediatric Neuroblastoma Treatment Industry Volume (K Unit), by Distribution Channel 2024 & 2032
- Figure 77: South America Pediatric Neuroblastoma Treatment Industry Revenue Share (%), by Distribution Channel 2024 & 2032
- Figure 78: South America Pediatric Neuroblastoma Treatment Industry Volume Share (%), by Distribution Channel 2024 & 2032
- Figure 79: South America Pediatric Neuroblastoma Treatment Industry Revenue (Million), by Country 2024 & 2032
- Figure 80: South America Pediatric Neuroblastoma Treatment Industry Volume (K Unit), by Country 2024 & 2032
- Figure 81: South America Pediatric Neuroblastoma Treatment Industry Revenue Share (%), by Country 2024 & 2032
- Figure 82: South America Pediatric Neuroblastoma Treatment Industry Volume Share (%), by Country 2024 & 2032
List of Tables
- Table 1: Global Pediatric Neuroblastoma Treatment Industry Revenue Million Forecast, by Region 2019 & 2032
- Table 2: Global Pediatric Neuroblastoma Treatment Industry Volume K Unit Forecast, by Region 2019 & 2032
- Table 3: Global Pediatric Neuroblastoma Treatment Industry Revenue Million Forecast, by Treatment Type 2019 & 2032
- Table 4: Global Pediatric Neuroblastoma Treatment Industry Volume K Unit Forecast, by Treatment Type 2019 & 2032
- Table 5: Global Pediatric Neuroblastoma Treatment Industry Revenue Million Forecast, by Distribution Channel 2019 & 2032
- Table 6: Global Pediatric Neuroblastoma Treatment Industry Volume K Unit Forecast, by Distribution Channel 2019 & 2032
- Table 7: Global Pediatric Neuroblastoma Treatment Industry Revenue Million Forecast, by Region 2019 & 2032
- Table 8: Global Pediatric Neuroblastoma Treatment Industry Volume K Unit Forecast, by Region 2019 & 2032
- Table 9: Global Pediatric Neuroblastoma Treatment Industry Revenue Million Forecast, by Country 2019 & 2032
- Table 10: Global Pediatric Neuroblastoma Treatment Industry Volume K Unit Forecast, by Country 2019 & 2032
- Table 11: United States Pediatric Neuroblastoma Treatment Industry Revenue (Million) Forecast, by Application 2019 & 2032
- Table 12: United States Pediatric Neuroblastoma Treatment Industry Volume (K Unit) Forecast, by Application 2019 & 2032
- Table 13: Canada Pediatric Neuroblastoma Treatment Industry Revenue (Million) Forecast, by Application 2019 & 2032
- Table 14: Canada Pediatric Neuroblastoma Treatment Industry Volume (K Unit) Forecast, by Application 2019 & 2032
- Table 15: Mexico Pediatric Neuroblastoma Treatment Industry Revenue (Million) Forecast, by Application 2019 & 2032
- Table 16: Mexico Pediatric Neuroblastoma Treatment Industry Volume (K Unit) Forecast, by Application 2019 & 2032
- Table 17: Global Pediatric Neuroblastoma Treatment Industry Revenue Million Forecast, by Country 2019 & 2032
- Table 18: Global Pediatric Neuroblastoma Treatment Industry Volume K Unit Forecast, by Country 2019 & 2032
- Table 19: Germany Pediatric Neuroblastoma Treatment Industry Revenue (Million) Forecast, by Application 2019 & 2032
- Table 20: Germany Pediatric Neuroblastoma Treatment Industry Volume (K Unit) Forecast, by Application 2019 & 2032
- Table 21: United Kingdom Pediatric Neuroblastoma Treatment Industry Revenue (Million) Forecast, by Application 2019 & 2032
- Table 22: United Kingdom Pediatric Neuroblastoma Treatment Industry Volume (K Unit) Forecast, by Application 2019 & 2032
- Table 23: France Pediatric Neuroblastoma Treatment Industry Revenue (Million) Forecast, by Application 2019 & 2032
- Table 24: France Pediatric Neuroblastoma Treatment Industry Volume (K Unit) Forecast, by Application 2019 & 2032
- Table 25: Italy Pediatric Neuroblastoma Treatment Industry Revenue (Million) Forecast, by Application 2019 & 2032
- Table 26: Italy Pediatric Neuroblastoma Treatment Industry Volume (K Unit) Forecast, by Application 2019 & 2032
- Table 27: Spain Pediatric Neuroblastoma Treatment Industry Revenue (Million) Forecast, by Application 2019 & 2032
- Table 28: Spain Pediatric Neuroblastoma Treatment Industry Volume (K Unit) Forecast, by Application 2019 & 2032
- Table 29: Rest of Europe Pediatric Neuroblastoma Treatment Industry Revenue (Million) Forecast, by Application 2019 & 2032
- Table 30: Rest of Europe Pediatric Neuroblastoma Treatment Industry Volume (K Unit) Forecast, by Application 2019 & 2032
- Table 31: Global Pediatric Neuroblastoma Treatment Industry Revenue Million Forecast, by Country 2019 & 2032
- Table 32: Global Pediatric Neuroblastoma Treatment Industry Volume K Unit Forecast, by Country 2019 & 2032
- Table 33: China Pediatric Neuroblastoma Treatment Industry Revenue (Million) Forecast, by Application 2019 & 2032
- Table 34: China Pediatric Neuroblastoma Treatment Industry Volume (K Unit) Forecast, by Application 2019 & 2032
- Table 35: Japan Pediatric Neuroblastoma Treatment Industry Revenue (Million) Forecast, by Application 2019 & 2032
- Table 36: Japan Pediatric Neuroblastoma Treatment Industry Volume (K Unit) Forecast, by Application 2019 & 2032
- Table 37: India Pediatric Neuroblastoma Treatment Industry Revenue (Million) Forecast, by Application 2019 & 2032
- Table 38: India Pediatric Neuroblastoma Treatment Industry Volume (K Unit) Forecast, by Application 2019 & 2032
- Table 39: Australia Pediatric Neuroblastoma Treatment Industry Revenue (Million) Forecast, by Application 2019 & 2032
- Table 40: Australia Pediatric Neuroblastoma Treatment Industry Volume (K Unit) Forecast, by Application 2019 & 2032
- Table 41: South Korea Pediatric Neuroblastoma Treatment Industry Revenue (Million) Forecast, by Application 2019 & 2032
- Table 42: South Korea Pediatric Neuroblastoma Treatment Industry Volume (K Unit) Forecast, by Application 2019 & 2032
- Table 43: Rest of Asia Pacific Pediatric Neuroblastoma Treatment Industry Revenue (Million) Forecast, by Application 2019 & 2032
- Table 44: Rest of Asia Pacific Pediatric Neuroblastoma Treatment Industry Volume (K Unit) Forecast, by Application 2019 & 2032
- Table 45: Global Pediatric Neuroblastoma Treatment Industry Revenue Million Forecast, by Country 2019 & 2032
- Table 46: Global Pediatric Neuroblastoma Treatment Industry Volume K Unit Forecast, by Country 2019 & 2032
- Table 47: GCC Pediatric Neuroblastoma Treatment Industry Revenue (Million) Forecast, by Application 2019 & 2032
- Table 48: GCC Pediatric Neuroblastoma Treatment Industry Volume (K Unit) Forecast, by Application 2019 & 2032
- Table 49: South Africa Pediatric Neuroblastoma Treatment Industry Revenue (Million) Forecast, by Application 2019 & 2032
- Table 50: South Africa Pediatric Neuroblastoma Treatment Industry Volume (K Unit) Forecast, by Application 2019 & 2032
- Table 51: Rest of Middle East and Africa Pediatric Neuroblastoma Treatment Industry Revenue (Million) Forecast, by Application 2019 & 2032
- Table 52: Rest of Middle East and Africa Pediatric Neuroblastoma Treatment Industry Volume (K Unit) Forecast, by Application 2019 & 2032
- Table 53: Global Pediatric Neuroblastoma Treatment Industry Revenue Million Forecast, by Country 2019 & 2032
- Table 54: Global Pediatric Neuroblastoma Treatment Industry Volume K Unit Forecast, by Country 2019 & 2032
- Table 55: Brazil Pediatric Neuroblastoma Treatment Industry Revenue (Million) Forecast, by Application 2019 & 2032
- Table 56: Brazil Pediatric Neuroblastoma Treatment Industry Volume (K Unit) Forecast, by Application 2019 & 2032
- Table 57: Argentina Pediatric Neuroblastoma Treatment Industry Revenue (Million) Forecast, by Application 2019 & 2032
- Table 58: Argentina Pediatric Neuroblastoma Treatment Industry Volume (K Unit) Forecast, by Application 2019 & 2032
- Table 59: Rest of South America Pediatric Neuroblastoma Treatment Industry Revenue (Million) Forecast, by Application 2019 & 2032
- Table 60: Rest of South America Pediatric Neuroblastoma Treatment Industry Volume (K Unit) Forecast, by Application 2019 & 2032
- Table 61: Global Pediatric Neuroblastoma Treatment Industry Revenue Million Forecast, by Treatment Type 2019 & 2032
- Table 62: Global Pediatric Neuroblastoma Treatment Industry Volume K Unit Forecast, by Treatment Type 2019 & 2032
- Table 63: Global Pediatric Neuroblastoma Treatment Industry Revenue Million Forecast, by Distribution Channel 2019 & 2032
- Table 64: Global Pediatric Neuroblastoma Treatment Industry Volume K Unit Forecast, by Distribution Channel 2019 & 2032
- Table 65: Global Pediatric Neuroblastoma Treatment Industry Revenue Million Forecast, by Country 2019 & 2032
- Table 66: Global Pediatric Neuroblastoma Treatment Industry Volume K Unit Forecast, by Country 2019 & 2032
- Table 67: United States Pediatric Neuroblastoma Treatment Industry Revenue (Million) Forecast, by Application 2019 & 2032
- Table 68: United States Pediatric Neuroblastoma Treatment Industry Volume (K Unit) Forecast, by Application 2019 & 2032
- Table 69: Canada Pediatric Neuroblastoma Treatment Industry Revenue (Million) Forecast, by Application 2019 & 2032
- Table 70: Canada Pediatric Neuroblastoma Treatment Industry Volume (K Unit) Forecast, by Application 2019 & 2032
- Table 71: Mexico Pediatric Neuroblastoma Treatment Industry Revenue (Million) Forecast, by Application 2019 & 2032
- Table 72: Mexico Pediatric Neuroblastoma Treatment Industry Volume (K Unit) Forecast, by Application 2019 & 2032
- Table 73: Global Pediatric Neuroblastoma Treatment Industry Revenue Million Forecast, by Treatment Type 2019 & 2032
- Table 74: Global Pediatric Neuroblastoma Treatment Industry Volume K Unit Forecast, by Treatment Type 2019 & 2032
- Table 75: Global Pediatric Neuroblastoma Treatment Industry Revenue Million Forecast, by Distribution Channel 2019 & 2032
- Table 76: Global Pediatric Neuroblastoma Treatment Industry Volume K Unit Forecast, by Distribution Channel 2019 & 2032
- Table 77: Global Pediatric Neuroblastoma Treatment Industry Revenue Million Forecast, by Country 2019 & 2032
- Table 78: Global Pediatric Neuroblastoma Treatment Industry Volume K Unit Forecast, by Country 2019 & 2032
- Table 79: Germany Pediatric Neuroblastoma Treatment Industry Revenue (Million) Forecast, by Application 2019 & 2032
- Table 80: Germany Pediatric Neuroblastoma Treatment Industry Volume (K Unit) Forecast, by Application 2019 & 2032
- Table 81: United Kingdom Pediatric Neuroblastoma Treatment Industry Revenue (Million) Forecast, by Application 2019 & 2032
- Table 82: United Kingdom Pediatric Neuroblastoma Treatment Industry Volume (K Unit) Forecast, by Application 2019 & 2032
- Table 83: France Pediatric Neuroblastoma Treatment Industry Revenue (Million) Forecast, by Application 2019 & 2032
- Table 84: France Pediatric Neuroblastoma Treatment Industry Volume (K Unit) Forecast, by Application 2019 & 2032
- Table 85: Italy Pediatric Neuroblastoma Treatment Industry Revenue (Million) Forecast, by Application 2019 & 2032
- Table 86: Italy Pediatric Neuroblastoma Treatment Industry Volume (K Unit) Forecast, by Application 2019 & 2032
- Table 87: Spain Pediatric Neuroblastoma Treatment Industry Revenue (Million) Forecast, by Application 2019 & 2032
- Table 88: Spain Pediatric Neuroblastoma Treatment Industry Volume (K Unit) Forecast, by Application 2019 & 2032
- Table 89: Rest of Europe Pediatric Neuroblastoma Treatment Industry Revenue (Million) Forecast, by Application 2019 & 2032
- Table 90: Rest of Europe Pediatric Neuroblastoma Treatment Industry Volume (K Unit) Forecast, by Application 2019 & 2032
- Table 91: Global Pediatric Neuroblastoma Treatment Industry Revenue Million Forecast, by Treatment Type 2019 & 2032
- Table 92: Global Pediatric Neuroblastoma Treatment Industry Volume K Unit Forecast, by Treatment Type 2019 & 2032
- Table 93: Global Pediatric Neuroblastoma Treatment Industry Revenue Million Forecast, by Distribution Channel 2019 & 2032
- Table 94: Global Pediatric Neuroblastoma Treatment Industry Volume K Unit Forecast, by Distribution Channel 2019 & 2032
- Table 95: Global Pediatric Neuroblastoma Treatment Industry Revenue Million Forecast, by Country 2019 & 2032
- Table 96: Global Pediatric Neuroblastoma Treatment Industry Volume K Unit Forecast, by Country 2019 & 2032
- Table 97: China Pediatric Neuroblastoma Treatment Industry Revenue (Million) Forecast, by Application 2019 & 2032
- Table 98: China Pediatric Neuroblastoma Treatment Industry Volume (K Unit) Forecast, by Application 2019 & 2032
- Table 99: Japan Pediatric Neuroblastoma Treatment Industry Revenue (Million) Forecast, by Application 2019 & 2032
- Table 100: Japan Pediatric Neuroblastoma Treatment Industry Volume (K Unit) Forecast, by Application 2019 & 2032
- Table 101: India Pediatric Neuroblastoma Treatment Industry Revenue (Million) Forecast, by Application 2019 & 2032
- Table 102: India Pediatric Neuroblastoma Treatment Industry Volume (K Unit) Forecast, by Application 2019 & 2032
- Table 103: Australia Pediatric Neuroblastoma Treatment Industry Revenue (Million) Forecast, by Application 2019 & 2032
- Table 104: Australia Pediatric Neuroblastoma Treatment Industry Volume (K Unit) Forecast, by Application 2019 & 2032
- Table 105: South Korea Pediatric Neuroblastoma Treatment Industry Revenue (Million) Forecast, by Application 2019 & 2032
- Table 106: South Korea Pediatric Neuroblastoma Treatment Industry Volume (K Unit) Forecast, by Application 2019 & 2032
- Table 107: Rest of Asia Pacific Pediatric Neuroblastoma Treatment Industry Revenue (Million) Forecast, by Application 2019 & 2032
- Table 108: Rest of Asia Pacific Pediatric Neuroblastoma Treatment Industry Volume (K Unit) Forecast, by Application 2019 & 2032
- Table 109: Global Pediatric Neuroblastoma Treatment Industry Revenue Million Forecast, by Treatment Type 2019 & 2032
- Table 110: Global Pediatric Neuroblastoma Treatment Industry Volume K Unit Forecast, by Treatment Type 2019 & 2032
- Table 111: Global Pediatric Neuroblastoma Treatment Industry Revenue Million Forecast, by Distribution Channel 2019 & 2032
- Table 112: Global Pediatric Neuroblastoma Treatment Industry Volume K Unit Forecast, by Distribution Channel 2019 & 2032
- Table 113: Global Pediatric Neuroblastoma Treatment Industry Revenue Million Forecast, by Country 2019 & 2032
- Table 114: Global Pediatric Neuroblastoma Treatment Industry Volume K Unit Forecast, by Country 2019 & 2032
- Table 115: GCC Pediatric Neuroblastoma Treatment Industry Revenue (Million) Forecast, by Application 2019 & 2032
- Table 116: GCC Pediatric Neuroblastoma Treatment Industry Volume (K Unit) Forecast, by Application 2019 & 2032
- Table 117: South Africa Pediatric Neuroblastoma Treatment Industry Revenue (Million) Forecast, by Application 2019 & 2032
- Table 118: South Africa Pediatric Neuroblastoma Treatment Industry Volume (K Unit) Forecast, by Application 2019 & 2032
- Table 119: Rest of Middle East and Africa Pediatric Neuroblastoma Treatment Industry Revenue (Million) Forecast, by Application 2019 & 2032
- Table 120: Rest of Middle East and Africa Pediatric Neuroblastoma Treatment Industry Volume (K Unit) Forecast, by Application 2019 & 2032
- Table 121: Global Pediatric Neuroblastoma Treatment Industry Revenue Million Forecast, by Treatment Type 2019 & 2032
- Table 122: Global Pediatric Neuroblastoma Treatment Industry Volume K Unit Forecast, by Treatment Type 2019 & 2032
- Table 123: Global Pediatric Neuroblastoma Treatment Industry Revenue Million Forecast, by Distribution Channel 2019 & 2032
- Table 124: Global Pediatric Neuroblastoma Treatment Industry Volume K Unit Forecast, by Distribution Channel 2019 & 2032
- Table 125: Global Pediatric Neuroblastoma Treatment Industry Revenue Million Forecast, by Country 2019 & 2032
- Table 126: Global Pediatric Neuroblastoma Treatment Industry Volume K Unit Forecast, by Country 2019 & 2032
- Table 127: Brazil Pediatric Neuroblastoma Treatment Industry Revenue (Million) Forecast, by Application 2019 & 2032
- Table 128: Brazil Pediatric Neuroblastoma Treatment Industry Volume (K Unit) Forecast, by Application 2019 & 2032
- Table 129: Argentina Pediatric Neuroblastoma Treatment Industry Revenue (Million) Forecast, by Application 2019 & 2032
- Table 130: Argentina Pediatric Neuroblastoma Treatment Industry Volume (K Unit) Forecast, by Application 2019 & 2032
- Table 131: Rest of South America Pediatric Neuroblastoma Treatment Industry Revenue (Million) Forecast, by Application 2019 & 2032
- Table 132: Rest of South America Pediatric Neuroblastoma Treatment Industry Volume (K Unit) Forecast, by Application 2019 & 2032
Frequently Asked Questions
1. What is the projected Compound Annual Growth Rate (CAGR) of the Pediatric Neuroblastoma Treatment Industry?
The projected CAGR is approximately 6.30%.
2. Which companies are prominent players in the Pediatric Neuroblastoma Treatment Industry?
Key companies in the market include Amgen, Bayer AG, PROVECTUS BIOPHARMACEUTICALS INC, United Therapeutics Corporation, F Hoffmann-La Roche Ltd, Eli Lilly and Company, APEIRON Biologics AG, Sartorius AG, Y-mAbs Therapeutics Inc, CELLECTAR BIOSCIENCES INC, MacroGenics Inc, Baxter International, Pfizer Inc.
3. What are the main segments of the Pediatric Neuroblastoma Treatment Industry?
The market segments include Treatment Type, Distribution Channel.
4. Can you provide details about the market size?
The market size is estimated to be USD XX Million as of 2022.
5. What are some drivers contributing to market growth?
Increasing Burden Of Pediatric Neuroblastoma Coupled With Increasing R&D; Rise in Awareness of Available Treatment For Cancer.
6. What are the notable trends driving market growth?
TheChemotherapy Segment is Anticipated to Witness a Growth in the Pediatric Neuroblastoma Treatment Market Over the Forecast Period.
7. Are there any restraints impacting market growth?
High Cost And Side Effects Associated With Cancer Therapy.
8. Can you provide examples of recent developments in the market?
In October 2022, Kyushu University sponsored a clinical trial under the title "Clinical Trial of GAIA-102 for Refractory/Relapse Neuroblastomas or Malignant Pediatric Solid Tumors With Lung Metastases" to evaluate the safety of GAIA-102 alone refractory/relapse neuroblastoma or pediatric solid tumors with lung metastases and to decide a recommended dose for Phase II.
9. What pricing options are available for accessing the report?
Pricing options include single-user, multi-user, and enterprise licenses priced at USD 4750, USD 5250, and USD 8750 respectively.
10. Is the market size provided in terms of value or volume?
The market size is provided in terms of value, measured in Million and volume, measured in K Unit.
11. Are there any specific market keywords associated with the report?
Yes, the market keyword associated with the report is "Pediatric Neuroblastoma Treatment Industry," which aids in identifying and referencing the specific market segment covered.
12. How do I determine which pricing option suits my needs best?
The pricing options vary based on user requirements and access needs. Individual users may opt for single-user licenses, while businesses requiring broader access may choose multi-user or enterprise licenses for cost-effective access to the report.
13. Are there any additional resources or data provided in the Pediatric Neuroblastoma Treatment Industry report?
While the report offers comprehensive insights, it's advisable to review the specific contents or supplementary materials provided to ascertain if additional resources or data are available.
14. How can I stay updated on further developments or reports in the Pediatric Neuroblastoma Treatment Industry?
To stay informed about further developments, trends, and reports in the Pediatric Neuroblastoma Treatment Industry, consider subscribing to industry newsletters, following relevant companies and organizations, or regularly checking reputable industry news sources and publications.
Methodology
Step 1 - Identification of Relevant Samples Size from Population Database


Step 2 - Approaches for Defining Global Market Size (Value, Volume* & Price*)

Note*: In applicable scenarios
Step 3 - Data Sources
Primary Research
- Web Analytics
- Survey Reports
- Research Institute
- Latest Research Reports
- Opinion Leaders
Secondary Research
- Annual Reports
- White Paper
- Latest Press Release
- Industry Association
- Paid Database
- Investor Presentations

Step 4 - Data Triangulation
Involves using different sources of information in order to increase the validity of a study
These sources are likely to be stakeholders in a program - participants, other researchers, program staff, other community members, and so on.
Then we put all data in single framework & apply various statistical tools to find out the dynamic on the market.
During the analysis stage, feedback from the stakeholder groups would be compared to determine areas of agreement as well as areas of divergence


