


Key Insights
The global Pediatric Radiology Equipment market is projected for robust expansion, with an estimated market size of $6.29 billion in 2025. This growth is fueled by an increasing prevalence of pediatric diseases and congenital abnormalities requiring advanced diagnostic imaging. A CAGR of 5.9% over the forecast period (2025-2033) indicates sustained upward momentum, driven by technological advancements leading to safer, more efficient, and child-friendly radiology solutions. Key applications like Oncology and Cardiology are significant revenue contributors, with ongoing research and development focused on minimizing radiation exposure and improving diagnostic accuracy for young patients. The market is characterized by a strong emphasis on innovation, with leading companies continually introducing next-generation equipment designed for pediatric anatomical specificities.
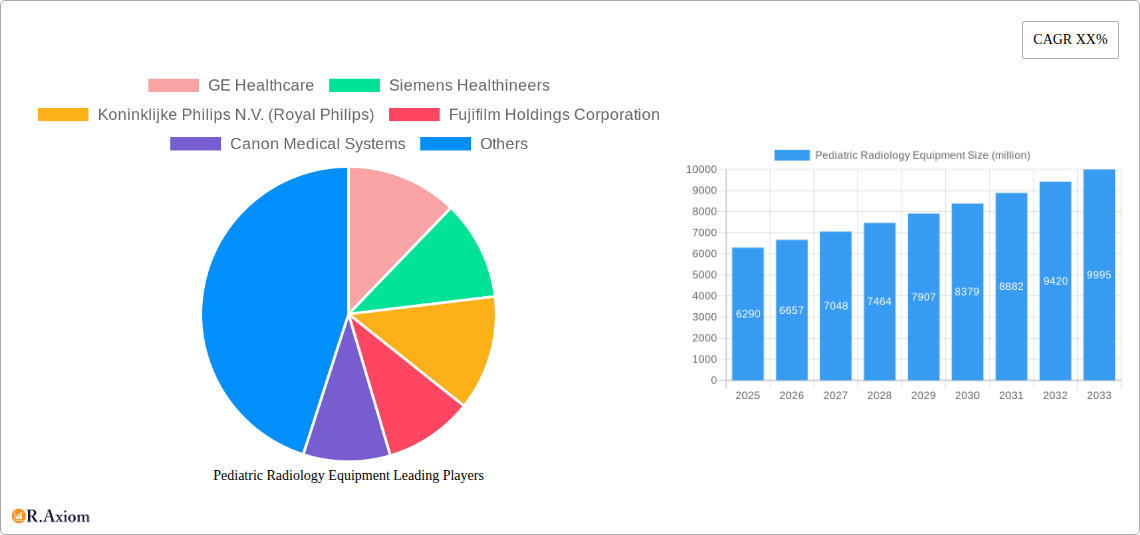
Pediatric Radiology Equipment Market Size (In Billion)

Several factors are shaping the pediatric radiology equipment landscape. A growing understanding of the long-term effects of radiation exposure in children is propelling the adoption of low-dose CT scanners and advanced MRI techniques. The expanding healthcare infrastructure in emerging economies, coupled with increasing parental awareness regarding early disease detection, further bolsters market growth. While the high cost of advanced pediatric radiology equipment and the need for specialized training for healthcare professionals present certain restraints, the overwhelming demand for accurate and safe diagnostic tools for children is expected to outweigh these challenges. The market's segmentation by equipment type, including Ultrasound, MRI, CT, and X-ray, reflects diverse clinical needs, with each modality playing a crucial role in comprehensive pediatric care.
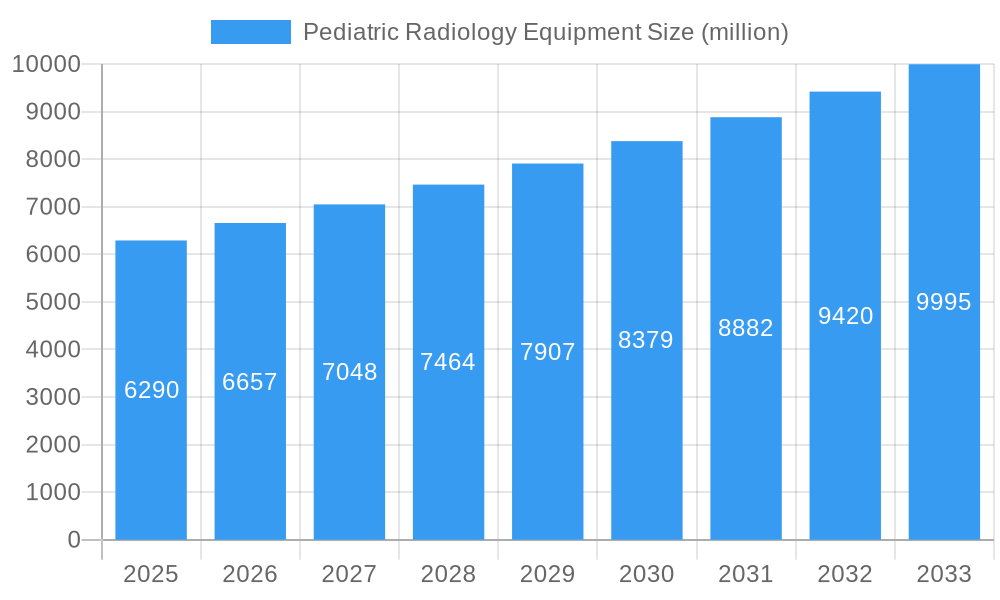
Pediatric Radiology Equipment Company Market Share
Pediatric Radiology Equipment Market Concentration & Innovation
The global pediatric radiology equipment market exhibits a moderate level of concentration, with key players like GE Healthcare, Siemens Healthineers, Koninklijke Philips N.V. (Royal Philips), Fujifilm Holdings Corporation, and Canon Medical Systems commanding significant market share. These industry giants are continuously investing in research and development to drive innovation, focusing on technologies that offer enhanced diagnostic accuracy, reduced radiation exposure for young patients, and improved patient comfort. Innovation drivers include the increasing prevalence of pediatric diseases requiring advanced imaging, the demand for sophisticated diagnostic tools in specialized pediatric care centers, and the pursuit of miniaturized and portable imaging solutions. Regulatory frameworks, such as those from the FDA and EMA, play a crucial role in shaping product development and market entry, emphasizing safety and efficacy for the pediatric population. While direct product substitutes are limited in advanced diagnostic imaging, advancements in AI-powered image analysis and cloud-based diagnostic platforms are emerging as complementary technologies that enhance the value proposition of existing equipment. End-user trends point towards a growing preference for non-invasive imaging techniques and the integration of AI for automated anomaly detection and workflow optimization. Mergers and acquisitions (M&A) activities, though less frequent than in broader medical device markets, are strategically employed by leading companies to acquire specialized technologies or expand their geographical reach. For instance, past M&A deals in the broader medical imaging sector have ranged from hundreds of millions to billions of dollars, signaling the strategic importance of technological integration and market consolidation. The market share distribution is dynamic, with major players holding an estimated collective share of over sixty billion dollars.
Pediatric Radiology Equipment Industry Trends & Insights
The pediatric radiology equipment market is poised for substantial growth, driven by a confluence of factors including rising global birth rates, increasing incidence of congenital disorders and chronic pediatric illnesses, and a growing emphasis on early diagnosis and intervention. The market is projected to witness a Compound Annual Growth Rate (CAGR) of approximately 7.5%, with an estimated market size exceeding fifty billion dollars by the end of the forecast period in 2033. This upward trajectory is underpinned by significant technological advancements that are revolutionizing pediatric imaging. For example, the development of low-dose CT scanners and advanced MRI techniques specifically designed for pediatric patients, such as ultra-low field MRI, are gaining traction due to their ability to minimize radiation exposure and improve image quality without the need for sedation in many cases. The growing adoption of artificial intelligence (AI) and machine learning (ML) algorithms is another transformative trend, enabling faster image acquisition, automated image analysis, and more accurate detection of subtle abnormalities in pediatric scans. This not only enhances diagnostic efficiency but also contributes to personalized treatment planning. Consumer preferences are increasingly leaning towards imaging solutions that offer enhanced patient comfort and reduced anxiety for children. This has led to the development of specialized pediatric imaging rooms with child-friendly designs, as well as imaging equipment that is quieter and less intimidating. Furthermore, the growing demand for mobile and point-of-care diagnostic solutions is driving innovation in portable ultrasound and compact X-ray systems, facilitating imaging in neonatal intensive care units (NICUs) and emergency settings. Competitive dynamics are characterized by intense innovation and strategic partnerships between equipment manufacturers and healthcare providers. Companies are investing heavily in developing integrated imaging solutions that combine multiple modalities and offer advanced workflow management software. The market penetration of advanced pediatric radiology equipment is expected to rise significantly as healthcare infrastructure in developing economies improves and awareness about the benefits of early and accurate diagnosis increases. The estimated market size in the base year of 2025 is projected to be around thirty billion dollars, with a steady expansion expected over the next decade.
Dominant Markets & Segments in Pediatric Radiology Equipment
The pediatric radiology equipment market is segmented by application and type, with distinct regional and national dominance influenced by economic, demographic, and healthcare infrastructure factors. In terms of applications, Orthopedics/Trauma often emerges as a dominant segment due to the high incidence of bone fractures, developmental abnormalities, and sports-related injuries in children. The demand for advanced X-ray, CT, and MRI systems for precise diagnosis and treatment planning in pediatric orthopedics is substantial. Key drivers for this segment's dominance include the active lifestyles of children, the growing participation in sports, and advancements in orthopedic surgical techniques that rely on high-resolution imaging.
Cardiology also represents a significant and growing segment, driven by the increasing prevalence of congenital heart defects and the need for advanced imaging like echocardiography and cardiac MRI for diagnosis and monitoring. Economic policies that prioritize maternal and child health, coupled with robust healthcare infrastructure, contribute to the strong performance of this segment.
The Neurology segment is crucial for diagnosing and managing a wide range of pediatric neurological conditions, from epilepsy to brain tumors. Advancements in MRI techniques, including diffusion-weighted imaging and functional MRI, are vital here. The availability of specialized pediatric neurological centers and research initiatives fuels the demand for these sophisticated tools.
Oncology remains a critical application, with radiology playing a pivotal role in the detection, staging, and monitoring of pediatric cancers. The development of advanced CT and MRI scanners with enhanced contrast capabilities and reduced scan times is essential for minimizing discomfort for young cancer patients. The global efforts to combat childhood cancer and the availability of advanced treatment protocols drive the demand in this segment.
Gastroenterology applications, while perhaps less prominent than orthopedics or cardiology, are still important for diagnosing conditions such as inflammatory bowel disease and malformations of the digestive tract. Ultrasound and MRI are key modalities in this area.
In terms of Types of pediatric radiology equipment, Magnetic Resonance Imaging (MRI) systems are witnessing significant growth due to their non-ionizing nature, making them ideal for repeated scans in children. The development of pediatric-specific MRI coils, faster scanning sequences, and solutions to reduce patient motion are key innovations driving this segment's expansion. The market size for MRI in pediatric radiology is estimated to be over fifteen billion dollars in the forecast period.
Computed Tomography (CT) scanners, particularly low-dose and ultra-fast systems, remain indispensable for rapid imaging of trauma and acute conditions. Advancements in dose reduction technologies and iterative reconstruction algorithms are crucial for minimizing radiation exposure in pediatric CT imaging. The market for CT scanners is projected to reach over ten billion dollars.
Ultrasound equipment, known for its portability, affordability, and safety, is widely used in pediatrics for a broad range of applications, from abdominal imaging to musculoskeletal assessment and neonatal brain imaging. The increasing adoption of portable and high-resolution ultrasound devices is a key trend.
X-ray systems, especially digital radiography (DR) and mobile X-ray units, continue to be a workhorse in pediatric imaging for skeletal assessments and chest X-rays. The market for X-ray equipment is expected to remain robust, with a focus on dose optimization and image quality.
Geographically, North America and Europe currently lead the market due to well-established healthcare infrastructure, high disposable incomes, and a strong focus on advanced medical technologies and research. However, the Asia Pacific region is emerging as a high-growth market, driven by increasing healthcare expenditure, rising awareness of advanced diagnostic imaging, and a growing pediatric population. Countries like China and India are experiencing substantial investments in healthcare infrastructure, creating significant opportunities for pediatric radiology equipment manufacturers. Economic policies supporting public health initiatives and infrastructure development are critical regional growth catalysts.
Pediatric Radiology Equipment Product Developments
Product developments in the pediatric radiology equipment market are intensely focused on enhancing diagnostic accuracy while prioritizing patient safety and comfort. Manufacturers are introducing advanced ultrasound systems with specialized pediatric probes for neonatal and pediatric imaging, offering unparalleled resolution and real-time visualization of delicate anatomy. Innovations in MRI technology include faster scanning sequences, whisper-quiet operation to reduce patient anxiety, and AI-powered image reconstruction for improved clarity and reduced scan times, especially for younger children who may struggle to remain still. Low-dose CT scanners with advanced iterative reconstruction algorithms are becoming standard, significantly reducing radiation exposure without compromising diagnostic quality. The integration of AI for image analysis, automated anomaly detection, and dose optimization is a pervasive trend across all modalities, providing competitive advantages by improving workflow efficiency and diagnostic confidence for radiologists.
Report Scope & Segmentation Analysis
This report offers a comprehensive analysis of the global pediatric radiology equipment market, segmented by application and equipment type. The Application segments analyzed include Oncology, Cardiology, Orthopedics/Trauma, Gastroenterology, Neurology, and Others. Each segment's growth is influenced by the prevalence of specific pediatric diseases and the adoption of advanced imaging techniques. The Types of equipment covered are Ultrasound, Magnetic Resonance Imaging (MRI), Computed Tomography (CT), X-ray, and Others. Market size projections and competitive dynamics are detailed for each segment, with the MRI and CT segments expected to exhibit robust growth due to technological advancements and their critical role in diagnosing a wide spectrum of pediatric conditions. The projected market size for the Ultrasound segment is approximately seven billion dollars, while the X-ray segment is estimated to be around six billion dollars in the forecast period.
Key Drivers of Pediatric Radiology Equipment Growth
Several key drivers are propelling the growth of the pediatric radiology equipment market. Increasing prevalence of pediatric diseases, including congenital disorders, cancer, and chronic conditions, necessitates advanced diagnostic imaging. Technological advancements, such as the development of low-dose imaging technologies and AI-powered image analysis, are crucial for improving diagnostic accuracy and patient safety. Growing healthcare expenditure globally, particularly in emerging economies, is expanding access to sophisticated medical equipment. Furthermore, favorable government initiatives and regulatory support promoting pediatric healthcare and medical device innovation contribute significantly to market expansion. The rising demand for early diagnosis and personalized treatment strategies further fuels the adoption of advanced radiology solutions.
Challenges in the Pediatric Radiology Equipment Sector
Despite robust growth prospects, the pediatric radiology equipment sector faces several challenges. High cost of advanced imaging equipment can be a significant barrier, especially for healthcare facilities in low- and middle-income countries. Stringent regulatory approvals for medical devices intended for pediatric use, while essential for safety, can lengthen the time to market for new innovations. Limited availability of trained pediatric radiologists and technologists in certain regions can hinder the optimal utilization of advanced equipment. Concerns regarding radiation exposure, although being addressed by technological advancements, remain a factor influencing modality selection. Finally, supply chain disruptions and geopolitical uncertainties can impact manufacturing and distribution, potentially leading to delays and increased costs.
Emerging Opportunities in Pediatric Radiology Equipment
Emerging opportunities in the pediatric radiology equipment market are multifaceted. The growing adoption of Artificial Intelligence (AI) and Machine Learning (ML) in medical imaging presents a significant opportunity for developing predictive diagnostic tools and automating image analysis workflows, enhancing efficiency and accuracy. The increasing demand for portable and point-of-care ultrasound devices opens avenues for imaging in remote areas and critical care settings. Expansion into emerging markets in Asia Pacific and Latin America, driven by improving healthcare infrastructure and increasing disposable incomes, offers substantial growth potential. Furthermore, the development of novel imaging techniques and specialized pediatric coils and accessories tailored for specific anatomical regions and patient populations represents a niche but valuable opportunity. The focus on minimally invasive diagnostic procedures also drives demand for high-resolution imaging modalities.
Leading Players in the Pediatric Radiology Equipment Market
- GE Healthcare
- Siemens Healthineers
- Koninklijke Philips N.V. (Royal Philips)
- Fujifilm Holdings Corporation
- Canon Medical Systems
- Samsung Electronics Co.,Ltd.
- Agfa Healthcare
- Carestream Health, Inc.
- Hitachi Healthcare
- Medtronic
Key Developments in Pediatric Radiology Equipment Industry
- 2023, Q4: Launch of a new generation of ultra-low field MRI systems with enhanced pediatric imaging capabilities.
- 2023, Q3: FDA approval for an AI-powered software solution for automated detection of pediatric fractures on X-ray images.
- 2023, Q2: Siemens Healthineers acquires a leading AI imaging analytics company specializing in pediatric radiology.
- 2023, Q1: Koninklijke Philips N.V. (Royal Philips) introduces a new portable ultrasound system with advanced features for neonatal imaging.
- 2022, Q4: Canon Medical Systems unveils a CT scanner with significantly reduced radiation dose for pediatric patients.
- 2022, Q3: GE Healthcare announces expanded collaborations with pediatric hospitals for research into advanced imaging techniques.
- 2022, Q2: Fujifilm Holdings Corporation launches new digital radiography detectors optimized for pediatric skeletal imaging.
- 2022, Q1: Medtronic invests in a startup developing novel imaging contrast agents for pediatric applications.
Strategic Outlook for Pediatric Radiology Equipment Market
The strategic outlook for the pediatric radiology equipment market is exceptionally bright, characterized by continuous innovation and expanding global demand. Key growth catalysts include the relentless pursuit of technologies that reduce radiation exposure and improve patient comfort, such as advanced MRI and low-dose CT. The integration of Artificial Intelligence across all imaging modalities will be a critical differentiator, enhancing diagnostic accuracy and operational efficiency. Expansion into underserved emerging markets presents a significant opportunity for market leaders. Strategic partnerships and potential consolidations will likely shape the competitive landscape, enabling companies to broaden their portfolios and geographical reach. Investments in research and development focused on specific pediatric disease areas and novel imaging techniques will be crucial for sustained market leadership. The growing emphasis on integrated healthcare solutions, offering seamless data management and remote diagnostic capabilities, will also drive strategic decisions.
Pediatric Radiology Equipment Segmentation
-
1. Application
- 1.1. Oncology
- 1.2. Cardiology
- 1.3. Orthopedics/Trauma
- 1.4. Gastroenterology
- 1.5. Neurology
- 1.6. Others
-
2. Types
- 2.1. Ultrasound
- 2.2. Magnetic Resonance Imaging (MRI)
- 2.3. Computed Tomography (CT)
- 2.4. X-ray
- 2.5. Others
Pediatric Radiology Equipment Segmentation By Geography
-
1. North America
- 1.1. United States
- 1.2. Canada
- 1.3. Mexico
-
2. South America
- 2.1. Brazil
- 2.2. Argentina
- 2.3. Rest of South America
-
3. Europe
- 3.1. United Kingdom
- 3.2. Germany
- 3.3. France
- 3.4. Italy
- 3.5. Spain
- 3.6. Russia
- 3.7. Benelux
- 3.8. Nordics
- 3.9. Rest of Europe
-
4. Middle East & Africa
- 4.1. Turkey
- 4.2. Israel
- 4.3. GCC
- 4.4. North Africa
- 4.5. South Africa
- 4.6. Rest of Middle East & Africa
-
5. Asia Pacific
- 5.1. China
- 5.2. India
- 5.3. Japan
- 5.4. South Korea
- 5.5. ASEAN
- 5.6. Oceania
- 5.7. Rest of Asia Pacific
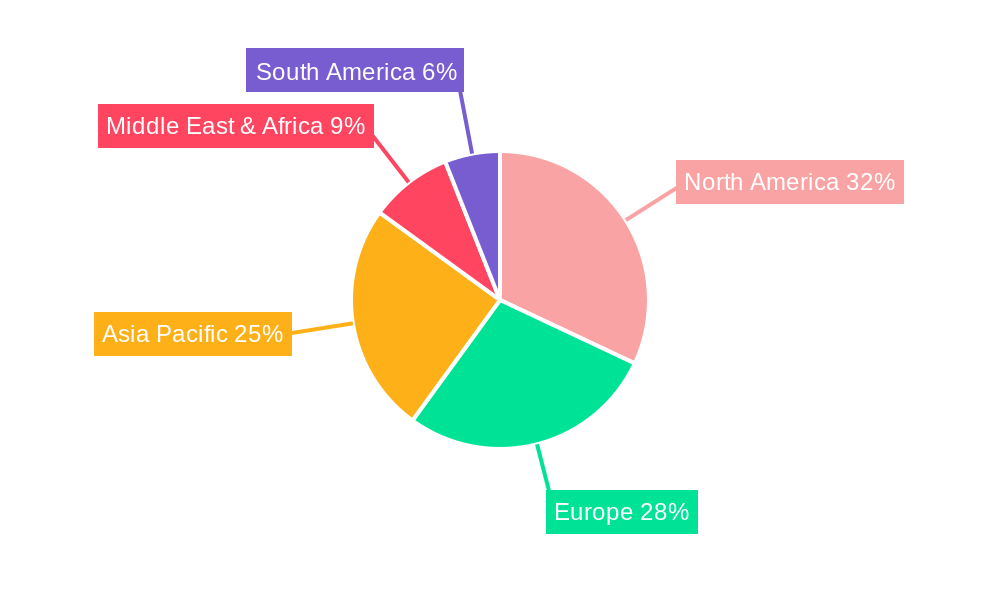
Pediatric Radiology Equipment Regional Market Share
Geographic Coverage of Pediatric Radiology Equipment
Pediatric Radiology Equipment REPORT HIGHLIGHTS
| Aspects | Details |
|---|---|
| Study Period | 2020-2034 |
| Base Year | 2025 |
| Estimated Year | 2026 |
| Forecast Period | 2026-2034 |
| Historical Period | 2020-2025 |
| Growth Rate | CAGR of 4.5% from 2020-2034 |
| Segmentation |
|
Table of Contents
- 1. Introduction
- 1.1. Research Scope
- 1.2. Market Segmentation
- 1.3. Research Objective
- 1.4. Definitions and Assumptions
- 2. Executive Summary
- 2.1. Market Snapshot
- 3. Market Dynamics
- 3.1. Market Drivers
- 3.2. Market Restrains
- 3.3. Market Trends
- 3.4. Market Opportunities
- 4. Market Factor Analysis
- 4.1. Porters Five Forces
- 4.1.1. Bargaining Power of Suppliers
- 4.1.2. Bargaining Power of Buyers
- 4.1.3. Threat of New Entrants
- 4.1.4. Threat of Substitutes
- 4.1.5. Competitive Rivalry
- 4.2. PESTEL analysis
- 4.3. BCG Analysis
- 4.3.1. Stars (High Growth, High Market Share)
- 4.3.2. Cash Cows (Low Growth, High Market Share)
- 4.3.3. Question Mark (High Growth, Low Market Share)
- 4.3.4. Dogs (Low Growth, Low Market Share)
- 4.4. Ansoff Matrix Analysis
- 4.5. Supply Chain Analysis
- 4.6. Regulatory Landscape
- 4.7. Current Market Potential and Opportunity Assessment (TAM–SAM–SOM Framework)
- 4.8. RAX Analyst Note
- 4.1. Porters Five Forces
- 5. Market Analysis, Insights and Forecast 2021-2033
- 5.1. Market Analysis, Insights and Forecast - by Application
- 5.1.1. Oncology
- 5.1.2. Cardiology
- 5.1.3. Orthopedics/Trauma
- 5.1.4. Gastroenterology
- 5.1.5. Neurology
- 5.1.6. Others
- 5.2. Market Analysis, Insights and Forecast - by Types
- 5.2.1. Ultrasound
- 5.2.2. Magnetic Resonance Imaging (MRI)
- 5.2.3. Computed Tomography (CT)
- 5.2.4. X-ray
- 5.2.5. Others
- 5.3. Market Analysis, Insights and Forecast - by Region
- 5.3.1. North America
- 5.3.2. South America
- 5.3.3. Europe
- 5.3.4. Middle East & Africa
- 5.3.5. Asia Pacific
- 5.1. Market Analysis, Insights and Forecast - by Application
- 6. Global Pediatric Radiology Equipment Analysis, Insights and Forecast, 2021-2033
- 6.1. Market Analysis, Insights and Forecast - by Application
- 6.1.1. Oncology
- 6.1.2. Cardiology
- 6.1.3. Orthopedics/Trauma
- 6.1.4. Gastroenterology
- 6.1.5. Neurology
- 6.1.6. Others
- 6.2. Market Analysis, Insights and Forecast - by Types
- 6.2.1. Ultrasound
- 6.2.2. Magnetic Resonance Imaging (MRI)
- 6.2.3. Computed Tomography (CT)
- 6.2.4. X-ray
- 6.2.5. Others
- 6.1. Market Analysis, Insights and Forecast - by Application
- 7. North America Pediatric Radiology Equipment Analysis, Insights and Forecast, 2020-2032
- 7.1. Market Analysis, Insights and Forecast - by Application
- 7.1.1. Oncology
- 7.1.2. Cardiology
- 7.1.3. Orthopedics/Trauma
- 7.1.4. Gastroenterology
- 7.1.5. Neurology
- 7.1.6. Others
- 7.2. Market Analysis, Insights and Forecast - by Types
- 7.2.1. Ultrasound
- 7.2.2. Magnetic Resonance Imaging (MRI)
- 7.2.3. Computed Tomography (CT)
- 7.2.4. X-ray
- 7.2.5. Others
- 7.1. Market Analysis, Insights and Forecast - by Application
- 8. South America Pediatric Radiology Equipment Analysis, Insights and Forecast, 2020-2032
- 8.1. Market Analysis, Insights and Forecast - by Application
- 8.1.1. Oncology
- 8.1.2. Cardiology
- 8.1.3. Orthopedics/Trauma
- 8.1.4. Gastroenterology
- 8.1.5. Neurology
- 8.1.6. Others
- 8.2. Market Analysis, Insights and Forecast - by Types
- 8.2.1. Ultrasound
- 8.2.2. Magnetic Resonance Imaging (MRI)
- 8.2.3. Computed Tomography (CT)
- 8.2.4. X-ray
- 8.2.5. Others
- 8.1. Market Analysis, Insights and Forecast - by Application
- 9. Europe Pediatric Radiology Equipment Analysis, Insights and Forecast, 2020-2032
- 9.1. Market Analysis, Insights and Forecast - by Application
- 9.1.1. Oncology
- 9.1.2. Cardiology
- 9.1.3. Orthopedics/Trauma
- 9.1.4. Gastroenterology
- 9.1.5. Neurology
- 9.1.6. Others
- 9.2. Market Analysis, Insights and Forecast - by Types
- 9.2.1. Ultrasound
- 9.2.2. Magnetic Resonance Imaging (MRI)
- 9.2.3. Computed Tomography (CT)
- 9.2.4. X-ray
- 9.2.5. Others
- 9.1. Market Analysis, Insights and Forecast - by Application
- 10. Middle East & Africa Pediatric Radiology Equipment Analysis, Insights and Forecast, 2020-2032
- 10.1. Market Analysis, Insights and Forecast - by Application
- 10.1.1. Oncology
- 10.1.2. Cardiology
- 10.1.3. Orthopedics/Trauma
- 10.1.4. Gastroenterology
- 10.1.5. Neurology
- 10.1.6. Others
- 10.2. Market Analysis, Insights and Forecast - by Types
- 10.2.1. Ultrasound
- 10.2.2. Magnetic Resonance Imaging (MRI)
- 10.2.3. Computed Tomography (CT)
- 10.2.4. X-ray
- 10.2.5. Others
- 10.1. Market Analysis, Insights and Forecast - by Application
- 11. Asia Pacific Pediatric Radiology Equipment Analysis, Insights and Forecast, 2020-2032
- 11.1. Market Analysis, Insights and Forecast - by Application
- 11.1.1. Oncology
- 11.1.2. Cardiology
- 11.1.3. Orthopedics/Trauma
- 11.1.4. Gastroenterology
- 11.1.5. Neurology
- 11.1.6. Others
- 11.2. Market Analysis, Insights and Forecast - by Types
- 11.2.1. Ultrasound
- 11.2.2. Magnetic Resonance Imaging (MRI)
- 11.2.3. Computed Tomography (CT)
- 11.2.4. X-ray
- 11.2.5. Others
- 11.1. Market Analysis, Insights and Forecast - by Application
- 12. Competitive Analysis
- 12.1. Company Profiles
- 12.1.1 GE Healthcare
- 12.1.1.1. Company Overview
- 12.1.1.2. Products
- 12.1.1.3. Company Financials
- 12.1.1.4. SWOT Analysis
- 12.1.2 Siemens Healthineers
- 12.1.2.1. Company Overview
- 12.1.2.2. Products
- 12.1.2.3. Company Financials
- 12.1.2.4. SWOT Analysis
- 12.1.3 Koninklijke Philips N.V. (Royal Philips)
- 12.1.3.1. Company Overview
- 12.1.3.2. Products
- 12.1.3.3. Company Financials
- 12.1.3.4. SWOT Analysis
- 12.1.4 Fujifilm Holdings Corporation
- 12.1.4.1. Company Overview
- 12.1.4.2. Products
- 12.1.4.3. Company Financials
- 12.1.4.4. SWOT Analysis
- 12.1.5 Canon Medical Systems
- 12.1.5.1. Company Overview
- 12.1.5.2. Products
- 12.1.5.3. Company Financials
- 12.1.5.4. SWOT Analysis
- 12.1.6 Samsung Electronics Co.
- 12.1.6.1. Company Overview
- 12.1.6.2. Products
- 12.1.6.3. Company Financials
- 12.1.6.4. SWOT Analysis
- 12.1.7 Ltd.
- 12.1.7.1. Company Overview
- 12.1.7.2. Products
- 12.1.7.3. Company Financials
- 12.1.7.4. SWOT Analysis
- 12.1.8 Agfa Healthcare
- 12.1.8.1. Company Overview
- 12.1.8.2. Products
- 12.1.8.3. Company Financials
- 12.1.8.4. SWOT Analysis
- 12.1.9 Carestream Health
- 12.1.9.1. Company Overview
- 12.1.9.2. Products
- 12.1.9.3. Company Financials
- 12.1.9.4. SWOT Analysis
- 12.1.10 Inc.
- 12.1.10.1. Company Overview
- 12.1.10.2. Products
- 12.1.10.3. Company Financials
- 12.1.10.4. SWOT Analysis
- 12.1.11 Hitachi Healthcare
- 12.1.11.1. Company Overview
- 12.1.11.2. Products
- 12.1.11.3. Company Financials
- 12.1.11.4. SWOT Analysis
- 12.1.12 Medtronic
- 12.1.12.1. Company Overview
- 12.1.12.2. Products
- 12.1.12.3. Company Financials
- 12.1.12.4. SWOT Analysis
- 12.1.1 GE Healthcare
- 12.2. Market Entropy
- 12.2.1 Company's Key Areas Served
- 12.2.2 Recent Developments
- 12.3. Company Market Share Analysis 2025
- 12.3.1 Top 5 Companies Market Share Analysis
- 12.3.2 Top 3 Companies Market Share Analysis
- 12.4. List of Potential Customers
- 13. Research Methodology
List of Figures
- Figure 1: Global Pediatric Radiology Equipment Revenue Breakdown (billion, %) by Region 2025 & 2033
- Figure 2: Global Pediatric Radiology Equipment Volume Breakdown (K, %) by Region 2025 & 2033
- Figure 3: North America Pediatric Radiology Equipment Revenue (billion), by Application 2025 & 2033
- Figure 4: North America Pediatric Radiology Equipment Volume (K), by Application 2025 & 2033
- Figure 5: North America Pediatric Radiology Equipment Revenue Share (%), by Application 2025 & 2033
- Figure 6: North America Pediatric Radiology Equipment Volume Share (%), by Application 2025 & 2033
- Figure 7: North America Pediatric Radiology Equipment Revenue (billion), by Types 2025 & 2033
- Figure 8: North America Pediatric Radiology Equipment Volume (K), by Types 2025 & 2033
- Figure 9: North America Pediatric Radiology Equipment Revenue Share (%), by Types 2025 & 2033
- Figure 10: North America Pediatric Radiology Equipment Volume Share (%), by Types 2025 & 2033
- Figure 11: North America Pediatric Radiology Equipment Revenue (billion), by Country 2025 & 2033
- Figure 12: North America Pediatric Radiology Equipment Volume (K), by Country 2025 & 2033
- Figure 13: North America Pediatric Radiology Equipment Revenue Share (%), by Country 2025 & 2033
- Figure 14: North America Pediatric Radiology Equipment Volume Share (%), by Country 2025 & 2033
- Figure 15: South America Pediatric Radiology Equipment Revenue (billion), by Application 2025 & 2033
- Figure 16: South America Pediatric Radiology Equipment Volume (K), by Application 2025 & 2033
- Figure 17: South America Pediatric Radiology Equipment Revenue Share (%), by Application 2025 & 2033
- Figure 18: South America Pediatric Radiology Equipment Volume Share (%), by Application 2025 & 2033
- Figure 19: South America Pediatric Radiology Equipment Revenue (billion), by Types 2025 & 2033
- Figure 20: South America Pediatric Radiology Equipment Volume (K), by Types 2025 & 2033
- Figure 21: South America Pediatric Radiology Equipment Revenue Share (%), by Types 2025 & 2033
- Figure 22: South America Pediatric Radiology Equipment Volume Share (%), by Types 2025 & 2033
- Figure 23: South America Pediatric Radiology Equipment Revenue (billion), by Country 2025 & 2033
- Figure 24: South America Pediatric Radiology Equipment Volume (K), by Country 2025 & 2033
- Figure 25: South America Pediatric Radiology Equipment Revenue Share (%), by Country 2025 & 2033
- Figure 26: South America Pediatric Radiology Equipment Volume Share (%), by Country 2025 & 2033
- Figure 27: Europe Pediatric Radiology Equipment Revenue (billion), by Application 2025 & 2033
- Figure 28: Europe Pediatric Radiology Equipment Volume (K), by Application 2025 & 2033
- Figure 29: Europe Pediatric Radiology Equipment Revenue Share (%), by Application 2025 & 2033
- Figure 30: Europe Pediatric Radiology Equipment Volume Share (%), by Application 2025 & 2033
- Figure 31: Europe Pediatric Radiology Equipment Revenue (billion), by Types 2025 & 2033
- Figure 32: Europe Pediatric Radiology Equipment Volume (K), by Types 2025 & 2033
- Figure 33: Europe Pediatric Radiology Equipment Revenue Share (%), by Types 2025 & 2033
- Figure 34: Europe Pediatric Radiology Equipment Volume Share (%), by Types 2025 & 2033
- Figure 35: Europe Pediatric Radiology Equipment Revenue (billion), by Country 2025 & 2033
- Figure 36: Europe Pediatric Radiology Equipment Volume (K), by Country 2025 & 2033
- Figure 37: Europe Pediatric Radiology Equipment Revenue Share (%), by Country 2025 & 2033
- Figure 38: Europe Pediatric Radiology Equipment Volume Share (%), by Country 2025 & 2033
- Figure 39: Middle East & Africa Pediatric Radiology Equipment Revenue (billion), by Application 2025 & 2033
- Figure 40: Middle East & Africa Pediatric Radiology Equipment Volume (K), by Application 2025 & 2033
- Figure 41: Middle East & Africa Pediatric Radiology Equipment Revenue Share (%), by Application 2025 & 2033
- Figure 42: Middle East & Africa Pediatric Radiology Equipment Volume Share (%), by Application 2025 & 2033
- Figure 43: Middle East & Africa Pediatric Radiology Equipment Revenue (billion), by Types 2025 & 2033
- Figure 44: Middle East & Africa Pediatric Radiology Equipment Volume (K), by Types 2025 & 2033
- Figure 45: Middle East & Africa Pediatric Radiology Equipment Revenue Share (%), by Types 2025 & 2033
- Figure 46: Middle East & Africa Pediatric Radiology Equipment Volume Share (%), by Types 2025 & 2033
- Figure 47: Middle East & Africa Pediatric Radiology Equipment Revenue (billion), by Country 2025 & 2033
- Figure 48: Middle East & Africa Pediatric Radiology Equipment Volume (K), by Country 2025 & 2033
- Figure 49: Middle East & Africa Pediatric Radiology Equipment Revenue Share (%), by Country 2025 & 2033
- Figure 50: Middle East & Africa Pediatric Radiology Equipment Volume Share (%), by Country 2025 & 2033
- Figure 51: Asia Pacific Pediatric Radiology Equipment Revenue (billion), by Application 2025 & 2033
- Figure 52: Asia Pacific Pediatric Radiology Equipment Volume (K), by Application 2025 & 2033
- Figure 53: Asia Pacific Pediatric Radiology Equipment Revenue Share (%), by Application 2025 & 2033
- Figure 54: Asia Pacific Pediatric Radiology Equipment Volume Share (%), by Application 2025 & 2033
- Figure 55: Asia Pacific Pediatric Radiology Equipment Revenue (billion), by Types 2025 & 2033
- Figure 56: Asia Pacific Pediatric Radiology Equipment Volume (K), by Types 2025 & 2033
- Figure 57: Asia Pacific Pediatric Radiology Equipment Revenue Share (%), by Types 2025 & 2033
- Figure 58: Asia Pacific Pediatric Radiology Equipment Volume Share (%), by Types 2025 & 2033
- Figure 59: Asia Pacific Pediatric Radiology Equipment Revenue (billion), by Country 2025 & 2033
- Figure 60: Asia Pacific Pediatric Radiology Equipment Volume (K), by Country 2025 & 2033
- Figure 61: Asia Pacific Pediatric Radiology Equipment Revenue Share (%), by Country 2025 & 2033
- Figure 62: Asia Pacific Pediatric Radiology Equipment Volume Share (%), by Country 2025 & 2033
List of Tables
- Table 1: Global Pediatric Radiology Equipment Revenue billion Forecast, by Application 2020 & 2033
- Table 2: Global Pediatric Radiology Equipment Volume K Forecast, by Application 2020 & 2033
- Table 3: Global Pediatric Radiology Equipment Revenue billion Forecast, by Types 2020 & 2033
- Table 4: Global Pediatric Radiology Equipment Volume K Forecast, by Types 2020 & 2033
- Table 5: Global Pediatric Radiology Equipment Revenue billion Forecast, by Region 2020 & 2033
- Table 6: Global Pediatric Radiology Equipment Volume K Forecast, by Region 2020 & 2033
- Table 7: Global Pediatric Radiology Equipment Revenue billion Forecast, by Application 2020 & 2033
- Table 8: Global Pediatric Radiology Equipment Volume K Forecast, by Application 2020 & 2033
- Table 9: Global Pediatric Radiology Equipment Revenue billion Forecast, by Types 2020 & 2033
- Table 10: Global Pediatric Radiology Equipment Volume K Forecast, by Types 2020 & 2033
- Table 11: Global Pediatric Radiology Equipment Revenue billion Forecast, by Country 2020 & 2033
- Table 12: Global Pediatric Radiology Equipment Volume K Forecast, by Country 2020 & 2033
- Table 13: United States Pediatric Radiology Equipment Revenue (billion) Forecast, by Application 2020 & 2033
- Table 14: United States Pediatric Radiology Equipment Volume (K) Forecast, by Application 2020 & 2033
- Table 15: Canada Pediatric Radiology Equipment Revenue (billion) Forecast, by Application 2020 & 2033
- Table 16: Canada Pediatric Radiology Equipment Volume (K) Forecast, by Application 2020 & 2033
- Table 17: Mexico Pediatric Radiology Equipment Revenue (billion) Forecast, by Application 2020 & 2033
- Table 18: Mexico Pediatric Radiology Equipment Volume (K) Forecast, by Application 2020 & 2033
- Table 19: Global Pediatric Radiology Equipment Revenue billion Forecast, by Application 2020 & 2033
- Table 20: Global Pediatric Radiology Equipment Volume K Forecast, by Application 2020 & 2033
- Table 21: Global Pediatric Radiology Equipment Revenue billion Forecast, by Types 2020 & 2033
- Table 22: Global Pediatric Radiology Equipment Volume K Forecast, by Types 2020 & 2033
- Table 23: Global Pediatric Radiology Equipment Revenue billion Forecast, by Country 2020 & 2033
- Table 24: Global Pediatric Radiology Equipment Volume K Forecast, by Country 2020 & 2033
- Table 25: Brazil Pediatric Radiology Equipment Revenue (billion) Forecast, by Application 2020 & 2033
- Table 26: Brazil Pediatric Radiology Equipment Volume (K) Forecast, by Application 2020 & 2033
- Table 27: Argentina Pediatric Radiology Equipment Revenue (billion) Forecast, by Application 2020 & 2033
- Table 28: Argentina Pediatric Radiology Equipment Volume (K) Forecast, by Application 2020 & 2033
- Table 29: Rest of South America Pediatric Radiology Equipment Revenue (billion) Forecast, by Application 2020 & 2033
- Table 30: Rest of South America Pediatric Radiology Equipment Volume (K) Forecast, by Application 2020 & 2033
- Table 31: Global Pediatric Radiology Equipment Revenue billion Forecast, by Application 2020 & 2033
- Table 32: Global Pediatric Radiology Equipment Volume K Forecast, by Application 2020 & 2033
- Table 33: Global Pediatric Radiology Equipment Revenue billion Forecast, by Types 2020 & 2033
- Table 34: Global Pediatric Radiology Equipment Volume K Forecast, by Types 2020 & 2033
- Table 35: Global Pediatric Radiology Equipment Revenue billion Forecast, by Country 2020 & 2033
- Table 36: Global Pediatric Radiology Equipment Volume K Forecast, by Country 2020 & 2033
- Table 37: United Kingdom Pediatric Radiology Equipment Revenue (billion) Forecast, by Application 2020 & 2033
- Table 38: United Kingdom Pediatric Radiology Equipment Volume (K) Forecast, by Application 2020 & 2033
- Table 39: Germany Pediatric Radiology Equipment Revenue (billion) Forecast, by Application 2020 & 2033
- Table 40: Germany Pediatric Radiology Equipment Volume (K) Forecast, by Application 2020 & 2033
- Table 41: France Pediatric Radiology Equipment Revenue (billion) Forecast, by Application 2020 & 2033
- Table 42: France Pediatric Radiology Equipment Volume (K) Forecast, by Application 2020 & 2033
- Table 43: Italy Pediatric Radiology Equipment Revenue (billion) Forecast, by Application 2020 & 2033
- Table 44: Italy Pediatric Radiology Equipment Volume (K) Forecast, by Application 2020 & 2033
- Table 45: Spain Pediatric Radiology Equipment Revenue (billion) Forecast, by Application 2020 & 2033
- Table 46: Spain Pediatric Radiology Equipment Volume (K) Forecast, by Application 2020 & 2033
- Table 47: Russia Pediatric Radiology Equipment Revenue (billion) Forecast, by Application 2020 & 2033
- Table 48: Russia Pediatric Radiology Equipment Volume (K) Forecast, by Application 2020 & 2033
- Table 49: Benelux Pediatric Radiology Equipment Revenue (billion) Forecast, by Application 2020 & 2033
- Table 50: Benelux Pediatric Radiology Equipment Volume (K) Forecast, by Application 2020 & 2033
- Table 51: Nordics Pediatric Radiology Equipment Revenue (billion) Forecast, by Application 2020 & 2033
- Table 52: Nordics Pediatric Radiology Equipment Volume (K) Forecast, by Application 2020 & 2033
- Table 53: Rest of Europe Pediatric Radiology Equipment Revenue (billion) Forecast, by Application 2020 & 2033
- Table 54: Rest of Europe Pediatric Radiology Equipment Volume (K) Forecast, by Application 2020 & 2033
- Table 55: Global Pediatric Radiology Equipment Revenue billion Forecast, by Application 2020 & 2033
- Table 56: Global Pediatric Radiology Equipment Volume K Forecast, by Application 2020 & 2033
- Table 57: Global Pediatric Radiology Equipment Revenue billion Forecast, by Types 2020 & 2033
- Table 58: Global Pediatric Radiology Equipment Volume K Forecast, by Types 2020 & 2033
- Table 59: Global Pediatric Radiology Equipment Revenue billion Forecast, by Country 2020 & 2033
- Table 60: Global Pediatric Radiology Equipment Volume K Forecast, by Country 2020 & 2033
- Table 61: Turkey Pediatric Radiology Equipment Revenue (billion) Forecast, by Application 2020 & 2033
- Table 62: Turkey Pediatric Radiology Equipment Volume (K) Forecast, by Application 2020 & 2033
- Table 63: Israel Pediatric Radiology Equipment Revenue (billion) Forecast, by Application 2020 & 2033
- Table 64: Israel Pediatric Radiology Equipment Volume (K) Forecast, by Application 2020 & 2033
- Table 65: GCC Pediatric Radiology Equipment Revenue (billion) Forecast, by Application 2020 & 2033
- Table 66: GCC Pediatric Radiology Equipment Volume (K) Forecast, by Application 2020 & 2033
- Table 67: North Africa Pediatric Radiology Equipment Revenue (billion) Forecast, by Application 2020 & 2033
- Table 68: North Africa Pediatric Radiology Equipment Volume (K) Forecast, by Application 2020 & 2033
- Table 69: South Africa Pediatric Radiology Equipment Revenue (billion) Forecast, by Application 2020 & 2033
- Table 70: South Africa Pediatric Radiology Equipment Volume (K) Forecast, by Application 2020 & 2033
- Table 71: Rest of Middle East & Africa Pediatric Radiology Equipment Revenue (billion) Forecast, by Application 2020 & 2033
- Table 72: Rest of Middle East & Africa Pediatric Radiology Equipment Volume (K) Forecast, by Application 2020 & 2033
- Table 73: Global Pediatric Radiology Equipment Revenue billion Forecast, by Application 2020 & 2033
- Table 74: Global Pediatric Radiology Equipment Volume K Forecast, by Application 2020 & 2033
- Table 75: Global Pediatric Radiology Equipment Revenue billion Forecast, by Types 2020 & 2033
- Table 76: Global Pediatric Radiology Equipment Volume K Forecast, by Types 2020 & 2033
- Table 77: Global Pediatric Radiology Equipment Revenue billion Forecast, by Country 2020 & 2033
- Table 78: Global Pediatric Radiology Equipment Volume K Forecast, by Country 2020 & 2033
- Table 79: China Pediatric Radiology Equipment Revenue (billion) Forecast, by Application 2020 & 2033
- Table 80: China Pediatric Radiology Equipment Volume (K) Forecast, by Application 2020 & 2033
- Table 81: India Pediatric Radiology Equipment Revenue (billion) Forecast, by Application 2020 & 2033
- Table 82: India Pediatric Radiology Equipment Volume (K) Forecast, by Application 2020 & 2033
- Table 83: Japan Pediatric Radiology Equipment Revenue (billion) Forecast, by Application 2020 & 2033
- Table 84: Japan Pediatric Radiology Equipment Volume (K) Forecast, by Application 2020 & 2033
- Table 85: South Korea Pediatric Radiology Equipment Revenue (billion) Forecast, by Application 2020 & 2033
- Table 86: South Korea Pediatric Radiology Equipment Volume (K) Forecast, by Application 2020 & 2033
- Table 87: ASEAN Pediatric Radiology Equipment Revenue (billion) Forecast, by Application 2020 & 2033
- Table 88: ASEAN Pediatric Radiology Equipment Volume (K) Forecast, by Application 2020 & 2033
- Table 89: Oceania Pediatric Radiology Equipment Revenue (billion) Forecast, by Application 2020 & 2033
- Table 90: Oceania Pediatric Radiology Equipment Volume (K) Forecast, by Application 2020 & 2033
- Table 91: Rest of Asia Pacific Pediatric Radiology Equipment Revenue (billion) Forecast, by Application 2020 & 2033
- Table 92: Rest of Asia Pacific Pediatric Radiology Equipment Volume (K) Forecast, by Application 2020 & 2033
Frequently Asked Questions
1. What is the projected Compound Annual Growth Rate (CAGR) of the Pediatric Radiology Equipment?
The projected CAGR is approximately 4.5%.
2. Which companies are prominent players in the Pediatric Radiology Equipment?
Key companies in the market include GE Healthcare, Siemens Healthineers, Koninklijke Philips N.V. (Royal Philips), Fujifilm Holdings Corporation, Canon Medical Systems, Samsung Electronics Co., Ltd., Agfa Healthcare, Carestream Health, Inc., Hitachi Healthcare, Medtronic.
3. What are the main segments of the Pediatric Radiology Equipment?
The market segments include Application, Types.
4. Can you provide details about the market size?
The market size is estimated to be USD 7.3 billion as of 2022.
5. What are some drivers contributing to market growth?
N/A
6. What are the notable trends driving market growth?
N/A
7. Are there any restraints impacting market growth?
N/A
8. Can you provide examples of recent developments in the market?
N/A
9. What pricing options are available for accessing the report?
Pricing options include single-user, multi-user, and enterprise licenses priced at USD 3350.00, USD 5025.00, and USD 6700.00 respectively.
10. Is the market size provided in terms of value or volume?
The market size is provided in terms of value, measured in billion and volume, measured in K.
11. Are there any specific market keywords associated with the report?
Yes, the market keyword associated with the report is "Pediatric Radiology Equipment," which aids in identifying and referencing the specific market segment covered.
12. How do I determine which pricing option suits my needs best?
The pricing options vary based on user requirements and access needs. Individual users may opt for single-user licenses, while businesses requiring broader access may choose multi-user or enterprise licenses for cost-effective access to the report.
13. Are there any additional resources or data provided in the Pediatric Radiology Equipment report?
While the report offers comprehensive insights, it's advisable to review the specific contents or supplementary materials provided to ascertain if additional resources or data are available.
14. How can I stay updated on further developments or reports in the Pediatric Radiology Equipment?
To stay informed about further developments, trends, and reports in the Pediatric Radiology Equipment, consider subscribing to industry newsletters, following relevant companies and organizations, or regularly checking reputable industry news sources and publications.
Methodology
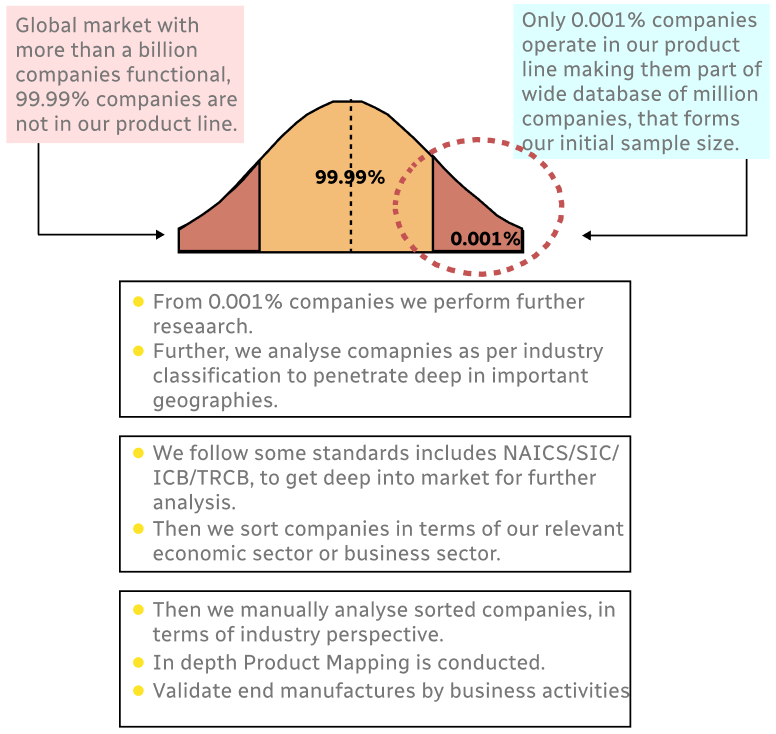
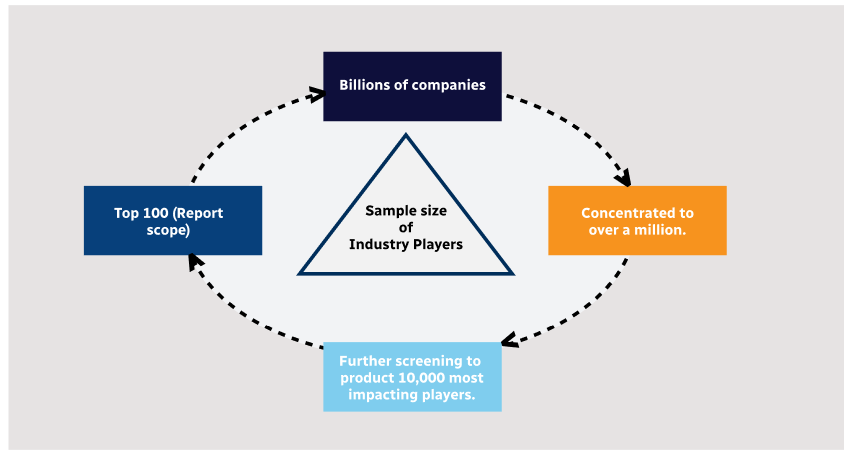
Step 1 - Identification of Relevant Samples Size from Population Database
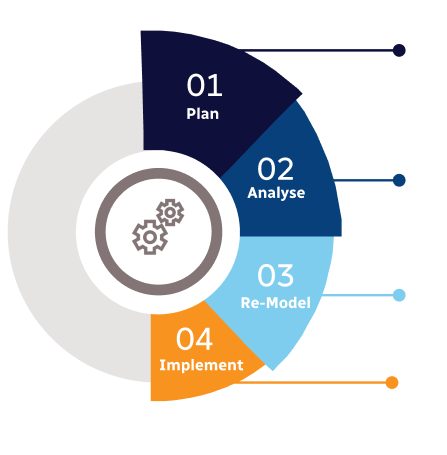
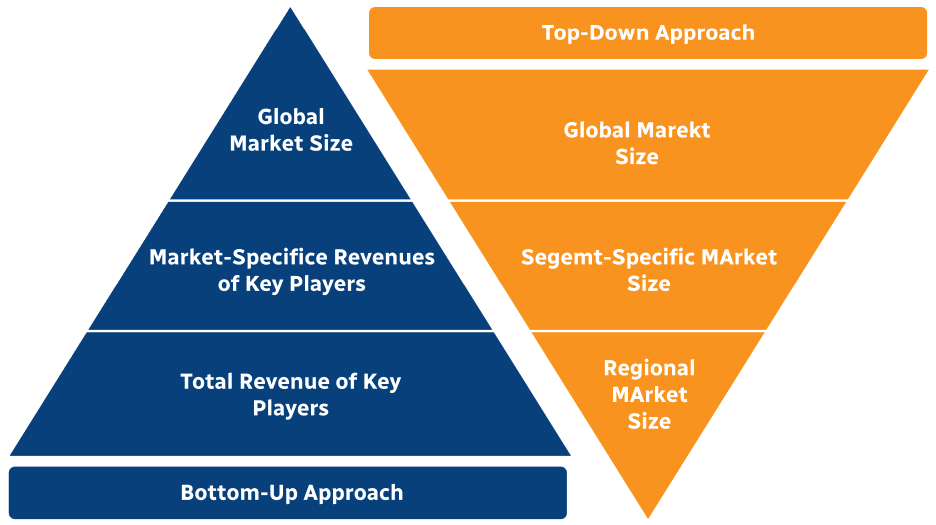
Step 2 - Approaches for Defining Global Market Size (Value, Volume* & Price*)
Note*: In applicable scenarios
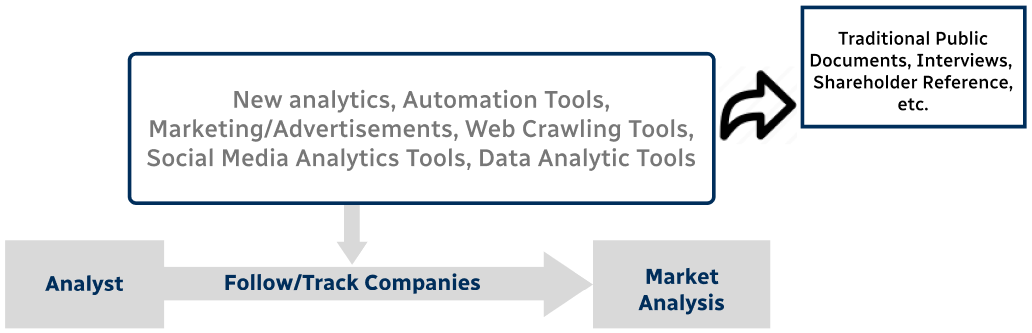
Step 3 - Data Sources
Primary Research
- Web Analytics
- Survey Reports
- Research Institute
- Latest Research Reports
- Opinion Leaders
Secondary Research
- Annual Reports
- White Paper
- Latest Press Release
- Industry Association
- Paid Database
- Investor Presentations
Step 4 - Data Triangulation
Involves using different sources of information in order to increase the validity of a study
These sources are likely to be stakeholders in a program - participants, other researchers, program staff, other community members, and so on.
Then we put all data in single framework & apply various statistical tools to find out the dynamic on the market.
During the analysis stage, feedback from the stakeholder groups would be compared to determine areas of agreement as well as areas of divergence