

Key Insights
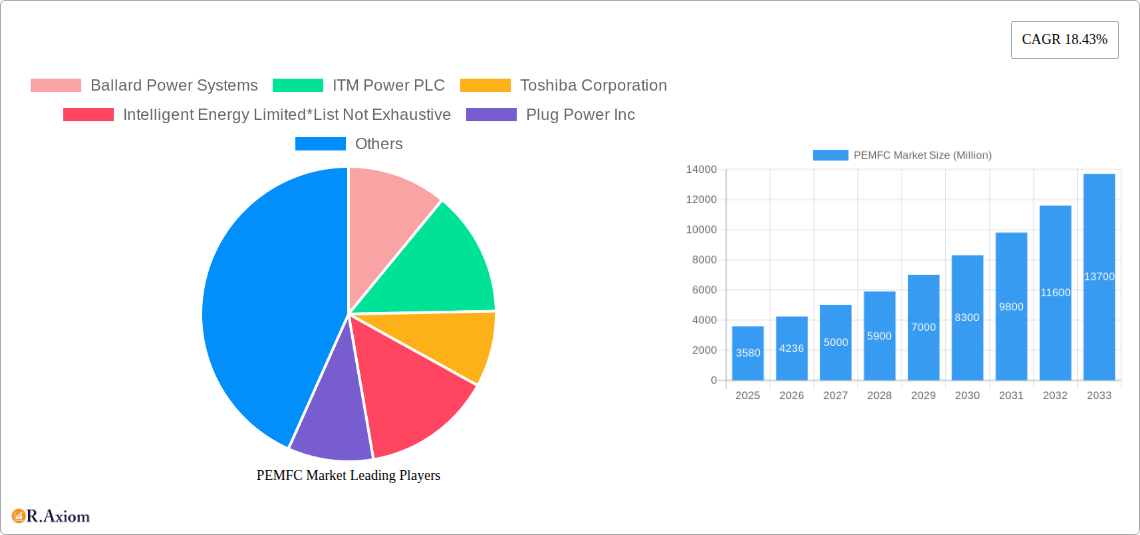
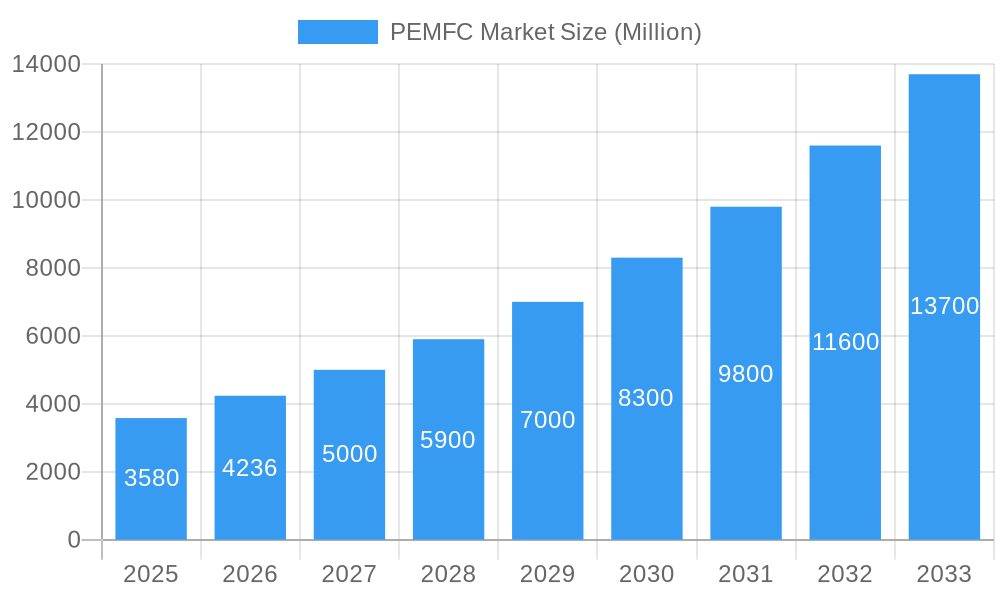
The Polymer Electrolyte Membrane Fuel Cell (PEMFC) market is experiencing robust growth, projected to reach \$3.58 billion by 2025 and exhibiting a Compound Annual Growth Rate (CAGR) of 18.43% from 2025 to 2033. This expansion is driven by increasing demand for clean energy solutions across various sectors, particularly transportation and stationary power generation. The automotive industry's push towards zero-emission vehicles is a key factor, with PEMFCs offering a compelling alternative to battery-electric vehicles, especially for heavy-duty applications like buses and forklifts. Furthermore, the growing adoption of PEMFCs in residential and commercial buildings, fueled by government incentives and rising energy costs, contributes significantly to market growth. Technological advancements, such as the development of high-temperature PEMFCs improving efficiency and durability, are further accelerating market expansion. The market is segmented by fuel type (primarily hydrogen and methanol), installation type (on-board and off-board), and end-user application (spanning transportation, stationary power, and portable power sectors). While challenges remain, including the high initial cost of PEMFC systems and the need for a robust hydrogen infrastructure, the long-term outlook for the PEMFC market remains exceptionally positive.
PEMFC Market Market Size (In Billion)
The competitive landscape is marked by established players like Ballard Power Systems, Plug Power Inc., and Toshiba Corporation, alongside emerging companies focused on innovation and cost reduction. Geographic growth is anticipated across all regions, with North America and Europe leading the initial charge due to established regulatory frameworks and consumer awareness. However, the Asia-Pacific region is poised for significant growth, driven by substantial investments in renewable energy infrastructure and a rapidly expanding automotive industry. The market’s continued expansion will depend on overcoming hurdles related to hydrogen production and storage costs, as well as the development of more efficient and cost-effective PEMFC technologies. Further government support and advancements in fuel cell technology are expected to propel this market towards significant expansion in the coming years.
PEMFC Market Company Market Share
This detailed report provides a comprehensive analysis of the PEMFC market, encompassing market size, segmentation, growth drivers, challenges, and key players. The study period covers 2019-2033, with 2025 as the base and estimated year. This report is crucial for stakeholders seeking actionable insights into this rapidly evolving sector.
PEMFC Market Market Concentration & Innovation
The PEMFC market exhibits a moderately concentrated landscape, with several key players holding significant market share. However, the presence of numerous smaller innovative companies indicates a dynamic competitive environment. Market share data for 2024 indicates Ballard Power Systems holds approximately 15%, Plug Power Inc. holds approximately 12%, and ITM Power PLC holds approximately 8% of the market, with the remaining share distributed among other players including Toshiba Corporation, Intelligent Energy Limited, Powercell Sweden AB, Bramble Energy, Cummins Inc., Bloom Energy, and Hydrogenics (a Cummins Inc. company). Innovation is driven by advancements in fuel cell technology, including improvements in efficiency, durability, and cost reduction. Stringent environmental regulations globally are further pushing innovation. The regulatory framework varies across regions, impacting market growth and investment. Product substitutes, primarily batteries and internal combustion engines, pose a challenge, but the advantages of PEMFCs in terms of energy density and refueling time are key differentiators. End-user trends reveal a growing preference for cleaner energy solutions across sectors, particularly in transportation and stationary power generation. Mergers and acquisitions (M&A) activity has been significant, with deal values exceeding xx Million in the last five years, primarily focused on consolidating market share and acquiring innovative technologies. Examples include the acquisition of Hydrogenics by Cummins Inc., which significantly expanded Cummins' presence in the fuel cell market.
PEMFC Market Industry Trends & Insights
The Polymer Electrolyte Membrane Fuel Cell (PEMFC) market is experiencing a period of dynamic expansion, fueled by the escalating global imperative for clean energy solutions and the increasing integration of fuel cell technology across a spectrum of industries. Projections indicate a robust Compound Annual Growth Rate (CAGR) of approximately [Insert Projected CAGR]% from 2025 to 2033, culminating in an estimated market valuation of [Insert Market Size] Million by 2033. This significant upward trajectory is primarily attributed to continuous technological breakthroughs that are yielding enhanced operational efficiency and substantial cost reductions. Consumer sentiment is demonstrably shifting towards environmentally sustainable energy alternatives, thereby creating a powerful market demand. The competitive arena is characterized by intense rivalry, with both established industry titans and innovative emerging enterprises actively pursuing market dominance. Furthermore, supportive government initiatives, including direct subsidies and attractive tax credits, are playing a pivotal role in accelerating market penetration. Nevertheless, the market must address persistent challenges such as the considerable initial investment outlay, the present limitations in widespread hydrogen infrastructure, and the ongoing need for advancements in fuel cell durability and longevity. While the automotive sector is witnessing a steady increase in adoption, the domain of stationary power generation presents a particularly compelling growth avenue. The development of high-temperature PEMFCs represents a particularly promising technological disruption, with the potential to unlock further improvements in performance and cost-effectiveness.
Dominant Markets & Segments in PEMFC Market
-
Leading Region: North America currently holds the leading position, bolstered by substantial government backing, a well-established hydrogen infrastructure, and the significant presence of major industry players. The Asia-Pacific region is anticipated to witness accelerated growth throughout the forecast period, driven by escalating investments in renewable energy sources and forward-thinking government policies. Europe also represents a critical market, influenced by increasingly stringent environmental regulations and the European Union's committed efforts towards a hydrogen-based energy future.
-
Dominant Segments:
- Type of Fuel Cell: Polymer Electrolyte Membrane Fuel Cells (PEMFCs) command a significant market share due to their superior efficiency, lower operating temperatures, and versatility across diverse applications. Direct Methanol Fuel Cells (DMFCs) constitute a more specialized segment with a smaller market footprint.
- End-User Application: The transportation sector, encompassing passenger vehicles, buses, and forklifts, represents a primary growth driver. Stationary power generation, including residential, commercial, and industrial applications, is also exhibiting robust expansion. Portable power and consumer electronics, while currently smaller segments, demonstrate considerable untapped potential.
- Technology: While low-temperature PEMFCs currently dominate the market, high-temperature PEMFCs are steadily gaining traction, promising enhanced efficiency and reduced operational costs.
- Installation Type: On-board fuel cell systems are predominantly utilized in transportation applications, whereas off-board fuel cell configurations are more commonly employed in stationary power generation setups.
- Fuel Type: Hydrogen remains the predominant fuel source for PEMFCs. Methanol and other alternative fuel sources currently occupy a smaller, albeit evolving, market segment.
Key factors underpinning the dominance of specific segments include the availability of supportive government policies (such as tax incentives for fuel cell vehicles), the progressive expansion of essential infrastructure (like hydrogen refueling stations), and the impact of technological advancements on cost reduction.
PEMFC Market Product Developments
Recent years have witnessed significant advancements in PEMFC technology, focusing on enhancing efficiency, durability, and reducing costs. New materials and designs have led to smaller, lighter, and more powerful fuel cells. Integration of PEMFCs with other renewable energy sources like solar and wind power is gaining traction, offering hybrid solutions for various applications. The development of high-temperature PEMFCs offers substantial potential for improved performance and cost reduction. These advancements are enhancing the market fit of PEMFCs across a wider range of applications.
Report Scope & Segmentation Analysis
This report provides a comprehensive analysis of the PEMFC market, segmented by type of fuel cell (PEMFC, DMFC), end-user application (transportation, stationary power generation, portable power), technology (high-temperature, low-temperature PEMFC), installation type (on-board, off-board), and fuel type (hydrogen, methanol, others). Each segment's growth projections, market size (in Millions), and competitive dynamics are thoroughly analyzed. For example, the transportation segment is projected to experience significant growth due to increasing demand for fuel-efficient and environmentally friendly vehicles, while the stationary power generation segment is expected to witness substantial expansion driven by the need for reliable and clean energy sources. Market size projections for each segment are detailed within the full report.
Key Drivers of PEMFC Market Growth
The PEMFC market's growth is fueled by several key factors:
- Stringent environmental regulations: Governments worldwide are imposing stricter emission norms, driving the adoption of cleaner energy solutions like PEMFCs.
- Increasing demand for clean energy: Growing awareness about climate change and the need for sustainable energy are boosting demand for PEMFCs across various sectors.
- Technological advancements: Continuous improvements in PEMFC technology, such as enhanced efficiency and reduced costs, are making them more attractive and commercially viable.
- Government incentives: Subsidies and tax credits offered by many governments are stimulating market growth and investment.
Challenges in the PEMFC Market Sector
The PEMFC market is navigating several key challenges that are influencing its growth and widespread adoption:
- High Initial Investment Costs: The substantial upfront expenditure associated with PEMFC systems can pose a significant barrier to entry for potential adopters, particularly in emerging economies and for smaller-scale applications.
- Limited Hydrogen Infrastructure: The current scarcity and uneven distribution of hydrogen refueling stations present a critical bottleneck for the widespread integration of PEMFCs, especially within the transportation sector.
- Durability and Lifespan Improvements: Enhancing the long-term operational durability and extending the overall lifespan of PEMFC stacks are crucial areas of focus to ensure their competitiveness and reliability for diverse, long-term applications.
- Competition from Alternative Technologies: PEMFCs face strong competition from other established and rapidly evolving energy storage and generation solutions, most notably advanced battery technologies, which offer different performance characteristics and cost profiles.
Emerging Opportunities in PEMFC Market
Emerging opportunities for PEMFCs include:
- Expanding into new markets: Emerging economies in Asia and Africa present significant potential for PEMFC growth.
- Developing hybrid systems: Integrating PEMFCs with other renewable energy technologies can create versatile and efficient energy solutions.
- Exploring new applications: PEMFCs are finding applications in niche areas like drones and portable power devices.
- Technological advancements: Continued innovation in materials and manufacturing processes can reduce costs and improve performance.
Leading Players in the PEMFC Market Market
- Ballard Power Systems
- ITM Power PLC
- Toshiba Corporation
- Intelligent Energy Limited
- Plug Power Inc.
- Powercell Sweden AB
- Bramble Energy
- Cummins Inc.
- Bloom Energy
- Hydrogenics (a Cummins Inc. company)
Key Developments in PEMFC Market Industry
- October 2021: Panasonic Corporation announced the development of a pure hydrogen fuel cell generator.
- April 2022: SFC Energy and FC TecNrgy partnered to manufacture methanol and hydrogen fuel cells in India, launching the EFOY hydrogen fuel cell.
- August 2022: NREL and Toyota collaborated on a 1-megawatt PEM fuel cell power generation system.
Strategic Outlook for PEMFC Market Market
The PEMFC market is poised for substantial growth, propelled by the global transition towards cleaner energy sources and the continuous stream of technological innovations. Sustained investment in research and development, coupled with proactive government policies and the strategic expansion of hydrogen infrastructure, will be instrumental in unlocking the full market potential of this sector. An intensified focus on enhancing fuel cell efficiency, improving long-term durability, and achieving further cost reductions will drive deeper market penetration across a wider array of applications. The emergence of novel applications, alongside the integration of PEMFCs into hybrid energy systems, is expected to further accelerate market expansion in the foreseeable future.
PEMFC Market Segmentation
- 1. Production Analysis
- 2. Consumption Analysis
- 3. Import Market Analysis (Value & Volume)
- 4. Export Market Analysis (Value & Volume)
- 5. Price Trend Analysis
PEMFC Market Segmentation By Geography
- 1. North America
- 2. Europe
- 3. Asia Pacific
- 4. Rest of the World
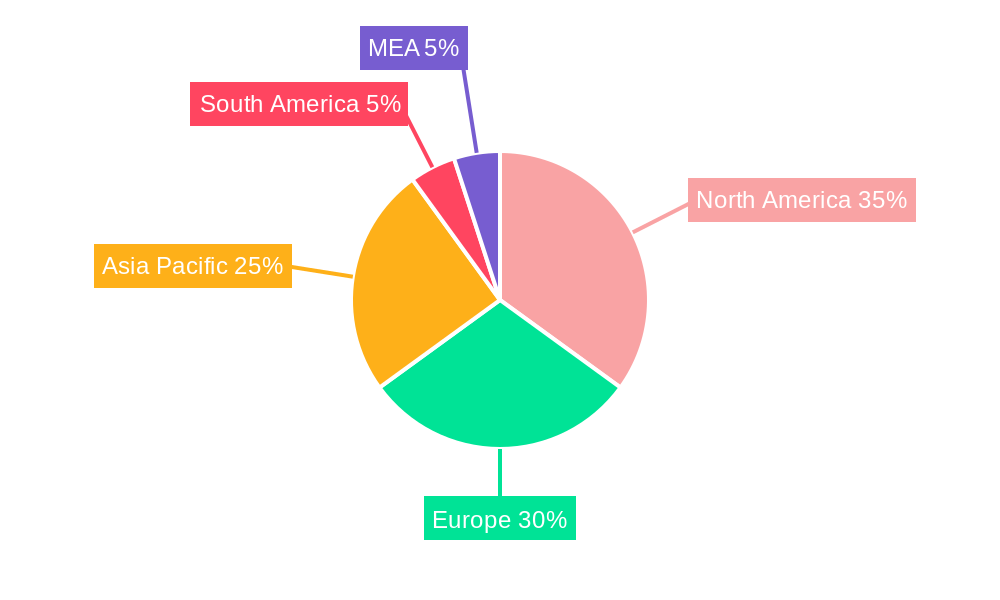
PEMFC Market Regional Market Share
Geographic Coverage of PEMFC Market
PEMFC Market REPORT HIGHLIGHTS
| Aspects | Details |
|---|---|
| Study Period | 2020-2034 |
| Base Year | 2025 |
| Estimated Year | 2026 |
| Forecast Period | 2026-2034 |
| Historical Period | 2020-2025 |
| Growth Rate | CAGR of 18.43% from 2020-2034 |
| Segmentation |
|
Table of Contents
- 1. Introduction
- 1.1. Research Scope
- 1.2. Market Segmentation
- 1.3. Research Objective
- 1.4. Definitions and Assumptions
- 2. Executive Summary
- 2.1. Market Snapshot
- 3. Market Dynamics
- 3.1. Market Drivers
- 3.2. Market Restrains
- 3.3. Market Trends
- 3.4. Market Opportunities
- 4. Market Factor Analysis
- 4.1. Porters Five Forces
- 4.1.1. Bargaining Power of Suppliers
- 4.1.2. Bargaining Power of Buyers
- 4.1.3. Threat of New Entrants
- 4.1.4. Threat of Substitutes
- 4.1.5. Competitive Rivalry
- 4.2. PESTEL analysis
- 4.3. BCG Analysis
- 4.3.1. Stars (High Growth, High Market Share)
- 4.3.2. Cash Cows (Low Growth, High Market Share)
- 4.3.3. Question Mark (High Growth, Low Market Share)
- 4.3.4. Dogs (Low Growth, Low Market Share)
- 4.4. Ansoff Matrix Analysis
- 4.5. Supply Chain Analysis
- 4.6. Regulatory Landscape
- 4.7. Current Market Potential and Opportunity Assessment (TAM–SAM–SOM Framework)
- 4.8. RAX Analyst Note
- 4.1. Porters Five Forces
- 5. Market Analysis, Insights and Forecast 2021-2033
- 5.1. Market Analysis, Insights and Forecast - by Production Analysis
- 5.2. Market Analysis, Insights and Forecast - by Consumption Analysis
- 5.3. Market Analysis, Insights and Forecast - by Import Market Analysis (Value & Volume)
- 5.4. Market Analysis, Insights and Forecast - by Export Market Analysis (Value & Volume)
- 5.5. Market Analysis, Insights and Forecast - by Price Trend Analysis
- 5.6. Market Analysis, Insights and Forecast - by Region
- 5.6.1. North America
- 5.6.2. Europe
- 5.6.3. Asia Pacific
- 5.6.4. Rest of the World
- 6. Global PEMFC Market Analysis, Insights and Forecast, 2021-2033
- 6.1. Market Analysis, Insights and Forecast - by Production Analysis
- 6.2. Market Analysis, Insights and Forecast - by Consumption Analysis
- 6.3. Market Analysis, Insights and Forecast - by Import Market Analysis (Value & Volume)
- 6.4. Market Analysis, Insights and Forecast - by Export Market Analysis (Value & Volume)
- 6.5. Market Analysis, Insights and Forecast - by Price Trend Analysis
- 7. North America PEMFC Market Analysis, Insights and Forecast, 2020-2032
- 7.1. Market Analysis, Insights and Forecast - by Production Analysis
- 7.2. Market Analysis, Insights and Forecast - by Consumption Analysis
- 7.3. Market Analysis, Insights and Forecast - by Import Market Analysis (Value & Volume)
- 7.4. Market Analysis, Insights and Forecast - by Export Market Analysis (Value & Volume)
- 7.5. Market Analysis, Insights and Forecast - by Price Trend Analysis
- 8. Europe PEMFC Market Analysis, Insights and Forecast, 2020-2032
- 8.1. Market Analysis, Insights and Forecast - by Production Analysis
- 8.2. Market Analysis, Insights and Forecast - by Consumption Analysis
- 8.3. Market Analysis, Insights and Forecast - by Import Market Analysis (Value & Volume)
- 8.4. Market Analysis, Insights and Forecast - by Export Market Analysis (Value & Volume)
- 8.5. Market Analysis, Insights and Forecast - by Price Trend Analysis
- 9. Asia Pacific PEMFC Market Analysis, Insights and Forecast, 2020-2032
- 9.1. Market Analysis, Insights and Forecast - by Production Analysis
- 9.2. Market Analysis, Insights and Forecast - by Consumption Analysis
- 9.3. Market Analysis, Insights and Forecast - by Import Market Analysis (Value & Volume)
- 9.4. Market Analysis, Insights and Forecast - by Export Market Analysis (Value & Volume)
- 9.5. Market Analysis, Insights and Forecast - by Price Trend Analysis
- 10. Rest of the World PEMFC Market Analysis, Insights and Forecast, 2020-2032
- 10.1. Market Analysis, Insights and Forecast - by Production Analysis
- 10.2. Market Analysis, Insights and Forecast - by Consumption Analysis
- 10.3. Market Analysis, Insights and Forecast - by Import Market Analysis (Value & Volume)
- 10.4. Market Analysis, Insights and Forecast - by Export Market Analysis (Value & Volume)
- 10.5. Market Analysis, Insights and Forecast - by Price Trend Analysis
- 11. Competitive Analysis
- 11.1. Company Profiles
- 11.1.1 Ballard Power Systems
- 11.1.1.1. Company Overview
- 11.1.1.2. Products
- 11.1.1.3. Company Financials
- 11.1.1.4. SWOT Analysis
- 11.1.2 ITM Power PLC
- 11.1.2.1. Company Overview
- 11.1.2.2. Products
- 11.1.2.3. Company Financials
- 11.1.2.4. SWOT Analysis
- 11.1.3 Toshiba Corporation
- 11.1.3.1. Company Overview
- 11.1.3.2. Products
- 11.1.3.3. Company Financials
- 11.1.3.4. SWOT Analysis
- 11.1.4 Intelligent Energy Limited*List Not Exhaustive
- 11.1.4.1. Company Overview
- 11.1.4.2. Products
- 11.1.4.3. Company Financials
- 11.1.4.4. SWOT Analysis
- 11.1.5 Plug Power Inc
- 11.1.5.1. Company Overview
- 11.1.5.2. Products
- 11.1.5.3. Company Financials
- 11.1.5.4. SWOT Analysis
- 11.1.6 Powercell Sweden AB
- 11.1.6.1. Company Overview
- 11.1.6.2. Products
- 11.1.6.3. Company Financials
- 11.1.6.4. SWOT Analysis
- 11.1.7 Bramble Energy
- 11.1.7.1. Company Overview
- 11.1.7.2. Products
- 11.1.7.3. Company Financials
- 11.1.7.4. SWOT Analysis
- 11.1.8 Cummins Inc
- 11.1.8.1. Company Overview
- 11.1.8.2. Products
- 11.1.8.3. Company Financials
- 11.1.8.4. SWOT Analysis
- 11.1.9 Bloom Energy
- 11.1.9.1. Company Overview
- 11.1.9.2. Products
- 11.1.9.3. Company Financials
- 11.1.9.4. SWOT Analysis
- 11.1.10 Hydrogenics (a Cummins Inc. company)
- 11.1.10.1. Company Overview
- 11.1.10.2. Products
- 11.1.10.3. Company Financials
- 11.1.10.4. SWOT Analysis
- 11.1.1 Ballard Power Systems
- 11.2. Market Entropy
- 11.2.1 Company's Key Areas Served
- 11.2.2 Recent Developments
- 11.3. Company Market Share Analysis 2025
- 11.3.1 Top 5 Companies Market Share Analysis
- 11.3.2 Top 3 Companies Market Share Analysis
- 11.4. List of Potential Customers
- 12. Research Methodology
List of Figures
- Figure 1: Global PEMFC Market Revenue Breakdown (Million, %) by Region 2025 & 2033
- Figure 2: Global PEMFC Market Volume Breakdown (Gigawatt, %) by Region 2025 & 2033
- Figure 3: North America PEMFC Market Revenue (Million), by Production Analysis 2025 & 2033
- Figure 4: North America PEMFC Market Volume (Gigawatt), by Production Analysis 2025 & 2033
- Figure 5: North America PEMFC Market Revenue Share (%), by Production Analysis 2025 & 2033
- Figure 6: North America PEMFC Market Volume Share (%), by Production Analysis 2025 & 2033
- Figure 7: North America PEMFC Market Revenue (Million), by Consumption Analysis 2025 & 2033
- Figure 8: North America PEMFC Market Volume (Gigawatt), by Consumption Analysis 2025 & 2033
- Figure 9: North America PEMFC Market Revenue Share (%), by Consumption Analysis 2025 & 2033
- Figure 10: North America PEMFC Market Volume Share (%), by Consumption Analysis 2025 & 2033
- Figure 11: North America PEMFC Market Revenue (Million), by Import Market Analysis (Value & Volume) 2025 & 2033
- Figure 12: North America PEMFC Market Volume (Gigawatt), by Import Market Analysis (Value & Volume) 2025 & 2033
- Figure 13: North America PEMFC Market Revenue Share (%), by Import Market Analysis (Value & Volume) 2025 & 2033
- Figure 14: North America PEMFC Market Volume Share (%), by Import Market Analysis (Value & Volume) 2025 & 2033
- Figure 15: North America PEMFC Market Revenue (Million), by Export Market Analysis (Value & Volume) 2025 & 2033
- Figure 16: North America PEMFC Market Volume (Gigawatt), by Export Market Analysis (Value & Volume) 2025 & 2033
- Figure 17: North America PEMFC Market Revenue Share (%), by Export Market Analysis (Value & Volume) 2025 & 2033
- Figure 18: North America PEMFC Market Volume Share (%), by Export Market Analysis (Value & Volume) 2025 & 2033
- Figure 19: North America PEMFC Market Revenue (Million), by Price Trend Analysis 2025 & 2033
- Figure 20: North America PEMFC Market Volume (Gigawatt), by Price Trend Analysis 2025 & 2033
- Figure 21: North America PEMFC Market Revenue Share (%), by Price Trend Analysis 2025 & 2033
- Figure 22: North America PEMFC Market Volume Share (%), by Price Trend Analysis 2025 & 2033
- Figure 23: North America PEMFC Market Revenue (Million), by Country 2025 & 2033
- Figure 24: North America PEMFC Market Volume (Gigawatt), by Country 2025 & 2033
- Figure 25: North America PEMFC Market Revenue Share (%), by Country 2025 & 2033
- Figure 26: North America PEMFC Market Volume Share (%), by Country 2025 & 2033
- Figure 27: Europe PEMFC Market Revenue (Million), by Production Analysis 2025 & 2033
- Figure 28: Europe PEMFC Market Volume (Gigawatt), by Production Analysis 2025 & 2033
- Figure 29: Europe PEMFC Market Revenue Share (%), by Production Analysis 2025 & 2033
- Figure 30: Europe PEMFC Market Volume Share (%), by Production Analysis 2025 & 2033
- Figure 31: Europe PEMFC Market Revenue (Million), by Consumption Analysis 2025 & 2033
- Figure 32: Europe PEMFC Market Volume (Gigawatt), by Consumption Analysis 2025 & 2033
- Figure 33: Europe PEMFC Market Revenue Share (%), by Consumption Analysis 2025 & 2033
- Figure 34: Europe PEMFC Market Volume Share (%), by Consumption Analysis 2025 & 2033
- Figure 35: Europe PEMFC Market Revenue (Million), by Import Market Analysis (Value & Volume) 2025 & 2033
- Figure 36: Europe PEMFC Market Volume (Gigawatt), by Import Market Analysis (Value & Volume) 2025 & 2033
- Figure 37: Europe PEMFC Market Revenue Share (%), by Import Market Analysis (Value & Volume) 2025 & 2033
- Figure 38: Europe PEMFC Market Volume Share (%), by Import Market Analysis (Value & Volume) 2025 & 2033
- Figure 39: Europe PEMFC Market Revenue (Million), by Export Market Analysis (Value & Volume) 2025 & 2033
- Figure 40: Europe PEMFC Market Volume (Gigawatt), by Export Market Analysis (Value & Volume) 2025 & 2033
- Figure 41: Europe PEMFC Market Revenue Share (%), by Export Market Analysis (Value & Volume) 2025 & 2033
- Figure 42: Europe PEMFC Market Volume Share (%), by Export Market Analysis (Value & Volume) 2025 & 2033
- Figure 43: Europe PEMFC Market Revenue (Million), by Price Trend Analysis 2025 & 2033
- Figure 44: Europe PEMFC Market Volume (Gigawatt), by Price Trend Analysis 2025 & 2033
- Figure 45: Europe PEMFC Market Revenue Share (%), by Price Trend Analysis 2025 & 2033
- Figure 46: Europe PEMFC Market Volume Share (%), by Price Trend Analysis 2025 & 2033
- Figure 47: Europe PEMFC Market Revenue (Million), by Country 2025 & 2033
- Figure 48: Europe PEMFC Market Volume (Gigawatt), by Country 2025 & 2033
- Figure 49: Europe PEMFC Market Revenue Share (%), by Country 2025 & 2033
- Figure 50: Europe PEMFC Market Volume Share (%), by Country 2025 & 2033
- Figure 51: Asia Pacific PEMFC Market Revenue (Million), by Production Analysis 2025 & 2033
- Figure 52: Asia Pacific PEMFC Market Volume (Gigawatt), by Production Analysis 2025 & 2033
- Figure 53: Asia Pacific PEMFC Market Revenue Share (%), by Production Analysis 2025 & 2033
- Figure 54: Asia Pacific PEMFC Market Volume Share (%), by Production Analysis 2025 & 2033
- Figure 55: Asia Pacific PEMFC Market Revenue (Million), by Consumption Analysis 2025 & 2033
- Figure 56: Asia Pacific PEMFC Market Volume (Gigawatt), by Consumption Analysis 2025 & 2033
- Figure 57: Asia Pacific PEMFC Market Revenue Share (%), by Consumption Analysis 2025 & 2033
- Figure 58: Asia Pacific PEMFC Market Volume Share (%), by Consumption Analysis 2025 & 2033
- Figure 59: Asia Pacific PEMFC Market Revenue (Million), by Import Market Analysis (Value & Volume) 2025 & 2033
- Figure 60: Asia Pacific PEMFC Market Volume (Gigawatt), by Import Market Analysis (Value & Volume) 2025 & 2033
- Figure 61: Asia Pacific PEMFC Market Revenue Share (%), by Import Market Analysis (Value & Volume) 2025 & 2033
- Figure 62: Asia Pacific PEMFC Market Volume Share (%), by Import Market Analysis (Value & Volume) 2025 & 2033
- Figure 63: Asia Pacific PEMFC Market Revenue (Million), by Export Market Analysis (Value & Volume) 2025 & 2033
- Figure 64: Asia Pacific PEMFC Market Volume (Gigawatt), by Export Market Analysis (Value & Volume) 2025 & 2033
- Figure 65: Asia Pacific PEMFC Market Revenue Share (%), by Export Market Analysis (Value & Volume) 2025 & 2033
- Figure 66: Asia Pacific PEMFC Market Volume Share (%), by Export Market Analysis (Value & Volume) 2025 & 2033
- Figure 67: Asia Pacific PEMFC Market Revenue (Million), by Price Trend Analysis 2025 & 2033
- Figure 68: Asia Pacific PEMFC Market Volume (Gigawatt), by Price Trend Analysis 2025 & 2033
- Figure 69: Asia Pacific PEMFC Market Revenue Share (%), by Price Trend Analysis 2025 & 2033
- Figure 70: Asia Pacific PEMFC Market Volume Share (%), by Price Trend Analysis 2025 & 2033
- Figure 71: Asia Pacific PEMFC Market Revenue (Million), by Country 2025 & 2033
- Figure 72: Asia Pacific PEMFC Market Volume (Gigawatt), by Country 2025 & 2033
- Figure 73: Asia Pacific PEMFC Market Revenue Share (%), by Country 2025 & 2033
- Figure 74: Asia Pacific PEMFC Market Volume Share (%), by Country 2025 & 2033
- Figure 75: Rest of the World PEMFC Market Revenue (Million), by Production Analysis 2025 & 2033
- Figure 76: Rest of the World PEMFC Market Volume (Gigawatt), by Production Analysis 2025 & 2033
- Figure 77: Rest of the World PEMFC Market Revenue Share (%), by Production Analysis 2025 & 2033
- Figure 78: Rest of the World PEMFC Market Volume Share (%), by Production Analysis 2025 & 2033
- Figure 79: Rest of the World PEMFC Market Revenue (Million), by Consumption Analysis 2025 & 2033
- Figure 80: Rest of the World PEMFC Market Volume (Gigawatt), by Consumption Analysis 2025 & 2033
- Figure 81: Rest of the World PEMFC Market Revenue Share (%), by Consumption Analysis 2025 & 2033
- Figure 82: Rest of the World PEMFC Market Volume Share (%), by Consumption Analysis 2025 & 2033
- Figure 83: Rest of the World PEMFC Market Revenue (Million), by Import Market Analysis (Value & Volume) 2025 & 2033
- Figure 84: Rest of the World PEMFC Market Volume (Gigawatt), by Import Market Analysis (Value & Volume) 2025 & 2033
- Figure 85: Rest of the World PEMFC Market Revenue Share (%), by Import Market Analysis (Value & Volume) 2025 & 2033
- Figure 86: Rest of the World PEMFC Market Volume Share (%), by Import Market Analysis (Value & Volume) 2025 & 2033
- Figure 87: Rest of the World PEMFC Market Revenue (Million), by Export Market Analysis (Value & Volume) 2025 & 2033
- Figure 88: Rest of the World PEMFC Market Volume (Gigawatt), by Export Market Analysis (Value & Volume) 2025 & 2033
- Figure 89: Rest of the World PEMFC Market Revenue Share (%), by Export Market Analysis (Value & Volume) 2025 & 2033
- Figure 90: Rest of the World PEMFC Market Volume Share (%), by Export Market Analysis (Value & Volume) 2025 & 2033
- Figure 91: Rest of the World PEMFC Market Revenue (Million), by Price Trend Analysis 2025 & 2033
- Figure 92: Rest of the World PEMFC Market Volume (Gigawatt), by Price Trend Analysis 2025 & 2033
- Figure 93: Rest of the World PEMFC Market Revenue Share (%), by Price Trend Analysis 2025 & 2033
- Figure 94: Rest of the World PEMFC Market Volume Share (%), by Price Trend Analysis 2025 & 2033
- Figure 95: Rest of the World PEMFC Market Revenue (Million), by Country 2025 & 2033
- Figure 96: Rest of the World PEMFC Market Volume (Gigawatt), by Country 2025 & 2033
- Figure 97: Rest of the World PEMFC Market Revenue Share (%), by Country 2025 & 2033
- Figure 98: Rest of the World PEMFC Market Volume Share (%), by Country 2025 & 2033
List of Tables
- Table 1: Global PEMFC Market Revenue Million Forecast, by Production Analysis 2020 & 2033
- Table 2: Global PEMFC Market Volume Gigawatt Forecast, by Production Analysis 2020 & 2033
- Table 3: Global PEMFC Market Revenue Million Forecast, by Consumption Analysis 2020 & 2033
- Table 4: Global PEMFC Market Volume Gigawatt Forecast, by Consumption Analysis 2020 & 2033
- Table 5: Global PEMFC Market Revenue Million Forecast, by Import Market Analysis (Value & Volume) 2020 & 2033
- Table 6: Global PEMFC Market Volume Gigawatt Forecast, by Import Market Analysis (Value & Volume) 2020 & 2033
- Table 7: Global PEMFC Market Revenue Million Forecast, by Export Market Analysis (Value & Volume) 2020 & 2033
- Table 8: Global PEMFC Market Volume Gigawatt Forecast, by Export Market Analysis (Value & Volume) 2020 & 2033
- Table 9: Global PEMFC Market Revenue Million Forecast, by Price Trend Analysis 2020 & 2033
- Table 10: Global PEMFC Market Volume Gigawatt Forecast, by Price Trend Analysis 2020 & 2033
- Table 11: Global PEMFC Market Revenue Million Forecast, by Region 2020 & 2033
- Table 12: Global PEMFC Market Volume Gigawatt Forecast, by Region 2020 & 2033
- Table 13: Global PEMFC Market Revenue Million Forecast, by Production Analysis 2020 & 2033
- Table 14: Global PEMFC Market Volume Gigawatt Forecast, by Production Analysis 2020 & 2033
- Table 15: Global PEMFC Market Revenue Million Forecast, by Consumption Analysis 2020 & 2033
- Table 16: Global PEMFC Market Volume Gigawatt Forecast, by Consumption Analysis 2020 & 2033
- Table 17: Global PEMFC Market Revenue Million Forecast, by Import Market Analysis (Value & Volume) 2020 & 2033
- Table 18: Global PEMFC Market Volume Gigawatt Forecast, by Import Market Analysis (Value & Volume) 2020 & 2033
- Table 19: Global PEMFC Market Revenue Million Forecast, by Export Market Analysis (Value & Volume) 2020 & 2033
- Table 20: Global PEMFC Market Volume Gigawatt Forecast, by Export Market Analysis (Value & Volume) 2020 & 2033
- Table 21: Global PEMFC Market Revenue Million Forecast, by Price Trend Analysis 2020 & 2033
- Table 22: Global PEMFC Market Volume Gigawatt Forecast, by Price Trend Analysis 2020 & 2033
- Table 23: Global PEMFC Market Revenue Million Forecast, by Country 2020 & 2033
- Table 24: Global PEMFC Market Volume Gigawatt Forecast, by Country 2020 & 2033
- Table 25: Global PEMFC Market Revenue Million Forecast, by Production Analysis 2020 & 2033
- Table 26: Global PEMFC Market Volume Gigawatt Forecast, by Production Analysis 2020 & 2033
- Table 27: Global PEMFC Market Revenue Million Forecast, by Consumption Analysis 2020 & 2033
- Table 28: Global PEMFC Market Volume Gigawatt Forecast, by Consumption Analysis 2020 & 2033
- Table 29: Global PEMFC Market Revenue Million Forecast, by Import Market Analysis (Value & Volume) 2020 & 2033
- Table 30: Global PEMFC Market Volume Gigawatt Forecast, by Import Market Analysis (Value & Volume) 2020 & 2033
- Table 31: Global PEMFC Market Revenue Million Forecast, by Export Market Analysis (Value & Volume) 2020 & 2033
- Table 32: Global PEMFC Market Volume Gigawatt Forecast, by Export Market Analysis (Value & Volume) 2020 & 2033
- Table 33: Global PEMFC Market Revenue Million Forecast, by Price Trend Analysis 2020 & 2033
- Table 34: Global PEMFC Market Volume Gigawatt Forecast, by Price Trend Analysis 2020 & 2033
- Table 35: Global PEMFC Market Revenue Million Forecast, by Country 2020 & 2033
- Table 36: Global PEMFC Market Volume Gigawatt Forecast, by Country 2020 & 2033
- Table 37: Global PEMFC Market Revenue Million Forecast, by Production Analysis 2020 & 2033
- Table 38: Global PEMFC Market Volume Gigawatt Forecast, by Production Analysis 2020 & 2033
- Table 39: Global PEMFC Market Revenue Million Forecast, by Consumption Analysis 2020 & 2033
- Table 40: Global PEMFC Market Volume Gigawatt Forecast, by Consumption Analysis 2020 & 2033
- Table 41: Global PEMFC Market Revenue Million Forecast, by Import Market Analysis (Value & Volume) 2020 & 2033
- Table 42: Global PEMFC Market Volume Gigawatt Forecast, by Import Market Analysis (Value & Volume) 2020 & 2033
- Table 43: Global PEMFC Market Revenue Million Forecast, by Export Market Analysis (Value & Volume) 2020 & 2033
- Table 44: Global PEMFC Market Volume Gigawatt Forecast, by Export Market Analysis (Value & Volume) 2020 & 2033
- Table 45: Global PEMFC Market Revenue Million Forecast, by Price Trend Analysis 2020 & 2033
- Table 46: Global PEMFC Market Volume Gigawatt Forecast, by Price Trend Analysis 2020 & 2033
- Table 47: Global PEMFC Market Revenue Million Forecast, by Country 2020 & 2033
- Table 48: Global PEMFC Market Volume Gigawatt Forecast, by Country 2020 & 2033
- Table 49: Global PEMFC Market Revenue Million Forecast, by Production Analysis 2020 & 2033
- Table 50: Global PEMFC Market Volume Gigawatt Forecast, by Production Analysis 2020 & 2033
- Table 51: Global PEMFC Market Revenue Million Forecast, by Consumption Analysis 2020 & 2033
- Table 52: Global PEMFC Market Volume Gigawatt Forecast, by Consumption Analysis 2020 & 2033
- Table 53: Global PEMFC Market Revenue Million Forecast, by Import Market Analysis (Value & Volume) 2020 & 2033
- Table 54: Global PEMFC Market Volume Gigawatt Forecast, by Import Market Analysis (Value & Volume) 2020 & 2033
- Table 55: Global PEMFC Market Revenue Million Forecast, by Export Market Analysis (Value & Volume) 2020 & 2033
- Table 56: Global PEMFC Market Volume Gigawatt Forecast, by Export Market Analysis (Value & Volume) 2020 & 2033
- Table 57: Global PEMFC Market Revenue Million Forecast, by Price Trend Analysis 2020 & 2033
- Table 58: Global PEMFC Market Volume Gigawatt Forecast, by Price Trend Analysis 2020 & 2033
- Table 59: Global PEMFC Market Revenue Million Forecast, by Country 2020 & 2033
- Table 60: Global PEMFC Market Volume Gigawatt Forecast, by Country 2020 & 2033
Frequently Asked Questions
1. What is the projected Compound Annual Growth Rate (CAGR) of the PEMFC Market?
The projected CAGR is approximately 18.43%.
2. Which companies are prominent players in the PEMFC Market?
Key companies in the market include Ballard Power Systems, ITM Power PLC, Toshiba Corporation, Intelligent Energy Limited*List Not Exhaustive, Plug Power Inc, Powercell Sweden AB, Bramble Energy, Cummins Inc, Bloom Energy, Hydrogenics (a Cummins Inc. company).
3. What are the main segments of the PEMFC Market?
The market segments include Production Analysis, Consumption Analysis, Import Market Analysis (Value & Volume), Export Market Analysis (Value & Volume), Price Trend Analysis.
4. Can you provide details about the market size?
The market size is estimated to be USD 3.58 Million as of 2022.
5. What are some drivers contributing to market growth?
4.; Growing Demand for Solar Energy4.; Reducing Solar Panel Costs and Associated Components for Solar Projects.
6. What are the notable trends driving market growth?
Government Initiatives and Growing Private Investments are Expected to Drive the Market.
7. Are there any restraints impacting market growth?
4.; Availability of Pure Silicon to make Solar PV Cells.
8. Can you provide examples of recent developments in the market?
August 2022: The National Renewable Energy Laboratory (NREL) began collaborating with Toyota Motor North America (Toyota) through a cooperative research and development agreement to build, install, and evaluate a 1-megawatt (MW) proton exchange membrane (PEM) fuel cell power generation system at NREL's Flatirons Campus.
9. What pricing options are available for accessing the report?
Pricing options include single-user, multi-user, and enterprise licenses priced at USD 4750, USD 5250, and USD 8750 respectively.
10. Is the market size provided in terms of value or volume?
The market size is provided in terms of value, measured in Million and volume, measured in Gigawatt.
11. Are there any specific market keywords associated with the report?
Yes, the market keyword associated with the report is "PEMFC Market," which aids in identifying and referencing the specific market segment covered.
12. How do I determine which pricing option suits my needs best?
The pricing options vary based on user requirements and access needs. Individual users may opt for single-user licenses, while businesses requiring broader access may choose multi-user or enterprise licenses for cost-effective access to the report.
13. Are there any additional resources or data provided in the PEMFC Market report?
While the report offers comprehensive insights, it's advisable to review the specific contents or supplementary materials provided to ascertain if additional resources or data are available.
14. How can I stay updated on further developments or reports in the PEMFC Market?
To stay informed about further developments, trends, and reports in the PEMFC Market, consider subscribing to industry newsletters, following relevant companies and organizations, or regularly checking reputable industry news sources and publications.
Methodology
Step 1 - Identification of Relevant Samples Size from Population Database


Step 2 - Approaches for Defining Global Market Size (Value, Volume* & Price*)

Note*: In applicable scenarios
Step 3 - Data Sources
Primary Research
- Web Analytics
- Survey Reports
- Research Institute
- Latest Research Reports
- Opinion Leaders
Secondary Research
- Annual Reports
- White Paper
- Latest Press Release
- Industry Association
- Paid Database
- Investor Presentations

Step 4 - Data Triangulation
Involves using different sources of information in order to increase the validity of a study
These sources are likely to be stakeholders in a program - participants, other researchers, program staff, other community members, and so on.
Then we put all data in single framework & apply various statistical tools to find out the dynamic on the market.
During the analysis stage, feedback from the stakeholder groups would be compared to determine areas of agreement as well as areas of divergence