

Key Insights
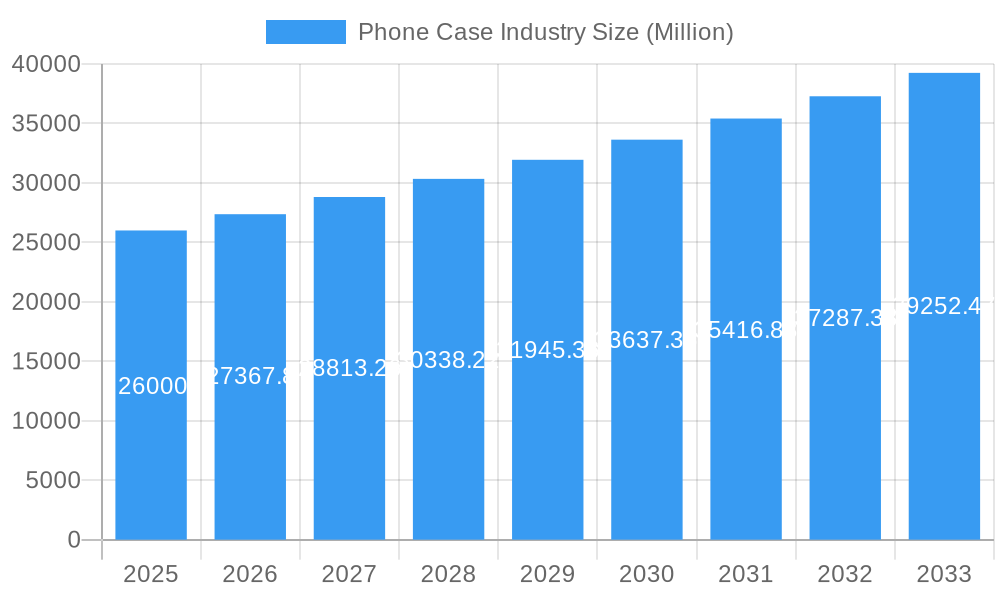
The global phone case market, valued at $26 billion in 2025, is projected to experience robust growth, driven by several key factors. The increasing adoption of smartphones globally, coupled with a rising consumer preference for personalized accessories and device protection, fuels market expansion. Premiumization trends, evidenced by the growing popularity of high-end phone cases with advanced features like drop protection, antimicrobial properties, and integrated wallet functionality, significantly contribute to market value. Furthermore, the diverse distribution channels, encompassing both online retail (e-commerce platforms and brand websites) and offline retail (mobile phone stores, electronics retailers), enhance market accessibility and reach. Competitive landscape analysis reveals a mix of established players like OtterBox and Spigen, alongside emerging brands catering to niche markets. Product segmentation, encompassing black plate cases, folio cases, and other case types, reflects diverse consumer preferences and price points. The market is further segmented into mass and premium categories, demonstrating a clear distinction in pricing and features. Geographic analysis shows a strong presence in North America and Europe, with Asia Pacific emerging as a rapidly growing market due to its expanding smartphone user base.
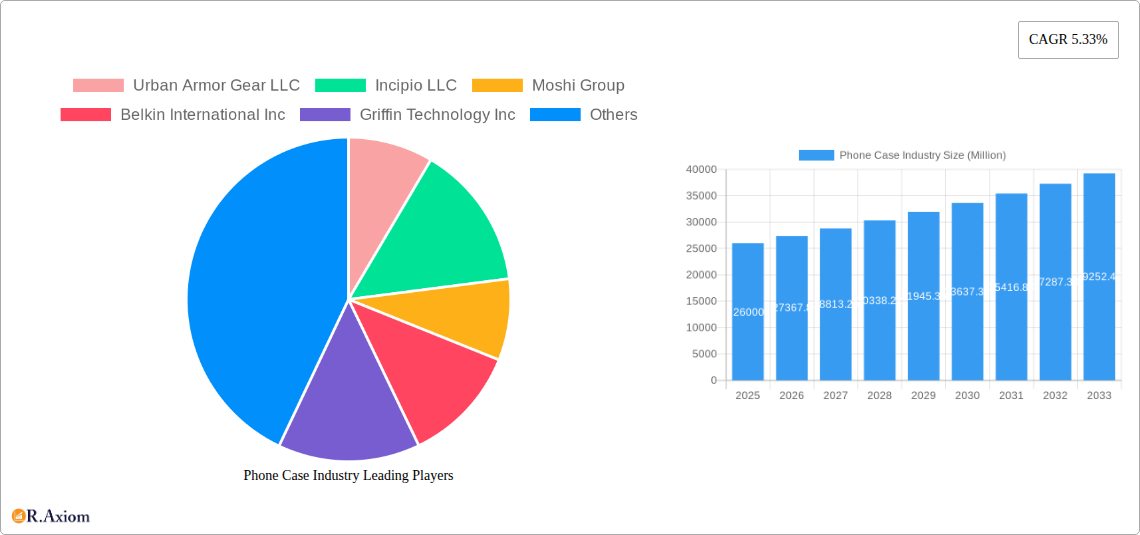
Phone Case Industry Market Size (In Billion)
The projected Compound Annual Growth Rate (CAGR) of 5.33% indicates a steady, upward trajectory for the market through 2033. However, potential restraints include the increasing durability of smartphones themselves, reducing the perceived need for protective cases in some segments. Fluctuations in raw material prices and economic downturns could also impact market growth. Despite these potential challenges, the continued innovation in case design, materials, and functionality, coupled with the ever-increasing smartphone penetration, positions the phone case market for sustained expansion in the coming years. Strategic marketing efforts focusing on the lifestyle aspects of phone case ownership and partnerships with smartphone manufacturers will be crucial for brands to maintain a competitive edge. The market is poised for further segmentation with the introduction of sustainable and eco-friendly case options, catering to the growing environmental consciousness among consumers.
Phone Case Industry Company Market Share
Phone Case Industry: A Comprehensive Market Report (2019-2033)
This in-depth report provides a comprehensive analysis of the global phone case industry, offering valuable insights for stakeholders, investors, and industry professionals. The report covers the period from 2019 to 2033, with a base year of 2025 and a forecast period spanning 2025-2033. The historical period analyzed is 2019-2024. The global market size is projected to reach xx Million by 2033, exhibiting a significant CAGR of xx% during the forecast period. This detailed analysis covers key market segments, competitive landscape, and future growth potential.
Phone Case Industry Market Concentration & Innovation
The phone case market is characterized by a moderately concentrated structure, featuring a blend of established major players and a vibrant ecosystem of smaller, specialized companies. Leading the charge are key entities such as OtterBox Holdings Inc., Spigen Inc., and Incipio LLC, which collectively hold a significant portion of the market share. For 2024, preliminary data suggests that OtterBox commands approximately **[Insert OtterBox Market Share]%**, Spigen holds around **[Insert Spigen Market Share]%**, and Incipio accounts for roughly **[Insert Incipio Market Share]%**. The remaining **[Insert Remaining Market Share]%** is distributed across a wide array of other competitors.
Innovation within the industry is a dynamic process, propelled by a confluence of influential factors:
- Technological Advancements: Continuous integration of cutting-edge materials for enhanced durability, seamless wireless charging compatibility, and sophisticated multi-layer protection systems for superior drop resistance.
- Evolving Consumer Preferences: A rising demand for aesthetically sophisticated designs, unparalleled personalization options, and an increasing emphasis on the use of eco-friendly and sustainable materials.
- Competitive Landscape Dynamics: An ongoing cycle of new product introductions, feature enhancements, and strategic marketing campaigns aimed at capturing and expanding market share.
Mergers and Acquisitions (M&A) are instrumental in shaping the industry's landscape. While specific deal valuations are not always public, the past five years have seen significant consolidation, with aggregate M&A activity estimated to be around **[Insert M&A Value] Million USD**. These strategic moves often involve companies looking to broaden their product offerings, strengthen their distribution networks, or penetrate new target markets. Regulatory frameworks, primarily focused on ensuring product safety and adhering to environmental standards, exert considerable influence on material selection and manufacturing methodologies. While alternatives like screen protectors and minimalist phone designs offer some level of competition, the overall demand for robust phone protection solutions remains exceptionally strong.
Phone Case Industry Industry Trends & Insights
The phone case industry is experiencing a period of robust and sustained growth. This upward trajectory is underpinned by several pivotal drivers: the ever-expanding global smartphone market, a steady increase in consumer disposable income, and a heightened consumer awareness regarding the necessity of safeguarding their valuable mobile devices. A significant trend observed is the notable shift towards premium phone cases, reflecting a consumer willingness to invest in high-quality, durable, and aesthetically superior products. Furthermore, online retail channels have firmly established themselves as the dominant distribution method, capitalizing on the convenience, extensive reach, and personalized shopping experiences offered by e-commerce platforms.
Disruptive technological innovations, such as the widespread adoption of 5G technology and the emergence of foldable smartphones, are actively stimulating novel approaches to case design and functionality. Consumer preferences are in constant flux, with a pronounced growing demand for cases manufactured from eco-friendly materials, offering extensive personalization capabilities, and incorporating innovative integrated features like wallet compartments or built-in stands. The Compound Annual Growth Rate (CAGR) of the market is projected to be a strong **[Insert CAGR]%**, signaling considerable future growth potential. Market penetration is anticipated to reach **[Insert Market Penetration]%** by 2033, indicating significant opportunities in previously untapped markets. The competitive environment remains exceptionally intense, compelling companies to focus on achieving differentiation through distinctive designs, superior material choices, and impactful brand building initiatives.
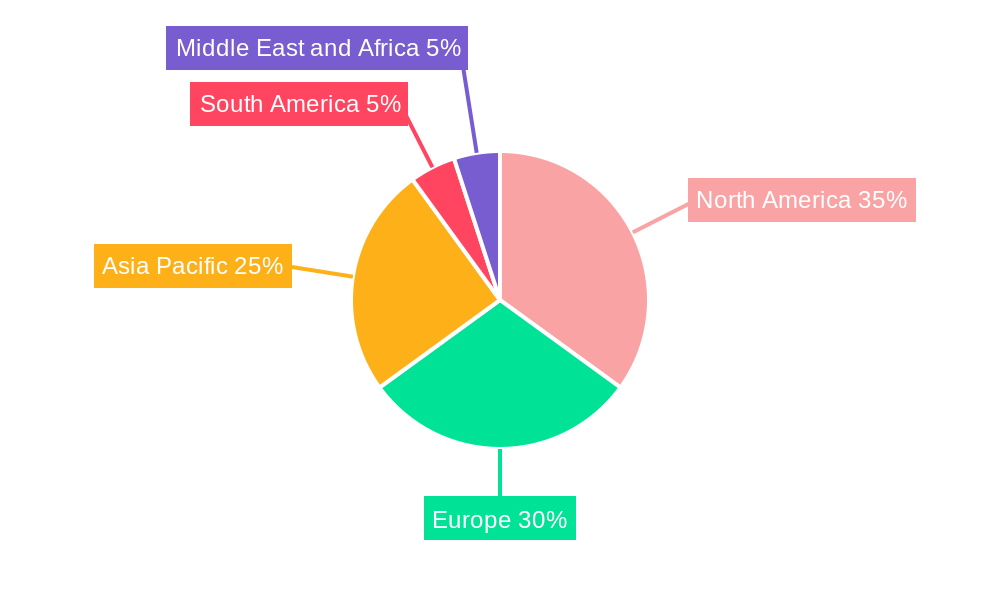
Dominant Markets & Segments in Phone Case Industry
The North American region currently holds the largest market share, driven by high smartphone penetration and consumer spending. Within product types, Black Plate Cases hold the largest market share, followed by Folio Cases and Other Case Types. The Premium category shows higher growth rates due to higher profit margins and willingness to spend.
Key Drivers:
- High Smartphone Penetration: The prevalence of smartphones fuels the demand for protective cases.
- Strong Consumer Spending: Consumers are willing to invest in high-quality cases, especially in developed markets.
- E-commerce Growth: Online retail channels significantly contribute to market expansion.
- Technological Advancements: The development of new smartphone technologies enhances demand.
Dominance Analysis:
The premium segment demonstrates higher growth potential due to consumers' willingness to pay for added features and higher quality. Online retail is experiencing rapid growth due to its convenience and expanded market reach. Offline retail continues to play a significant role, particularly for consumers who value in-person product inspection.
Phone Case Industry Product Developments
Recent product innovations demonstrate a trend towards incorporating advanced materials, improved drop protection, and integrated functionalities. Companies are focusing on enhancing design aesthetics, offering a wider range of customization options, and utilizing sustainable materials to appeal to environmentally conscious consumers. The market fit for these innovations is largely positive, aligning with rising consumer demands for both protection and style. Many new cases incorporate features such as wireless charging compatibility and MagSafe compatibility for iPhones.
Report Scope & Segmentation Analysis
This report segments the phone case market based on product type (Black Plate Cases, Folio Cases, Other Case Types), category (Mass, Premium), and distribution channel (Online Retail, Offline Retail). Each segment is analyzed considering its market size, growth rate, and competitive landscape. Growth projections for each segment vary, with the Premium category and Online Retail channels demonstrating stronger growth potential compared to their counterparts. Competitive dynamics within each segment are heavily influenced by brand recognition, pricing strategies, and product differentiation.
Key Drivers of Phone Case Industry Growth
Several factors contribute to the growth of the phone case industry:
- Technological advancements: The introduction of new smartphone models and features necessitate the development of compatible phone cases.
- Rising smartphone penetration: The widespread adoption of smartphones fuels the demand for protective cases.
- Increasing consumer disposable incomes: Consumers are increasingly willing to spend on accessories like phone cases.
- Government regulations: Safety and environmental standards influence material selection and manufacturing processes.
Challenges in the Phone Case Industry Sector
The phone case industry is navigating a landscape dotted with several notable challenges:
- Intense Market Competition: The industry is characterized by a highly saturated market with a multitude of players continuously vying for market share, leading to price pressures and the need for constant innovation.
- Supply Chain Vulnerabilities: Global geopolitical events, natural disasters, and logistical hurdles can significantly disrupt the timely availability of essential raw materials and impact manufacturing capacities, leading to production delays.
- Dynamic Consumer Palates: Rapidly evolving consumer tastes and preferences necessitate agility and foresight from manufacturers to stay ahead of emerging trends and promptly meet diverse demands.
- Environmental Stewardship: Growing societal and regulatory pressure to adopt sustainable manufacturing practices, minimize waste, and reduce the overall environmental footprint of products is a significant ongoing challenge.
Emerging Opportunities in Phone Case Industry
Several emerging opportunities exist within the phone case industry:
- Sustainable materials: The increasing demand for eco-friendly products creates opportunities for companies using sustainable materials.
- Integration of smart features: Cases with built-in functionalities like wireless charging, health tracking, or even small displays are gaining popularity.
- Expansion into new markets: Untapped markets in developing economies present significant growth potential.
- Customization and personalization: Offering highly customizable cases allows for differentiation and higher revenue potential.
Leading Players in the Phone Case Industry Market
- Urban Armor Gear LLC
- Incipio LLC
- Moshi Group
- Belkin International Inc
- Griffin Technology Inc
- Ringke Inc
- Poetic Cases LLC
- Spigen Inc
- OtterBox Holdings Inc
- Reiko Wireless Inc
Key Developments in Phone Case Industry Industry
- February 2022: Atom Studios launched the "Touch" case for Samsung S22 and S22+ models, emphasizing tactile soft-touch silicon. This launch demonstrates a trend towards prioritizing user experience in design.
- September 2021: CLCKR launched a new line of iPhone 13 cases with multifunctional stands, grips, and color-matching designs, reflecting the importance of design and functionality.
- January 2021: Incipio Inc. launched protective cases for the Samsung Galaxy S21 lineup, certified through Samsung's Mobile Accessory Partnership Program (SMAPP). This highlights the importance of securing partnerships with major smartphone manufacturers.
Strategic Outlook for Phone Case Industry Market
The phone case industry is strategically positioned for sustained and significant growth. This optimistic outlook is underpinned by several key drivers: the ever-increasing global penetration of smartphones, the continuous and rapid release of new smartphone models by manufacturers, and a burgeoning consumer demand for protective cases that are not only durable but also stylish and reflective of personal aesthetics. Companies that demonstrate a proficient ability to harness technological innovations, exhibit adaptability to the ever-shifting consumer preferences, and proactively embrace and implement sustainable practices are exceptionally well-placed to not only survive but thrive in this dynamic and competitive market. Growth is anticipated to be a dual-engine phenomenon, propelled by the expansion of markets in developing regions alongside increasing adoption rates within more mature, established markets.
Phone Case Industry Segmentation
-
1. Product Type
- 1.1. Black Plate Cases
- 1.2. Folio Cases
- 1.3. Other Case Types
-
2. Category
- 2.1. Mass
- 2.2. Premium
-
3. Distribution Channel
- 3.1. Online Retail
- 3.2. Offline Retail
Phone Case Industry Segmentation By Geography
-
1. North America
- 1.1. United States
- 1.2. Canada
- 1.3. Mexico
- 1.4. Rest of North America
-
2. Europe
- 2.1. Germany
- 2.2. United Kingdom
- 2.3. France
- 2.4. Russia
- 2.5. Spain
- 2.6. Italy
- 2.7. Rest of Europe
-
3. Asia Pacific
- 3.1. India
- 3.2. China
- 3.3. Japan
- 3.4. Australia
- 3.5. Rest of Asia Pacific
-
4. South America
- 4.1. Brazil
- 4.2. Argentina
- 4.3. Rest of South America
-
5. Middle East and Africa
- 5.1. United Arab Emirates
- 5.2. South Africa
- 5.3. Rest of Middle East and Africa
Phone Case Industry Regional Market Share
Geographic Coverage of Phone Case Industry
Phone Case Industry REPORT HIGHLIGHTS
| Aspects | Details |
|---|---|
| Study Period | 2020-2034 |
| Base Year | 2025 |
| Estimated Year | 2026 |
| Forecast Period | 2026-2034 |
| Historical Period | 2020-2025 |
| Growth Rate | CAGR of 5.33% from 2020-2034 |
| Segmentation |
|
Table of Contents
- 1. Introduction
- 1.1. Research Scope
- 1.2. Market Segmentation
- 1.3. Research Objective
- 1.4. Definitions and Assumptions
- 2. Executive Summary
- 2.1. Market Snapshot
- 3. Market Dynamics
- 3.1. Market Drivers
- 3.2. Market Restrains
- 3.3. Market Trends
- 3.4. Market Opportunities
- 4. Market Factor Analysis
- 4.1. Porters Five Forces
- 4.1.1. Bargaining Power of Suppliers
- 4.1.2. Bargaining Power of Buyers
- 4.1.3. Threat of New Entrants
- 4.1.4. Threat of Substitutes
- 4.1.5. Competitive Rivalry
- 4.2. PESTEL analysis
- 4.3. BCG Analysis
- 4.3.1. Stars (High Growth, High Market Share)
- 4.3.2. Cash Cows (Low Growth, High Market Share)
- 4.3.3. Question Mark (High Growth, Low Market Share)
- 4.3.4. Dogs (Low Growth, Low Market Share)
- 4.4. Ansoff Matrix Analysis
- 4.5. Supply Chain Analysis
- 4.6. Regulatory Landscape
- 4.7. Current Market Potential and Opportunity Assessment (TAM–SAM–SOM Framework)
- 4.8. RAX Analyst Note
- 4.1. Porters Five Forces
- 5. Market Analysis, Insights and Forecast 2021-2033
- 5.1. Market Analysis, Insights and Forecast - by Product Type
- 5.1.1. Black Plate Cases
- 5.1.2. Folio Cases
- 5.1.3. Other Case Types
- 5.2. Market Analysis, Insights and Forecast - by Category
- 5.2.1. Mass
- 5.2.2. Premium
- 5.3. Market Analysis, Insights and Forecast - by Distribution Channel
- 5.3.1. Online Retail
- 5.3.2. Offline Retail
- 5.4. Market Analysis, Insights and Forecast - by Region
- 5.4.1. North America
- 5.4.2. Europe
- 5.4.3. Asia Pacific
- 5.4.4. South America
- 5.4.5. Middle East and Africa
- 5.1. Market Analysis, Insights and Forecast - by Product Type
- 6. Global Phone Case Industry Analysis, Insights and Forecast, 2021-2033
- 6.1. Market Analysis, Insights and Forecast - by Product Type
- 6.1.1. Black Plate Cases
- 6.1.2. Folio Cases
- 6.1.3. Other Case Types
- 6.2. Market Analysis, Insights and Forecast - by Category
- 6.2.1. Mass
- 6.2.2. Premium
- 6.3. Market Analysis, Insights and Forecast - by Distribution Channel
- 6.3.1. Online Retail
- 6.3.2. Offline Retail
- 6.1. Market Analysis, Insights and Forecast - by Product Type
- 7. North America Phone Case Industry Analysis, Insights and Forecast, 2020-2032
- 7.1. Market Analysis, Insights and Forecast - by Product Type
- 7.1.1. Black Plate Cases
- 7.1.2. Folio Cases
- 7.1.3. Other Case Types
- 7.2. Market Analysis, Insights and Forecast - by Category
- 7.2.1. Mass
- 7.2.2. Premium
- 7.3. Market Analysis, Insights and Forecast - by Distribution Channel
- 7.3.1. Online Retail
- 7.3.2. Offline Retail
- 7.1. Market Analysis, Insights and Forecast - by Product Type
- 8. Europe Phone Case Industry Analysis, Insights and Forecast, 2020-2032
- 8.1. Market Analysis, Insights and Forecast - by Product Type
- 8.1.1. Black Plate Cases
- 8.1.2. Folio Cases
- 8.1.3. Other Case Types
- 8.2. Market Analysis, Insights and Forecast - by Category
- 8.2.1. Mass
- 8.2.2. Premium
- 8.3. Market Analysis, Insights and Forecast - by Distribution Channel
- 8.3.1. Online Retail
- 8.3.2. Offline Retail
- 8.1. Market Analysis, Insights and Forecast - by Product Type
- 9. Asia Pacific Phone Case Industry Analysis, Insights and Forecast, 2020-2032
- 9.1. Market Analysis, Insights and Forecast - by Product Type
- 9.1.1. Black Plate Cases
- 9.1.2. Folio Cases
- 9.1.3. Other Case Types
- 9.2. Market Analysis, Insights and Forecast - by Category
- 9.2.1. Mass
- 9.2.2. Premium
- 9.3. Market Analysis, Insights and Forecast - by Distribution Channel
- 9.3.1. Online Retail
- 9.3.2. Offline Retail
- 9.1. Market Analysis, Insights and Forecast - by Product Type
- 10. South America Phone Case Industry Analysis, Insights and Forecast, 2020-2032
- 10.1. Market Analysis, Insights and Forecast - by Product Type
- 10.1.1. Black Plate Cases
- 10.1.2. Folio Cases
- 10.1.3. Other Case Types
- 10.2. Market Analysis, Insights and Forecast - by Category
- 10.2.1. Mass
- 10.2.2. Premium
- 10.3. Market Analysis, Insights and Forecast - by Distribution Channel
- 10.3.1. Online Retail
- 10.3.2. Offline Retail
- 10.1. Market Analysis, Insights and Forecast - by Product Type
- 11. Middle East and Africa Phone Case Industry Analysis, Insights and Forecast, 2020-2032
- 11.1. Market Analysis, Insights and Forecast - by Product Type
- 11.1.1. Black Plate Cases
- 11.1.2. Folio Cases
- 11.1.3. Other Case Types
- 11.2. Market Analysis, Insights and Forecast - by Category
- 11.2.1. Mass
- 11.2.2. Premium
- 11.3. Market Analysis, Insights and Forecast - by Distribution Channel
- 11.3.1. Online Retail
- 11.3.2. Offline Retail
- 11.1. Market Analysis, Insights and Forecast - by Product Type
- 12. Competitive Analysis
- 12.1. Company Profiles
- 12.1.1 Urban Armor Gear LLC
- 12.1.1.1. Company Overview
- 12.1.1.2. Products
- 12.1.1.3. Company Financials
- 12.1.1.4. SWOT Analysis
- 12.1.2 Incipio LLC
- 12.1.2.1. Company Overview
- 12.1.2.2. Products
- 12.1.2.3. Company Financials
- 12.1.2.4. SWOT Analysis
- 12.1.3 Moshi Group
- 12.1.3.1. Company Overview
- 12.1.3.2. Products
- 12.1.3.3. Company Financials
- 12.1.3.4. SWOT Analysis
- 12.1.4 Belkin International Inc
- 12.1.4.1. Company Overview
- 12.1.4.2. Products
- 12.1.4.3. Company Financials
- 12.1.4.4. SWOT Analysis
- 12.1.5 Griffin Technology Inc
- 12.1.5.1. Company Overview
- 12.1.5.2. Products
- 12.1.5.3. Company Financials
- 12.1.5.4. SWOT Analysis
- 12.1.6 Ringke Inc
- 12.1.6.1. Company Overview
- 12.1.6.2. Products
- 12.1.6.3. Company Financials
- 12.1.6.4. SWOT Analysis
- 12.1.7 Poetic Cases LLC*List Not Exhaustive
- 12.1.7.1. Company Overview
- 12.1.7.2. Products
- 12.1.7.3. Company Financials
- 12.1.7.4. SWOT Analysis
- 12.1.8 Spigen Inc
- 12.1.8.1. Company Overview
- 12.1.8.2. Products
- 12.1.8.3. Company Financials
- 12.1.8.4. SWOT Analysis
- 12.1.9 OtterBox Holdings Inc
- 12.1.9.1. Company Overview
- 12.1.9.2. Products
- 12.1.9.3. Company Financials
- 12.1.9.4. SWOT Analysis
- 12.1.10 Reiko Wireless Inc
- 12.1.10.1. Company Overview
- 12.1.10.2. Products
- 12.1.10.3. Company Financials
- 12.1.10.4. SWOT Analysis
- 12.1.1 Urban Armor Gear LLC
- 12.2. Market Entropy
- 12.2.1 Company's Key Areas Served
- 12.2.2 Recent Developments
- 12.3. Company Market Share Analysis 2025
- 12.3.1 Top 5 Companies Market Share Analysis
- 12.3.2 Top 3 Companies Market Share Analysis
- 12.4. List of Potential Customers
- 13. Research Methodology
List of Figures
- Figure 1: Global Phone Case Industry Revenue Breakdown (Million, %) by Region 2025 & 2033
- Figure 2: North America Phone Case Industry Revenue (Million), by Product Type 2025 & 2033
- Figure 3: North America Phone Case Industry Revenue Share (%), by Product Type 2025 & 2033
- Figure 4: North America Phone Case Industry Revenue (Million), by Category 2025 & 2033
- Figure 5: North America Phone Case Industry Revenue Share (%), by Category 2025 & 2033
- Figure 6: North America Phone Case Industry Revenue (Million), by Distribution Channel 2025 & 2033
- Figure 7: North America Phone Case Industry Revenue Share (%), by Distribution Channel 2025 & 2033
- Figure 8: North America Phone Case Industry Revenue (Million), by Country 2025 & 2033
- Figure 9: North America Phone Case Industry Revenue Share (%), by Country 2025 & 2033
- Figure 10: Europe Phone Case Industry Revenue (Million), by Product Type 2025 & 2033
- Figure 11: Europe Phone Case Industry Revenue Share (%), by Product Type 2025 & 2033
- Figure 12: Europe Phone Case Industry Revenue (Million), by Category 2025 & 2033
- Figure 13: Europe Phone Case Industry Revenue Share (%), by Category 2025 & 2033
- Figure 14: Europe Phone Case Industry Revenue (Million), by Distribution Channel 2025 & 2033
- Figure 15: Europe Phone Case Industry Revenue Share (%), by Distribution Channel 2025 & 2033
- Figure 16: Europe Phone Case Industry Revenue (Million), by Country 2025 & 2033
- Figure 17: Europe Phone Case Industry Revenue Share (%), by Country 2025 & 2033
- Figure 18: Asia Pacific Phone Case Industry Revenue (Million), by Product Type 2025 & 2033
- Figure 19: Asia Pacific Phone Case Industry Revenue Share (%), by Product Type 2025 & 2033
- Figure 20: Asia Pacific Phone Case Industry Revenue (Million), by Category 2025 & 2033
- Figure 21: Asia Pacific Phone Case Industry Revenue Share (%), by Category 2025 & 2033
- Figure 22: Asia Pacific Phone Case Industry Revenue (Million), by Distribution Channel 2025 & 2033
- Figure 23: Asia Pacific Phone Case Industry Revenue Share (%), by Distribution Channel 2025 & 2033
- Figure 24: Asia Pacific Phone Case Industry Revenue (Million), by Country 2025 & 2033
- Figure 25: Asia Pacific Phone Case Industry Revenue Share (%), by Country 2025 & 2033
- Figure 26: South America Phone Case Industry Revenue (Million), by Product Type 2025 & 2033
- Figure 27: South America Phone Case Industry Revenue Share (%), by Product Type 2025 & 2033
- Figure 28: South America Phone Case Industry Revenue (Million), by Category 2025 & 2033
- Figure 29: South America Phone Case Industry Revenue Share (%), by Category 2025 & 2033
- Figure 30: South America Phone Case Industry Revenue (Million), by Distribution Channel 2025 & 2033
- Figure 31: South America Phone Case Industry Revenue Share (%), by Distribution Channel 2025 & 2033
- Figure 32: South America Phone Case Industry Revenue (Million), by Country 2025 & 2033
- Figure 33: South America Phone Case Industry Revenue Share (%), by Country 2025 & 2033
- Figure 34: Middle East and Africa Phone Case Industry Revenue (Million), by Product Type 2025 & 2033
- Figure 35: Middle East and Africa Phone Case Industry Revenue Share (%), by Product Type 2025 & 2033
- Figure 36: Middle East and Africa Phone Case Industry Revenue (Million), by Category 2025 & 2033
- Figure 37: Middle East and Africa Phone Case Industry Revenue Share (%), by Category 2025 & 2033
- Figure 38: Middle East and Africa Phone Case Industry Revenue (Million), by Distribution Channel 2025 & 2033
- Figure 39: Middle East and Africa Phone Case Industry Revenue Share (%), by Distribution Channel 2025 & 2033
- Figure 40: Middle East and Africa Phone Case Industry Revenue (Million), by Country 2025 & 2033
- Figure 41: Middle East and Africa Phone Case Industry Revenue Share (%), by Country 2025 & 2033
List of Tables
- Table 1: Global Phone Case Industry Revenue Million Forecast, by Product Type 2020 & 2033
- Table 2: Global Phone Case Industry Revenue Million Forecast, by Category 2020 & 2033
- Table 3: Global Phone Case Industry Revenue Million Forecast, by Distribution Channel 2020 & 2033
- Table 4: Global Phone Case Industry Revenue Million Forecast, by Region 2020 & 2033
- Table 5: Global Phone Case Industry Revenue Million Forecast, by Product Type 2020 & 2033
- Table 6: Global Phone Case Industry Revenue Million Forecast, by Category 2020 & 2033
- Table 7: Global Phone Case Industry Revenue Million Forecast, by Distribution Channel 2020 & 2033
- Table 8: Global Phone Case Industry Revenue Million Forecast, by Country 2020 & 2033
- Table 9: United States Phone Case Industry Revenue (Million) Forecast, by Application 2020 & 2033
- Table 10: Canada Phone Case Industry Revenue (Million) Forecast, by Application 2020 & 2033
- Table 11: Mexico Phone Case Industry Revenue (Million) Forecast, by Application 2020 & 2033
- Table 12: Rest of North America Phone Case Industry Revenue (Million) Forecast, by Application 2020 & 2033
- Table 13: Global Phone Case Industry Revenue Million Forecast, by Product Type 2020 & 2033
- Table 14: Global Phone Case Industry Revenue Million Forecast, by Category 2020 & 2033
- Table 15: Global Phone Case Industry Revenue Million Forecast, by Distribution Channel 2020 & 2033
- Table 16: Global Phone Case Industry Revenue Million Forecast, by Country 2020 & 2033
- Table 17: Germany Phone Case Industry Revenue (Million) Forecast, by Application 2020 & 2033
- Table 18: United Kingdom Phone Case Industry Revenue (Million) Forecast, by Application 2020 & 2033
- Table 19: France Phone Case Industry Revenue (Million) Forecast, by Application 2020 & 2033
- Table 20: Russia Phone Case Industry Revenue (Million) Forecast, by Application 2020 & 2033
- Table 21: Spain Phone Case Industry Revenue (Million) Forecast, by Application 2020 & 2033
- Table 22: Italy Phone Case Industry Revenue (Million) Forecast, by Application 2020 & 2033
- Table 23: Rest of Europe Phone Case Industry Revenue (Million) Forecast, by Application 2020 & 2033
- Table 24: Global Phone Case Industry Revenue Million Forecast, by Product Type 2020 & 2033
- Table 25: Global Phone Case Industry Revenue Million Forecast, by Category 2020 & 2033
- Table 26: Global Phone Case Industry Revenue Million Forecast, by Distribution Channel 2020 & 2033
- Table 27: Global Phone Case Industry Revenue Million Forecast, by Country 2020 & 2033
- Table 28: India Phone Case Industry Revenue (Million) Forecast, by Application 2020 & 2033
- Table 29: China Phone Case Industry Revenue (Million) Forecast, by Application 2020 & 2033
- Table 30: Japan Phone Case Industry Revenue (Million) Forecast, by Application 2020 & 2033
- Table 31: Australia Phone Case Industry Revenue (Million) Forecast, by Application 2020 & 2033
- Table 32: Rest of Asia Pacific Phone Case Industry Revenue (Million) Forecast, by Application 2020 & 2033
- Table 33: Global Phone Case Industry Revenue Million Forecast, by Product Type 2020 & 2033
- Table 34: Global Phone Case Industry Revenue Million Forecast, by Category 2020 & 2033
- Table 35: Global Phone Case Industry Revenue Million Forecast, by Distribution Channel 2020 & 2033
- Table 36: Global Phone Case Industry Revenue Million Forecast, by Country 2020 & 2033
- Table 37: Brazil Phone Case Industry Revenue (Million) Forecast, by Application 2020 & 2033
- Table 38: Argentina Phone Case Industry Revenue (Million) Forecast, by Application 2020 & 2033
- Table 39: Rest of South America Phone Case Industry Revenue (Million) Forecast, by Application 2020 & 2033
- Table 40: Global Phone Case Industry Revenue Million Forecast, by Product Type 2020 & 2033
- Table 41: Global Phone Case Industry Revenue Million Forecast, by Category 2020 & 2033
- Table 42: Global Phone Case Industry Revenue Million Forecast, by Distribution Channel 2020 & 2033
- Table 43: Global Phone Case Industry Revenue Million Forecast, by Country 2020 & 2033
- Table 44: United Arab Emirates Phone Case Industry Revenue (Million) Forecast, by Application 2020 & 2033
- Table 45: South Africa Phone Case Industry Revenue (Million) Forecast, by Application 2020 & 2033
- Table 46: Rest of Middle East and Africa Phone Case Industry Revenue (Million) Forecast, by Application 2020 & 2033
Frequently Asked Questions
1. What is the projected Compound Annual Growth Rate (CAGR) of the Phone Case Industry?
The projected CAGR is approximately 5.33%.
2. Which companies are prominent players in the Phone Case Industry?
Key companies in the market include Urban Armor Gear LLC, Incipio LLC, Moshi Group, Belkin International Inc, Griffin Technology Inc, Ringke Inc, Poetic Cases LLC*List Not Exhaustive, Spigen Inc, OtterBox Holdings Inc, Reiko Wireless Inc.
3. What are the main segments of the Phone Case Industry?
The market segments include Product Type, Category, Distribution Channel.
4. Can you provide details about the market size?
The market size is estimated to be USD 26 Million as of 2022.
5. What are some drivers contributing to market growth?
Surge in Product Innovation; Increasing Government Initiatives and Extensive Promotions by Market Players.
6. What are the notable trends driving market growth?
Rugged Case to Witness a Significant Demand.
7. Are there any restraints impacting market growth?
Safety Concerns Associated with the Usage of Insect Repellents.
8. Can you provide examples of recent developments in the market?
February 2022: Atom Studios launched a new case for Samsung phones following the success of its Apple range. The new Samsung case, called Touch, is available for the S22 and S22+ Samsung Galaxy models and is designed with tactility in mind. The soft, soft-touch silicon outer chosen by Atmos Studios was designated to be touched and feels ultra-soft in hand.
9. What pricing options are available for accessing the report?
Pricing options include single-user, multi-user, and enterprise licenses priced at USD 4750, USD 5250, and USD 8750 respectively.
10. Is the market size provided in terms of value or volume?
The market size is provided in terms of value, measured in Million.
11. Are there any specific market keywords associated with the report?
Yes, the market keyword associated with the report is "Phone Case Industry," which aids in identifying and referencing the specific market segment covered.
12. How do I determine which pricing option suits my needs best?
The pricing options vary based on user requirements and access needs. Individual users may opt for single-user licenses, while businesses requiring broader access may choose multi-user or enterprise licenses for cost-effective access to the report.
13. Are there any additional resources or data provided in the Phone Case Industry report?
While the report offers comprehensive insights, it's advisable to review the specific contents or supplementary materials provided to ascertain if additional resources or data are available.
14. How can I stay updated on further developments or reports in the Phone Case Industry?
To stay informed about further developments, trends, and reports in the Phone Case Industry, consider subscribing to industry newsletters, following relevant companies and organizations, or regularly checking reputable industry news sources and publications.
Methodology
Step 1 - Identification of Relevant Samples Size from Population Database


Step 2 - Approaches for Defining Global Market Size (Value, Volume* & Price*)

Note*: In applicable scenarios
Step 3 - Data Sources
Primary Research
- Web Analytics
- Survey Reports
- Research Institute
- Latest Research Reports
- Opinion Leaders
Secondary Research
- Annual Reports
- White Paper
- Latest Press Release
- Industry Association
- Paid Database
- Investor Presentations

Step 4 - Data Triangulation
Involves using different sources of information in order to increase the validity of a study
These sources are likely to be stakeholders in a program - participants, other researchers, program staff, other community members, and so on.
Then we put all data in single framework & apply various statistical tools to find out the dynamic on the market.
During the analysis stage, feedback from the stakeholder groups would be compared to determine areas of agreement as well as areas of divergence