

Key Insights
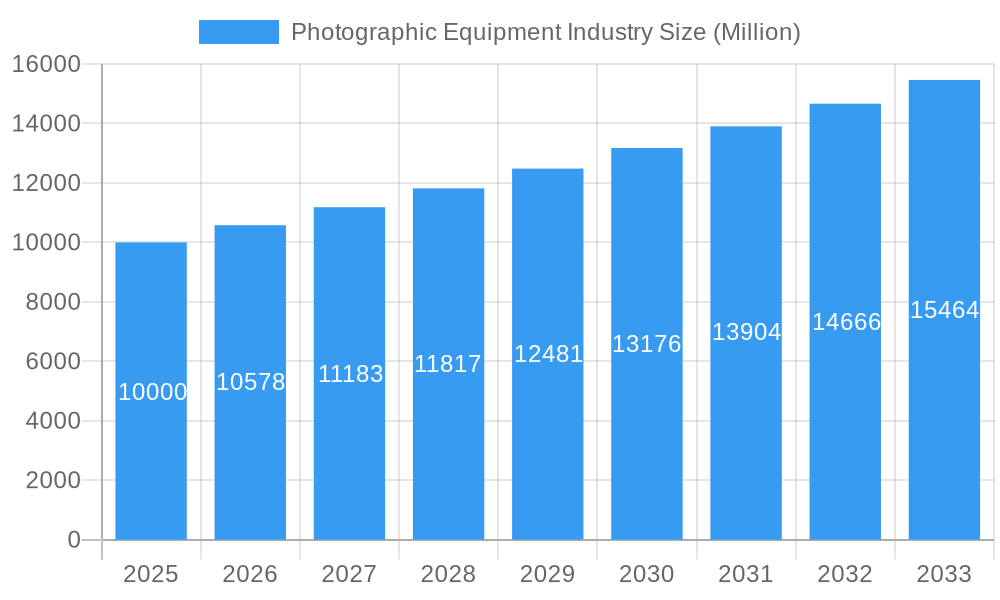
The global photographic equipment market, valued at approximately $6.5 billion in 2025, is projected for significant expansion. It is expected to grow at a compound annual growth rate (CAGR) of 7.1% from 2025 to 2033. This growth is propelled by the rising popularity of photography as a hobby and profession, largely due to social media trends and the demand for high-quality visual content. Technological advancements, including enhanced sensor technology, improved image stabilization, and the development of more compact cameras, are also key drivers. The increasing adoption of mirrorless cameras and the expansion of online retail further stimulate market growth. While challenges like the cost of high-end equipment and smartphone camera substitution exist, they are counterbalanced by the sustained demand for professional equipment and the emergence of niche markets like drone and action cameras. The market is segmented by distribution channel (online, offline) and product type (cameras, lenses, accessories), with cameras and lenses currently holding the dominant market share. Leading companies such as Canon, Nikon, Sony, and Fujifilm are driving innovation and competition. The Asia-Pacific region shows strong growth, attributed to increasing disposable incomes and smartphone penetration.

Photographic Equipment Industry Market Size (In Billion)
The forecast period (2025-2033) anticipates sustained market growth, fueled by ongoing technological innovation and an expanding global photography enthusiast base. The integration of advanced features like artificial intelligence and enhanced connectivity in cameras will appeal to both professionals and amateurs. Competitive pressures and economic fluctuations are potential challenges. Market segmentation offers opportunities for specialized players focusing on niche areas such as professional sports or wildlife photography. The development of augmented and virtual reality technologies also presents potential future expansion avenues for the photographic equipment market.
Photographic Equipment Industry Company Market Share
Photographic Equipment Industry: Market Analysis, Trends & Forecast 2019-2033
This comprehensive report provides an in-depth analysis of the global photographic equipment industry, offering valuable insights for stakeholders, investors, and industry professionals. The report covers the period from 2019 to 2033, with a base year of 2025 and a forecast period spanning 2025-2033. The market size is estimated to be xx Million in 2025 and is projected to reach xx Million by 2033, showcasing a substantial CAGR of xx%. The analysis includes detailed segmentation by distribution channel (online and offline retail) and product type (camera, lens, and others), with a focus on key players like Canon Inc, Nikon Corporation, Samsung Electronics Co, FUJIFILM Holdings Corporation, Leica Camera AG, Panasonic Corporation, and Sony Corporation.
Photographic Equipment Industry Market Concentration & Innovation
The photographic equipment market exhibits a moderately concentrated landscape, dominated by established players like Canon and Nikon, who collectively hold a significant market share (estimated at xx%). However, the presence of other significant players like Sony and Samsung introduces competitive dynamics. Market share fluctuations are influenced by factors including product innovation, marketing strategies, and technological advancements. Innovation is a crucial driver, with companies continuously investing in developing advanced camera technologies, such as improved image sensors, enhanced autofocus systems, and AI-powered features. Regulatory frameworks, particularly concerning import/export regulations and safety standards, play a role in market dynamics. The presence of substitute products, including smartphones with advanced camera capabilities, poses a considerable challenge to the industry. End-user trends, such as the rising popularity of vlogging and professional photography, shape demand, while M&A activities, though not frequent, have the potential to significantly alter the market landscape. Recent M&A deal values have been in the range of xx Million to xx Million, consolidating market shares and capabilities.
- Market Concentration: High (xx% held by top 5 players)
- Innovation Drivers: AI-powered features, improved image sensors, advanced autofocus.
- Regulatory Impact: Import/export regulations, safety standards.
- Substitute Products: Smartphone cameras.
- M&A Activities: Deal values ranging from xx Million to xx Million.
Photographic Equipment Industry Industry Trends & Insights
The photographic equipment market is experiencing dynamic shifts driven by several factors. The global market is experiencing growth, driven by increasing consumer disposable income and a growing preference for high-quality photography. Technological disruptions, specifically in areas like sensor technology and lens design, are continually pushing the boundaries of image quality and user experience. Consumer preferences are shifting towards smaller, lighter, and more versatile cameras, catering to the needs of both amateur and professional photographers. The competitive landscape is highly dynamic, with established brands competing aggressively on price, features, and innovation. The market exhibits a steady, albeit moderate, CAGR of xx% and enjoys a market penetration rate of approximately xx% in major markets. Market growth is also influenced by the increasing adoption of mirrorless cameras and the growing demand for specialized lenses for specific photography types.
Dominant Markets & Segments in Photographic Equipment Industry
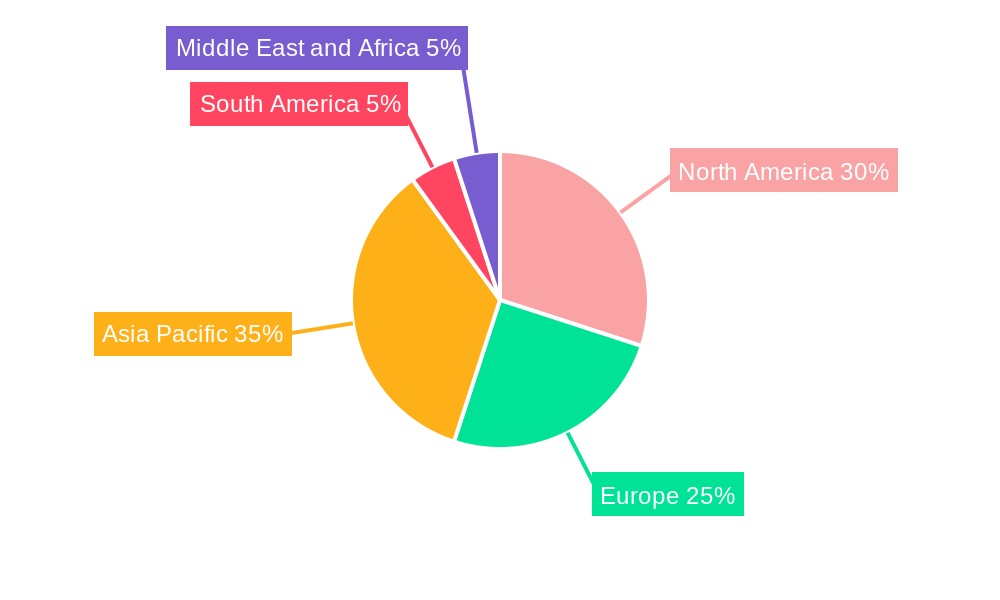
The dominant region for the photographic equipment industry is North America, driven by high consumer spending and a strong culture of professional photography. Within this region, the United States holds the largest market share. Regarding distribution channels, online retail is witnessing faster growth compared to offline retail, attributed to the convenience and broader reach of e-commerce platforms. In terms of product type, the camera segment is the largest, though the lens segment shows promising growth potential.
- Key Drivers for North American Dominance: High consumer spending, established photography culture, strong infrastructure.
- Online Retail Growth Drivers: Convenience, broader reach, competitive pricing.
- Camera Segment Dominance: High demand, technological advancements, diverse applications.
- Lens Segment Growth Potential: Specialized lenses for niche photography, increasing demand for high-quality images.
Photographic Equipment Industry Product Developments
Recent product innovations focus on enhancing image quality, user experience, and versatility. Advancements in sensor technology, AI-powered image processing, and lens designs provide improved image clarity, dynamic range, and autofocus capabilities. Mirrorless cameras are gaining popularity due to their compact size and advanced features. This aligns perfectly with growing consumer preferences for portability and ease of use, enhancing market fit. The introduction of specialized lenses caters to diverse photography needs.
Report Scope & Segmentation Analysis
This report segments the photographic equipment market by distribution channel (online and offline retail) and product type (camera, lens, others). The online retail segment is projected to exhibit a higher growth rate compared to offline retail due to increasing e-commerce adoption. The camera segment, being the largest, is expected to witness steady growth driven by technological advancements and consumer demand. The lens segment is also expected to experience growth fueled by the growing popularity of specialized lenses. The "others" segment includes accessories like tripods, flashes, and filters; its growth aligns with overall market expansion. Each segment presents unique competitive dynamics and growth projections.
Key Drivers of Photographic Equipment Industry Growth
The photographic equipment market is driven by several factors: technological advancements leading to better image quality and features; rising disposable incomes globally increasing the affordability of high-quality equipment; the burgeoning social media and content creation landscape requiring professional-grade photography; and supportive government policies in some regions that encourage technological development and innovation.
Challenges in the Photographic Equipment Industry Sector
The industry faces challenges including intense competition from smartphone cameras offering increasingly sophisticated photography capabilities; rising production costs and supply chain complexities impacting profitability; stringent regulatory requirements adding to operational complexities; and the need to adapt to evolving consumer preferences demanding innovation and value. These factors combined could result in a reduction in overall market growth by an estimated xx% if not properly addressed.
Emerging Opportunities in Photographic Equipment Industry
Emerging opportunities lie in the development of specialized cameras for specific applications (like drone photography, sports photography); the integration of AI and machine learning for enhanced automation and image processing; the exploration of new materials and manufacturing processes for cost reduction and improved durability; and the expansion into new and developing markets where the demand for high-quality photography is growing rapidly.
Leading Players in the Photographic Equipment Industry Market
- Canon Inc
- Nikon Corporation
- Samsung Electronics Co
- FUJIFILM Holdings Corporation
- Leica Camera AG
- Panasonic Corporation
- Sony Corporation
Key Developments in Photographic Equipment Industry Industry
- Jan 2023: Canon Inc. launches its new flagship EOS R5 mirrorless camera.
- Mar 2022: Sony Corporation announces a new range of high-aperture lenses.
- Oct 2021: Nikon Corporation partners with a software company for AI-powered image enhancement.
- (Further key developments to be added)
Strategic Outlook for Photographic Equipment Industry Market
The photographic equipment market is poised for continued growth, driven by ongoing technological advancements, evolving consumer preferences, and the increasing demand for high-quality imagery across various applications. Strategic investments in research and development, targeted marketing campaigns, and expansion into new market segments will be crucial for capturing market share and driving future growth. The market offers significant potential for innovation and expansion, particularly in niche applications and emerging technologies.
Photographic Equipment Industry Segmentation
-
1. Product Type
- 1.1. Camera
- 1.2. Lens
- 1.3. Others
-
2. Distribution Channel
- 2.1. Online Retail
- 2.2. Offline Retail
Photographic Equipment Industry Segmentation By Geography
-
1. North America
- 1.1. United States
- 1.2. Canada
- 1.3. Mexico
- 1.4. Rest of North America
-
2. Europe
- 2.1. United Kingdom
- 2.2. Germany
- 2.3. France
- 2.4. Italy
- 2.5. Russia
- 2.6. Rest of Europe
-
3. Asia Pacific
- 3.1. China
- 3.2. Japan
- 3.3. India
- 3.4. Australia
- 3.5. Rest of Asia Pacific
-
4. South America
- 4.1. Brazil
- 4.2. Argentina
- 4.3. Rest of South America
-
5. Middle East and Africa
- 5.1. South Africa
- 5.2. Saudi Arabia
- 5.3. Rest of Middle East and Africa
Photographic Equipment Industry Regional Market Share
Geographic Coverage of Photographic Equipment Industry
Photographic Equipment Industry REPORT HIGHLIGHTS
| Aspects | Details |
|---|---|
| Study Period | 2020-2034 |
| Base Year | 2025 |
| Estimated Year | 2026 |
| Forecast Period | 2026-2034 |
| Historical Period | 2020-2025 |
| Growth Rate | CAGR of 7.1% from 2020-2034 |
| Segmentation |
|
Table of Contents
- 1. Introduction
- 1.1. Research Scope
- 1.2. Market Segmentation
- 1.3. Research Objective
- 1.4. Definitions and Assumptions
- 2. Executive Summary
- 2.1. Market Snapshot
- 3. Market Dynamics
- 3.1. Market Drivers
- 3.2. Market Restrains
- 3.3. Market Trends
- 3.4. Market Opportunities
- 4. Market Factor Analysis
- 4.1. Porters Five Forces
- 4.1.1. Bargaining Power of Suppliers
- 4.1.2. Bargaining Power of Buyers
- 4.1.3. Threat of New Entrants
- 4.1.4. Threat of Substitutes
- 4.1.5. Competitive Rivalry
- 4.2. PESTEL analysis
- 4.3. BCG Analysis
- 4.3.1. Stars (High Growth, High Market Share)
- 4.3.2. Cash Cows (Low Growth, High Market Share)
- 4.3.3. Question Mark (High Growth, Low Market Share)
- 4.3.4. Dogs (Low Growth, Low Market Share)
- 4.4. Ansoff Matrix Analysis
- 4.5. Supply Chain Analysis
- 4.6. Regulatory Landscape
- 4.7. Current Market Potential and Opportunity Assessment (TAM–SAM–SOM Framework)
- 4.8. RAX Analyst Note
- 4.1. Porters Five Forces
- 5. Market Analysis, Insights and Forecast 2021-2033
- 5.1. Market Analysis, Insights and Forecast - by Product Type
- 5.1.1. Camera
- 5.1.2. Lens
- 5.1.3. Others
- 5.2. Market Analysis, Insights and Forecast - by Distribution Channel
- 5.2.1. Online Retail
- 5.2.2. Offline Retail
- 5.3. Market Analysis, Insights and Forecast - by Region
- 5.3.1. North America
- 5.3.2. Europe
- 5.3.3. Asia Pacific
- 5.3.4. South America
- 5.3.5. Middle East and Africa
- 5.1. Market Analysis, Insights and Forecast - by Product Type
- 6. Global Photographic Equipment Industry Analysis, Insights and Forecast, 2021-2033
- 6.1. Market Analysis, Insights and Forecast - by Product Type
- 6.1.1. Camera
- 6.1.2. Lens
- 6.1.3. Others
- 6.2. Market Analysis, Insights and Forecast - by Distribution Channel
- 6.2.1. Online Retail
- 6.2.2. Offline Retail
- 6.1. Market Analysis, Insights and Forecast - by Product Type
- 7. North America Photographic Equipment Industry Analysis, Insights and Forecast, 2020-2032
- 7.1. Market Analysis, Insights and Forecast - by Product Type
- 7.1.1. Camera
- 7.1.2. Lens
- 7.1.3. Others
- 7.2. Market Analysis, Insights and Forecast - by Distribution Channel
- 7.2.1. Online Retail
- 7.2.2. Offline Retail
- 7.1. Market Analysis, Insights and Forecast - by Product Type
- 8. Europe Photographic Equipment Industry Analysis, Insights and Forecast, 2020-2032
- 8.1. Market Analysis, Insights and Forecast - by Product Type
- 8.1.1. Camera
- 8.1.2. Lens
- 8.1.3. Others
- 8.2. Market Analysis, Insights and Forecast - by Distribution Channel
- 8.2.1. Online Retail
- 8.2.2. Offline Retail
- 8.1. Market Analysis, Insights and Forecast - by Product Type
- 9. Asia Pacific Photographic Equipment Industry Analysis, Insights and Forecast, 2020-2032
- 9.1. Market Analysis, Insights and Forecast - by Product Type
- 9.1.1. Camera
- 9.1.2. Lens
- 9.1.3. Others
- 9.2. Market Analysis, Insights and Forecast - by Distribution Channel
- 9.2.1. Online Retail
- 9.2.2. Offline Retail
- 9.1. Market Analysis, Insights and Forecast - by Product Type
- 10. South America Photographic Equipment Industry Analysis, Insights and Forecast, 2020-2032
- 10.1. Market Analysis, Insights and Forecast - by Product Type
- 10.1.1. Camera
- 10.1.2. Lens
- 10.1.3. Others
- 10.2. Market Analysis, Insights and Forecast - by Distribution Channel
- 10.2.1. Online Retail
- 10.2.2. Offline Retail
- 10.1. Market Analysis, Insights and Forecast - by Product Type
- 11. Middle East and Africa Photographic Equipment Industry Analysis, Insights and Forecast, 2020-2032
- 11.1. Market Analysis, Insights and Forecast - by Product Type
- 11.1.1. Camera
- 11.1.2. Lens
- 11.1.3. Others
- 11.2. Market Analysis, Insights and Forecast - by Distribution Channel
- 11.2.1. Online Retail
- 11.2.2. Offline Retail
- 11.1. Market Analysis, Insights and Forecast - by Product Type
- 12. Competitive Analysis
- 12.1. Company Profiles
- 12.1.1 Canon Inc
- 12.1.1.1. Company Overview
- 12.1.1.2. Products
- 12.1.1.3. Company Financials
- 12.1.1.4. SWOT Analysis
- 12.1.2 Nikon Corporation
- 12.1.2.1. Company Overview
- 12.1.2.2. Products
- 12.1.2.3. Company Financials
- 12.1.2.4. SWOT Analysis
- 12.1.3 Samsung Electronics Co
- 12.1.3.1. Company Overview
- 12.1.3.2. Products
- 12.1.3.3. Company Financials
- 12.1.3.4. SWOT Analysis
- 12.1.4 FUJIFILM Holdings Corporation
- 12.1.4.1. Company Overview
- 12.1.4.2. Products
- 12.1.4.3. Company Financials
- 12.1.4.4. SWOT Analysis
- 12.1.5 Leica Camera AG*List Not Exhaustive
- 12.1.5.1. Company Overview
- 12.1.5.2. Products
- 12.1.5.3. Company Financials
- 12.1.5.4. SWOT Analysis
- 12.1.6 Panasonic Corporation
- 12.1.6.1. Company Overview
- 12.1.6.2. Products
- 12.1.6.3. Company Financials
- 12.1.6.4. SWOT Analysis
- 12.1.7 Sony Corporation
- 12.1.7.1. Company Overview
- 12.1.7.2. Products
- 12.1.7.3. Company Financials
- 12.1.7.4. SWOT Analysis
- 12.1.1 Canon Inc
- 12.2. Market Entropy
- 12.2.1 Company's Key Areas Served
- 12.2.2 Recent Developments
- 12.3. Company Market Share Analysis 2025
- 12.3.1 Top 5 Companies Market Share Analysis
- 12.3.2 Top 3 Companies Market Share Analysis
- 12.4. List of Potential Customers
- 13. Research Methodology
List of Figures
- Figure 1: Global Photographic Equipment Industry Revenue Breakdown (billion, %) by Region 2025 & 2033
- Figure 2: Global Photographic Equipment Industry Volume Breakdown (K Units, %) by Region 2025 & 2033
- Figure 3: North America Photographic Equipment Industry Revenue (billion), by Product Type 2025 & 2033
- Figure 4: North America Photographic Equipment Industry Volume (K Units), by Product Type 2025 & 2033
- Figure 5: North America Photographic Equipment Industry Revenue Share (%), by Product Type 2025 & 2033
- Figure 6: North America Photographic Equipment Industry Volume Share (%), by Product Type 2025 & 2033
- Figure 7: North America Photographic Equipment Industry Revenue (billion), by Distribution Channel 2025 & 2033
- Figure 8: North America Photographic Equipment Industry Volume (K Units), by Distribution Channel 2025 & 2033
- Figure 9: North America Photographic Equipment Industry Revenue Share (%), by Distribution Channel 2025 & 2033
- Figure 10: North America Photographic Equipment Industry Volume Share (%), by Distribution Channel 2025 & 2033
- Figure 11: North America Photographic Equipment Industry Revenue (billion), by Country 2025 & 2033
- Figure 12: North America Photographic Equipment Industry Volume (K Units), by Country 2025 & 2033
- Figure 13: North America Photographic Equipment Industry Revenue Share (%), by Country 2025 & 2033
- Figure 14: North America Photographic Equipment Industry Volume Share (%), by Country 2025 & 2033
- Figure 15: Europe Photographic Equipment Industry Revenue (billion), by Product Type 2025 & 2033
- Figure 16: Europe Photographic Equipment Industry Volume (K Units), by Product Type 2025 & 2033
- Figure 17: Europe Photographic Equipment Industry Revenue Share (%), by Product Type 2025 & 2033
- Figure 18: Europe Photographic Equipment Industry Volume Share (%), by Product Type 2025 & 2033
- Figure 19: Europe Photographic Equipment Industry Revenue (billion), by Distribution Channel 2025 & 2033
- Figure 20: Europe Photographic Equipment Industry Volume (K Units), by Distribution Channel 2025 & 2033
- Figure 21: Europe Photographic Equipment Industry Revenue Share (%), by Distribution Channel 2025 & 2033
- Figure 22: Europe Photographic Equipment Industry Volume Share (%), by Distribution Channel 2025 & 2033
- Figure 23: Europe Photographic Equipment Industry Revenue (billion), by Country 2025 & 2033
- Figure 24: Europe Photographic Equipment Industry Volume (K Units), by Country 2025 & 2033
- Figure 25: Europe Photographic Equipment Industry Revenue Share (%), by Country 2025 & 2033
- Figure 26: Europe Photographic Equipment Industry Volume Share (%), by Country 2025 & 2033
- Figure 27: Asia Pacific Photographic Equipment Industry Revenue (billion), by Product Type 2025 & 2033
- Figure 28: Asia Pacific Photographic Equipment Industry Volume (K Units), by Product Type 2025 & 2033
- Figure 29: Asia Pacific Photographic Equipment Industry Revenue Share (%), by Product Type 2025 & 2033
- Figure 30: Asia Pacific Photographic Equipment Industry Volume Share (%), by Product Type 2025 & 2033
- Figure 31: Asia Pacific Photographic Equipment Industry Revenue (billion), by Distribution Channel 2025 & 2033
- Figure 32: Asia Pacific Photographic Equipment Industry Volume (K Units), by Distribution Channel 2025 & 2033
- Figure 33: Asia Pacific Photographic Equipment Industry Revenue Share (%), by Distribution Channel 2025 & 2033
- Figure 34: Asia Pacific Photographic Equipment Industry Volume Share (%), by Distribution Channel 2025 & 2033
- Figure 35: Asia Pacific Photographic Equipment Industry Revenue (billion), by Country 2025 & 2033
- Figure 36: Asia Pacific Photographic Equipment Industry Volume (K Units), by Country 2025 & 2033
- Figure 37: Asia Pacific Photographic Equipment Industry Revenue Share (%), by Country 2025 & 2033
- Figure 38: Asia Pacific Photographic Equipment Industry Volume Share (%), by Country 2025 & 2033
- Figure 39: South America Photographic Equipment Industry Revenue (billion), by Product Type 2025 & 2033
- Figure 40: South America Photographic Equipment Industry Volume (K Units), by Product Type 2025 & 2033
- Figure 41: South America Photographic Equipment Industry Revenue Share (%), by Product Type 2025 & 2033
- Figure 42: South America Photographic Equipment Industry Volume Share (%), by Product Type 2025 & 2033
- Figure 43: South America Photographic Equipment Industry Revenue (billion), by Distribution Channel 2025 & 2033
- Figure 44: South America Photographic Equipment Industry Volume (K Units), by Distribution Channel 2025 & 2033
- Figure 45: South America Photographic Equipment Industry Revenue Share (%), by Distribution Channel 2025 & 2033
- Figure 46: South America Photographic Equipment Industry Volume Share (%), by Distribution Channel 2025 & 2033
- Figure 47: South America Photographic Equipment Industry Revenue (billion), by Country 2025 & 2033
- Figure 48: South America Photographic Equipment Industry Volume (K Units), by Country 2025 & 2033
- Figure 49: South America Photographic Equipment Industry Revenue Share (%), by Country 2025 & 2033
- Figure 50: South America Photographic Equipment Industry Volume Share (%), by Country 2025 & 2033
- Figure 51: Middle East and Africa Photographic Equipment Industry Revenue (billion), by Product Type 2025 & 2033
- Figure 52: Middle East and Africa Photographic Equipment Industry Volume (K Units), by Product Type 2025 & 2033
- Figure 53: Middle East and Africa Photographic Equipment Industry Revenue Share (%), by Product Type 2025 & 2033
- Figure 54: Middle East and Africa Photographic Equipment Industry Volume Share (%), by Product Type 2025 & 2033
- Figure 55: Middle East and Africa Photographic Equipment Industry Revenue (billion), by Distribution Channel 2025 & 2033
- Figure 56: Middle East and Africa Photographic Equipment Industry Volume (K Units), by Distribution Channel 2025 & 2033
- Figure 57: Middle East and Africa Photographic Equipment Industry Revenue Share (%), by Distribution Channel 2025 & 2033
- Figure 58: Middle East and Africa Photographic Equipment Industry Volume Share (%), by Distribution Channel 2025 & 2033
- Figure 59: Middle East and Africa Photographic Equipment Industry Revenue (billion), by Country 2025 & 2033
- Figure 60: Middle East and Africa Photographic Equipment Industry Volume (K Units), by Country 2025 & 2033
- Figure 61: Middle East and Africa Photographic Equipment Industry Revenue Share (%), by Country 2025 & 2033
- Figure 62: Middle East and Africa Photographic Equipment Industry Volume Share (%), by Country 2025 & 2033
List of Tables
- Table 1: Global Photographic Equipment Industry Revenue billion Forecast, by Product Type 2020 & 2033
- Table 2: Global Photographic Equipment Industry Volume K Units Forecast, by Product Type 2020 & 2033
- Table 3: Global Photographic Equipment Industry Revenue billion Forecast, by Distribution Channel 2020 & 2033
- Table 4: Global Photographic Equipment Industry Volume K Units Forecast, by Distribution Channel 2020 & 2033
- Table 5: Global Photographic Equipment Industry Revenue billion Forecast, by Region 2020 & 2033
- Table 6: Global Photographic Equipment Industry Volume K Units Forecast, by Region 2020 & 2033
- Table 7: Global Photographic Equipment Industry Revenue billion Forecast, by Product Type 2020 & 2033
- Table 8: Global Photographic Equipment Industry Volume K Units Forecast, by Product Type 2020 & 2033
- Table 9: Global Photographic Equipment Industry Revenue billion Forecast, by Distribution Channel 2020 & 2033
- Table 10: Global Photographic Equipment Industry Volume K Units Forecast, by Distribution Channel 2020 & 2033
- Table 11: Global Photographic Equipment Industry Revenue billion Forecast, by Country 2020 & 2033
- Table 12: Global Photographic Equipment Industry Volume K Units Forecast, by Country 2020 & 2033
- Table 13: United States Photographic Equipment Industry Revenue (billion) Forecast, by Application 2020 & 2033
- Table 14: United States Photographic Equipment Industry Volume (K Units) Forecast, by Application 2020 & 2033
- Table 15: Canada Photographic Equipment Industry Revenue (billion) Forecast, by Application 2020 & 2033
- Table 16: Canada Photographic Equipment Industry Volume (K Units) Forecast, by Application 2020 & 2033
- Table 17: Mexico Photographic Equipment Industry Revenue (billion) Forecast, by Application 2020 & 2033
- Table 18: Mexico Photographic Equipment Industry Volume (K Units) Forecast, by Application 2020 & 2033
- Table 19: Rest of North America Photographic Equipment Industry Revenue (billion) Forecast, by Application 2020 & 2033
- Table 20: Rest of North America Photographic Equipment Industry Volume (K Units) Forecast, by Application 2020 & 2033
- Table 21: Global Photographic Equipment Industry Revenue billion Forecast, by Product Type 2020 & 2033
- Table 22: Global Photographic Equipment Industry Volume K Units Forecast, by Product Type 2020 & 2033
- Table 23: Global Photographic Equipment Industry Revenue billion Forecast, by Distribution Channel 2020 & 2033
- Table 24: Global Photographic Equipment Industry Volume K Units Forecast, by Distribution Channel 2020 & 2033
- Table 25: Global Photographic Equipment Industry Revenue billion Forecast, by Country 2020 & 2033
- Table 26: Global Photographic Equipment Industry Volume K Units Forecast, by Country 2020 & 2033
- Table 27: United Kingdom Photographic Equipment Industry Revenue (billion) Forecast, by Application 2020 & 2033
- Table 28: United Kingdom Photographic Equipment Industry Volume (K Units) Forecast, by Application 2020 & 2033
- Table 29: Germany Photographic Equipment Industry Revenue (billion) Forecast, by Application 2020 & 2033
- Table 30: Germany Photographic Equipment Industry Volume (K Units) Forecast, by Application 2020 & 2033
- Table 31: France Photographic Equipment Industry Revenue (billion) Forecast, by Application 2020 & 2033
- Table 32: France Photographic Equipment Industry Volume (K Units) Forecast, by Application 2020 & 2033
- Table 33: Italy Photographic Equipment Industry Revenue (billion) Forecast, by Application 2020 & 2033
- Table 34: Italy Photographic Equipment Industry Volume (K Units) Forecast, by Application 2020 & 2033
- Table 35: Russia Photographic Equipment Industry Revenue (billion) Forecast, by Application 2020 & 2033
- Table 36: Russia Photographic Equipment Industry Volume (K Units) Forecast, by Application 2020 & 2033
- Table 37: Rest of Europe Photographic Equipment Industry Revenue (billion) Forecast, by Application 2020 & 2033
- Table 38: Rest of Europe Photographic Equipment Industry Volume (K Units) Forecast, by Application 2020 & 2033
- Table 39: Global Photographic Equipment Industry Revenue billion Forecast, by Product Type 2020 & 2033
- Table 40: Global Photographic Equipment Industry Volume K Units Forecast, by Product Type 2020 & 2033
- Table 41: Global Photographic Equipment Industry Revenue billion Forecast, by Distribution Channel 2020 & 2033
- Table 42: Global Photographic Equipment Industry Volume K Units Forecast, by Distribution Channel 2020 & 2033
- Table 43: Global Photographic Equipment Industry Revenue billion Forecast, by Country 2020 & 2033
- Table 44: Global Photographic Equipment Industry Volume K Units Forecast, by Country 2020 & 2033
- Table 45: China Photographic Equipment Industry Revenue (billion) Forecast, by Application 2020 & 2033
- Table 46: China Photographic Equipment Industry Volume (K Units) Forecast, by Application 2020 & 2033
- Table 47: Japan Photographic Equipment Industry Revenue (billion) Forecast, by Application 2020 & 2033
- Table 48: Japan Photographic Equipment Industry Volume (K Units) Forecast, by Application 2020 & 2033
- Table 49: India Photographic Equipment Industry Revenue (billion) Forecast, by Application 2020 & 2033
- Table 50: India Photographic Equipment Industry Volume (K Units) Forecast, by Application 2020 & 2033
- Table 51: Australia Photographic Equipment Industry Revenue (billion) Forecast, by Application 2020 & 2033
- Table 52: Australia Photographic Equipment Industry Volume (K Units) Forecast, by Application 2020 & 2033
- Table 53: Rest of Asia Pacific Photographic Equipment Industry Revenue (billion) Forecast, by Application 2020 & 2033
- Table 54: Rest of Asia Pacific Photographic Equipment Industry Volume (K Units) Forecast, by Application 2020 & 2033
- Table 55: Global Photographic Equipment Industry Revenue billion Forecast, by Product Type 2020 & 2033
- Table 56: Global Photographic Equipment Industry Volume K Units Forecast, by Product Type 2020 & 2033
- Table 57: Global Photographic Equipment Industry Revenue billion Forecast, by Distribution Channel 2020 & 2033
- Table 58: Global Photographic Equipment Industry Volume K Units Forecast, by Distribution Channel 2020 & 2033
- Table 59: Global Photographic Equipment Industry Revenue billion Forecast, by Country 2020 & 2033
- Table 60: Global Photographic Equipment Industry Volume K Units Forecast, by Country 2020 & 2033
- Table 61: Brazil Photographic Equipment Industry Revenue (billion) Forecast, by Application 2020 & 2033
- Table 62: Brazil Photographic Equipment Industry Volume (K Units) Forecast, by Application 2020 & 2033
- Table 63: Argentina Photographic Equipment Industry Revenue (billion) Forecast, by Application 2020 & 2033
- Table 64: Argentina Photographic Equipment Industry Volume (K Units) Forecast, by Application 2020 & 2033
- Table 65: Rest of South America Photographic Equipment Industry Revenue (billion) Forecast, by Application 2020 & 2033
- Table 66: Rest of South America Photographic Equipment Industry Volume (K Units) Forecast, by Application 2020 & 2033
- Table 67: Global Photographic Equipment Industry Revenue billion Forecast, by Product Type 2020 & 2033
- Table 68: Global Photographic Equipment Industry Volume K Units Forecast, by Product Type 2020 & 2033
- Table 69: Global Photographic Equipment Industry Revenue billion Forecast, by Distribution Channel 2020 & 2033
- Table 70: Global Photographic Equipment Industry Volume K Units Forecast, by Distribution Channel 2020 & 2033
- Table 71: Global Photographic Equipment Industry Revenue billion Forecast, by Country 2020 & 2033
- Table 72: Global Photographic Equipment Industry Volume K Units Forecast, by Country 2020 & 2033
- Table 73: South Africa Photographic Equipment Industry Revenue (billion) Forecast, by Application 2020 & 2033
- Table 74: South Africa Photographic Equipment Industry Volume (K Units) Forecast, by Application 2020 & 2033
- Table 75: Saudi Arabia Photographic Equipment Industry Revenue (billion) Forecast, by Application 2020 & 2033
- Table 76: Saudi Arabia Photographic Equipment Industry Volume (K Units) Forecast, by Application 2020 & 2033
- Table 77: Rest of Middle East and Africa Photographic Equipment Industry Revenue (billion) Forecast, by Application 2020 & 2033
- Table 78: Rest of Middle East and Africa Photographic Equipment Industry Volume (K Units) Forecast, by Application 2020 & 2033
Frequently Asked Questions
1. What is the projected Compound Annual Growth Rate (CAGR) of the Photographic Equipment Industry?
The projected CAGR is approximately 7.1%.
2. Which companies are prominent players in the Photographic Equipment Industry?
Key companies in the market include Canon Inc, Nikon Corporation, Samsung Electronics Co, FUJIFILM Holdings Corporation, Leica Camera AG*List Not Exhaustive, Panasonic Corporation, Sony Corporation.
3. What are the main segments of the Photographic Equipment Industry?
The market segments include Product Type, Distribution Channel.
4. Can you provide details about the market size?
The market size is estimated to be USD 6.5 billion as of 2022.
5. What are some drivers contributing to market growth?
Fast Fashion Trend; Inflating Income Level of Individuals.
6. What are the notable trends driving market growth?
Increasing sale of Photography Equipment’s from Online Retailing Channels.
7. Are there any restraints impacting market growth?
The Presence Of Counterfeit Products.
8. Can you provide examples of recent developments in the market?
N/A
9. What pricing options are available for accessing the report?
Pricing options include single-user, multi-user, and enterprise licenses priced at USD 4750, USD 5250, and USD 8750 respectively.
10. Is the market size provided in terms of value or volume?
The market size is provided in terms of value, measured in billion and volume, measured in K Units.
11. Are there any specific market keywords associated with the report?
Yes, the market keyword associated with the report is "Photographic Equipment Industry," which aids in identifying and referencing the specific market segment covered.
12. How do I determine which pricing option suits my needs best?
The pricing options vary based on user requirements and access needs. Individual users may opt for single-user licenses, while businesses requiring broader access may choose multi-user or enterprise licenses for cost-effective access to the report.
13. Are there any additional resources or data provided in the Photographic Equipment Industry report?
While the report offers comprehensive insights, it's advisable to review the specific contents or supplementary materials provided to ascertain if additional resources or data are available.
14. How can I stay updated on further developments or reports in the Photographic Equipment Industry?
To stay informed about further developments, trends, and reports in the Photographic Equipment Industry, consider subscribing to industry newsletters, following relevant companies and organizations, or regularly checking reputable industry news sources and publications.
Methodology
Step 1 - Identification of Relevant Samples Size from Population Database


Step 2 - Approaches for Defining Global Market Size (Value, Volume* & Price*)

Note*: In applicable scenarios
Step 3 - Data Sources
Primary Research
- Web Analytics
- Survey Reports
- Research Institute
- Latest Research Reports
- Opinion Leaders
Secondary Research
- Annual Reports
- White Paper
- Latest Press Release
- Industry Association
- Paid Database
- Investor Presentations

Step 4 - Data Triangulation
Involves using different sources of information in order to increase the validity of a study
These sources are likely to be stakeholders in a program - participants, other researchers, program staff, other community members, and so on.
Then we put all data in single framework & apply various statistical tools to find out the dynamic on the market.
During the analysis stage, feedback from the stakeholder groups would be compared to determine areas of agreement as well as areas of divergence