
Key Insights
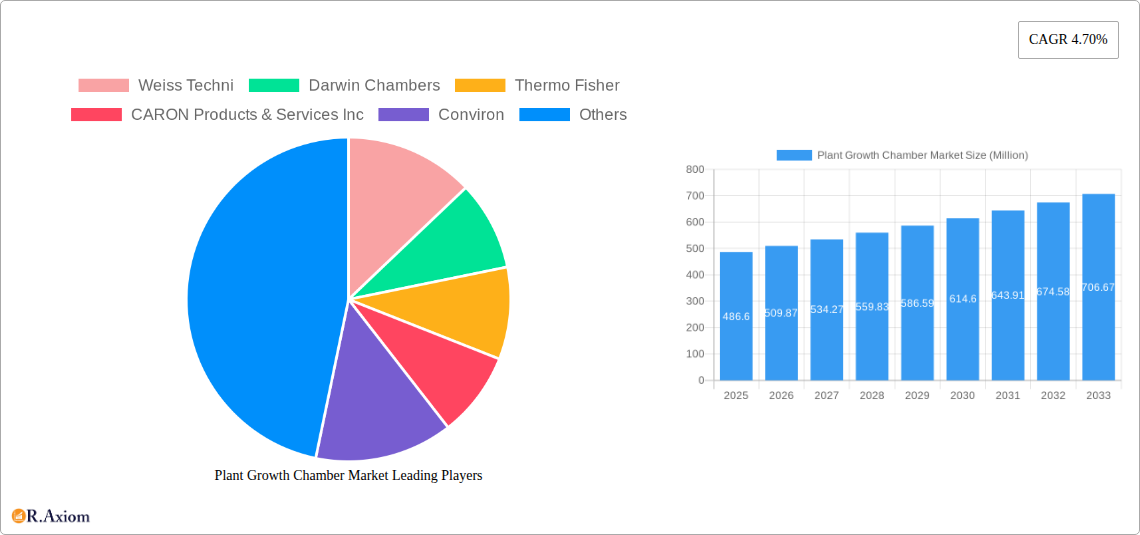
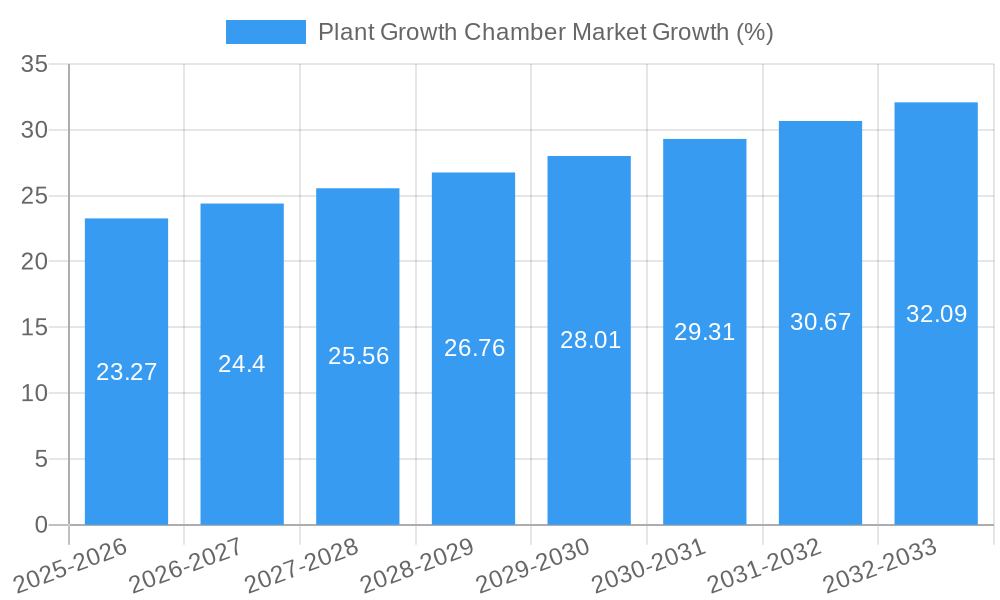
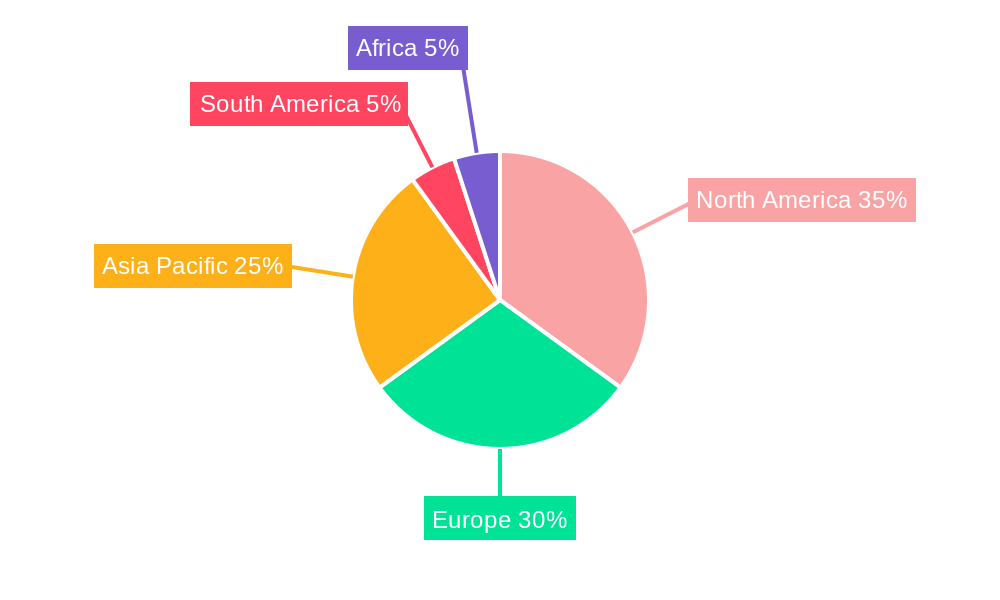
The global Plant Growth Chamber market, valued at $486.60 million in 2025, is projected to experience robust growth, driven by increasing demand for controlled environment agriculture (CEA) and advancements in plant science research. The market's Compound Annual Growth Rate (CAGR) of 4.70% from 2025 to 2033 indicates a significant expansion, fueled by several key factors. The rising adoption of precision agriculture techniques, coupled with the need for year-round crop production irrespective of climatic conditions, is boosting the demand for plant growth chambers across diverse applications. The market is segmented by equipment type (reach-in and walk-in chambers), application (short and tall plants), and function (plant growth, seed germination, environmental optimization, and tissue culture). Reach-in chambers currently dominate the market due to their affordability and suitability for smaller-scale research and cultivation, while walk-in chambers cater to larger-scale operations and research facilities. The increasing focus on environmental optimization within chambers, incorporating features like precise climate control and automated monitoring systems, is a prominent trend. Further driving market growth is the expanding application of plant growth chambers in pharmaceutical research, particularly for the production of medicinal plants and other valuable bioactive compounds. Geographic expansion is another contributing factor. While North America and Europe currently hold significant market shares, the Asia-Pacific region is anticipated to witness substantial growth due to the rising investments in agricultural technology and the increasing demand for high-quality agricultural produce.
However, the market faces certain restraints. The high initial investment cost associated with purchasing and maintaining advanced plant growth chambers can be a barrier to entry for smaller businesses. Furthermore, the need for skilled personnel to operate and maintain these complex systems presents a challenge, particularly in regions with limited technical expertise. Despite these challenges, the long-term benefits of enhanced crop yields, improved product quality, and reduced reliance on unpredictable weather conditions are expected to propel the continued growth of the plant growth chamber market throughout the forecast period. The competitive landscape features both established players like Thermo Fisher and Percival Scientific, as well as specialized companies focusing on niche applications and geographical markets, resulting in a dynamic and innovative market.
Plant Growth Chamber Market: A Comprehensive Report (2019-2033)
This detailed report provides a comprehensive analysis of the Plant Growth Chamber market, offering actionable insights for stakeholders across the industry. With a study period spanning 2019-2033, a base year of 2025, and a forecast period of 2025-2033, this report leverages historical data (2019-2024) to project future market trends. The report's value exceeds $XX Million in 2025 and is projected to reach $XX Million by 2033, exhibiting a CAGR of XX%.
This report covers various market segments, including Equipment Type (Reach-in, Walk-in), Application (Short Plants, Tall Plants), and Function (Plant Growth, Seed Germination, Environment Optimization, Tissue Culture), offering granular insights into market dynamics. Key players such as Weiss Techni, Darwin Chambers, Thermo Fisher, Caron Products & Services Inc, Conviron, Aralab, Percival Scientific Inc, Brs Bvba, BINDER GmbH, Hettich Benelux BV, Saveer Biotech Limited, and Freezers India are analyzed for their market share, strategies, and recent developments.
Plant Growth Chamber Market Concentration & Innovation
The Plant Growth Chamber market exhibits a moderately concentrated landscape, with a few major players holding significant market share. The top five companies, including Thermo Fisher, Conviron, Percival Scientific, and Darwin Chambers, collectively account for approximately XX% of the global market in 2025. However, the market also features several smaller, specialized players catering to niche applications or geographical regions.
Innovation within the sector is driven by the need for increased precision, automation, and data integration in plant growth studies. The development of advanced control systems, LED lighting solutions, and sophisticated environmental monitoring capabilities are key innovation drivers. Regulatory frameworks, particularly those related to environmental standards and safety, also significantly influence market development. Substitutes for plant growth chambers, such as greenhouses and field trials, exist but are often less controlled and less efficient for specific research applications. End-user trends are shifting towards higher levels of automation and data analysis, creating opportunities for technology-driven solutions.
Mergers and acquisitions (M&A) activity is a notable characteristic of this industry. Recent examples include the May 2021 merger of Weiss Umwelttechnik GmbH and Vötsch Industrietechnik GmbH, which significantly strengthened their position in the environmental simulation market. The August 2021 acquisition of Bigneat by Caron Products & Services Inc. broadened Caron's product portfolio. These deals indicate a consolidation trend within the industry, driven by the need for enhanced scale, technological expertise, and broader market reach. The total value of M&A deals in the Plant Growth Chamber market from 2019 to 2024 was estimated to be approximately $XX Million.
Plant Growth Chamber Market Industry Trends & Insights
The Plant Growth Chamber market is experiencing robust growth, fueled by several key factors. The increasing demand for controlled environment agriculture and plant research within the pharmaceutical, biotech, and agricultural sectors is a significant driver. Advances in sensor technologies, data analytics, and automation are enhancing the capabilities of plant growth chambers and expanding their applications. Rising research investment, particularly in areas like precision agriculture and genetic modification, is fostering the adoption of advanced plant growth chambers. Consumer preferences are also shifting toward sustainably produced food and environmentally friendly agricultural practices, further fueling market demand. The market exhibits a competitive landscape, with both established players and emerging technology providers competing for market share. This leads to continuous innovation and the development of new and improved products. Market penetration of advanced features such as remote monitoring and automated control systems is continuously increasing, driven by the increasing demand for data-driven insights and optimized plant growth.
Dominant Markets & Segments in Plant Growth Chamber Market
Dominant Region: North America currently holds the largest market share due to robust research funding and a well-established life sciences sector. Europe and Asia-Pacific are also major markets, showing significant growth potential.
Dominant Segment (Equipment Type): Reach-in chambers currently dominate the market due to their cost-effectiveness and suitability for a wide range of applications. However, the demand for walk-in chambers is also growing, particularly in large research facilities and commercial applications.
Dominant Segment (Application): Short plants are currently the most dominant application, driven by the large demand from horticultural research and commercial applications. However, applications for tall plants are steadily growing, driven by the increasing demand for controlled-environment growth of taller crops.
Dominant Segment (Function): Plant Growth is the most dominant function followed closely by Tissue Culture.
Key Drivers for Dominant Segments:
- North America: High research funding, advanced infrastructure, and a strong presence of major industry players.
- Reach-in Chambers: Lower initial investment, ease of use, and suitability for smaller research labs.
- Short Plants: High demand from horticultural research, commercial cultivation, and other applications.
- Plant Growth: Fundamental requirement across research, development, and production processes.
Plant Growth Chamber Market Product Developments
Recent product developments emphasize improved control systems, energy efficiency, and integrated data management capabilities. Manufacturers are focusing on LED lighting technologies due to their energy efficiency and spectral tunability. The integration of IoT sensors and cloud-based data platforms provides remote monitoring and control, enhancing research efficiency. These advancements enhance the accuracy and precision of environmental parameters, leading to improved plant growth and research outcomes. The market fit is strong due to the ever-increasing need for data-driven decisions and automation in plant science and agriculture.
Report Scope & Segmentation Analysis
Equipment Type: The report segments the market based on equipment type into Reach-in and Walk-in chambers. Reach-in chambers are projected to maintain a larger market share in the forecast period due to lower costs and suitability for smaller research facilities. However, walk-in chambers are expected to register higher growth due to increased demands from large-scale research and commercial operations.
Application: The market is segmented by application into Short Plants and Tall Plants. Short plants currently hold a larger market share, but the segment for tall plants is expected to experience faster growth due to increasing demand for specific crops and research applications.
Function: The market is segmented into Plant Growth, Seed Germination, Environment Optimization, and Tissue Culture. Plant growth chambers constitute the largest segment, but tissue culture applications are showing a rapid growth rate.
Key Drivers of Plant Growth Chamber Market Growth
Technological advancements such as LED lighting, precise control systems, and IoT integration drive market growth. The increasing need for controlled-environment agriculture and plant research fuels demand. Favorable government policies and funding initiatives for agricultural research and development further stimulate market growth.
Challenges in the Plant Growth Chamber Market Sector
High initial investment costs can be a barrier for some users, particularly smaller research facilities. Supply chain disruptions and fluctuations in the cost of raw materials can impact market growth. Intense competition from several established and emerging players necessitates continuous innovation and differentiation strategies.
Emerging Opportunities in Plant Growth Chamber Market
Expansion into emerging markets with a growing demand for advanced agricultural technologies presents significant opportunities. The integration of AI and machine learning in plant growth chamber management can further optimize resource utilization and improve productivity. The development of specialized chambers for specific plant types and research applications creates new market niches.
Leading Players in the Plant Growth Chamber Market Market
- Weiss Techni
- Darwin Chambers
- Thermo Fisher
- CARON Products & Services Inc
- Conviron
- Aralab
- Percival Scientific Inc
- Brs Bvba
- BINDER GmbH
- Hettich Benelux BV
- Saveer Biotech Limited
- Freezers India
Key Developments in Plant Growth Chamber Market Industry
- January 2022: Conviron launched the EVO series of plant growth chambers, featuring improved LED lighting and spatial uniformity, enhancing its competitiveness and catering to the market need for advanced and precise solutions.
- August 2021: Caron's acquisition of Bigneat broadened its product portfolio and enhanced its position in the laboratory equipment market, indicating a strategic move towards consolidation and diversification.
- May 2021: The merger of Weiss Umwelttechnik GmbH and Vötsch Industrietechnik GmbH consolidated their market share and expertise in environmental simulation and thermal engineering, signifying a trend toward industry consolidation.
Strategic Outlook for Plant Growth Chamber Market Market
The Plant Growth Chamber market is poised for continued growth, driven by technological innovation, increasing research funding, and a growing global demand for sustainable agricultural practices. Emerging technologies like AI and machine learning, along with the increasing adoption of controlled-environment agriculture, will shape the market's trajectory. The focus on energy efficiency and sustainability will further drive the development of innovative and eco-friendly plant growth chamber solutions. The market's long-term growth potential remains significant, with opportunities for expansion across various sectors and geographical regions.
Plant Growth Chamber Market Segmentation
- 1. Production Analysis
- 2. Consumption Analysis
- 3. Import Market Analysis (Value & Volume)
- 4. Export Market Analysis (Value & Volume)
- 5. Price Trend Analysis
Plant Growth Chamber Market Segmentation By Geography
-
1. North America
- 1.1. United States
- 1.2. Canada
- 1.3. Mexico
-
2. South America
- 2.1. Brazil
- 2.2. Argentina
- 2.3. Rest of South America
-
3. Europe
- 3.1. United Kingdom
- 3.2. Germany
- 3.3. France
- 3.4. Italy
- 3.5. Spain
- 3.6. Russia
- 3.7. Benelux
- 3.8. Nordics
- 3.9. Rest of Europe
-
4. Middle East & Africa
- 4.1. Turkey
- 4.2. Israel
- 4.3. GCC
- 4.4. North Africa
- 4.5. South Africa
- 4.6. Rest of Middle East & Africa
-
5. Asia Pacific
- 5.1. China
- 5.2. India
- 5.3. Japan
- 5.4. South Korea
- 5.5. ASEAN
- 5.6. Oceania
- 5.7. Rest of Asia Pacific
Plant Growth Chamber Market REPORT HIGHLIGHTS
| Aspects | Details |
|---|---|
| Study Period | 2019-2033 |
| Base Year | 2024 |
| Estimated Year | 2025 |
| Forecast Period | 2025-2033 |
| Historical Period | 2019-2024 |
| Growth Rate | CAGR of 4.70% from 2019-2033 |
| Segmentation |
|
Table of Contents
- 1. Introduction
- 1.1. Research Scope
- 1.2. Market Segmentation
- 1.3. Research Methodology
- 1.4. Definitions and Assumptions
- 2. Executive Summary
- 2.1. Introduction
- 3. Market Dynamics
- 3.1. Introduction
- 3.2. Market Drivers
- 3.2.1. Seed Treatment As A Solution To Enhance Yield; Growing Awareness For Seed Treatment Among The Farmers; Rising Trend Of Organic Farming
- 3.3. Market Restrains
- 3.3.1. Limitations Across Farm-Level Seed Treatment; Rising Environmental Concerns
- 3.4. Market Trends
- 3.4.1. Increasing Demand for Food and Decreasing Arable Land
- 4. Market Factor Analysis
- 4.1. Porters Five Forces
- 4.2. Supply/Value Chain
- 4.3. PESTEL analysis
- 4.4. Market Entropy
- 4.5. Patent/Trademark Analysis
- 5. Global Plant Growth Chamber Market Analysis, Insights and Forecast, 2019-2031
- 5.1. Market Analysis, Insights and Forecast - by Production Analysis
- 5.2. Market Analysis, Insights and Forecast - by Consumption Analysis
- 5.3. Market Analysis, Insights and Forecast - by Import Market Analysis (Value & Volume)
- 5.4. Market Analysis, Insights and Forecast - by Export Market Analysis (Value & Volume)
- 5.5. Market Analysis, Insights and Forecast - by Price Trend Analysis
- 5.6. Market Analysis, Insights and Forecast - by Region
- 5.6.1. North America
- 5.6.2. South America
- 5.6.3. Europe
- 5.6.4. Middle East & Africa
- 5.6.5. Asia Pacific
- 5.1. Market Analysis, Insights and Forecast - by Production Analysis
- 6. North America Plant Growth Chamber Market Analysis, Insights and Forecast, 2019-2031
- 6.1. Market Analysis, Insights and Forecast - by Production Analysis
- 6.2. Market Analysis, Insights and Forecast - by Consumption Analysis
- 6.3. Market Analysis, Insights and Forecast - by Import Market Analysis (Value & Volume)
- 6.4. Market Analysis, Insights and Forecast - by Export Market Analysis (Value & Volume)
- 6.5. Market Analysis, Insights and Forecast - by Price Trend Analysis
- 6.1. Market Analysis, Insights and Forecast - by Production Analysis
- 7. South America Plant Growth Chamber Market Analysis, Insights and Forecast, 2019-2031
- 7.1. Market Analysis, Insights and Forecast - by Production Analysis
- 7.2. Market Analysis, Insights and Forecast - by Consumption Analysis
- 7.3. Market Analysis, Insights and Forecast - by Import Market Analysis (Value & Volume)
- 7.4. Market Analysis, Insights and Forecast - by Export Market Analysis (Value & Volume)
- 7.5. Market Analysis, Insights and Forecast - by Price Trend Analysis
- 7.1. Market Analysis, Insights and Forecast - by Production Analysis
- 8. Europe Plant Growth Chamber Market Analysis, Insights and Forecast, 2019-2031
- 8.1. Market Analysis, Insights and Forecast - by Production Analysis
- 8.2. Market Analysis, Insights and Forecast - by Consumption Analysis
- 8.3. Market Analysis, Insights and Forecast - by Import Market Analysis (Value & Volume)
- 8.4. Market Analysis, Insights and Forecast - by Export Market Analysis (Value & Volume)
- 8.5. Market Analysis, Insights and Forecast - by Price Trend Analysis
- 8.1. Market Analysis, Insights and Forecast - by Production Analysis
- 9. Middle East & Africa Plant Growth Chamber Market Analysis, Insights and Forecast, 2019-2031
- 9.1. Market Analysis, Insights and Forecast - by Production Analysis
- 9.2. Market Analysis, Insights and Forecast - by Consumption Analysis
- 9.3. Market Analysis, Insights and Forecast - by Import Market Analysis (Value & Volume)
- 9.4. Market Analysis, Insights and Forecast - by Export Market Analysis (Value & Volume)
- 9.5. Market Analysis, Insights and Forecast - by Price Trend Analysis
- 9.1. Market Analysis, Insights and Forecast - by Production Analysis
- 10. Asia Pacific Plant Growth Chamber Market Analysis, Insights and Forecast, 2019-2031
- 10.1. Market Analysis, Insights and Forecast - by Production Analysis
- 10.2. Market Analysis, Insights and Forecast - by Consumption Analysis
- 10.3. Market Analysis, Insights and Forecast - by Import Market Analysis (Value & Volume)
- 10.4. Market Analysis, Insights and Forecast - by Export Market Analysis (Value & Volume)
- 10.5. Market Analysis, Insights and Forecast - by Price Trend Analysis
- 10.1. Market Analysis, Insights and Forecast - by Production Analysis
- 11. North America Plant Growth Chamber Market Analysis, Insights and Forecast, 2019-2031
- 11.1. Market Analysis, Insights and Forecast - By Country/Sub-region
- 11.1.1 United States
- 11.1.2 Canada
- 11.1.3 Mexico
- 11.1.4 Rest of North America
- 12. Europe Plant Growth Chamber Market Analysis, Insights and Forecast, 2019-2031
- 12.1. Market Analysis, Insights and Forecast - By Country/Sub-region
- 12.1.1 Germany
- 12.1.2 United Kingdom
- 12.1.3 France
- 12.1.4 Italy
- 12.1.5 Russia
- 12.1.6 Spain
- 12.1.7 Rest of Europe
- 13. Asia Pacific Plant Growth Chamber Market Analysis, Insights and Forecast, 2019-2031
- 13.1. Market Analysis, Insights and Forecast - By Country/Sub-region
- 13.1.1 China
- 13.1.2 Japan
- 13.1.3 India
- 13.1.4 Australia
- 13.1.5 Rest of Asia Pacific
- 14. South America Plant Growth Chamber Market Analysis, Insights and Forecast, 2019-2031
- 14.1. Market Analysis, Insights and Forecast - By Country/Sub-region
- 14.1.1 Brazil
- 14.1.2 Argentina
- 14.1.3 Rest of South America
- 15. Africa Plant Growth Chamber Market Analysis, Insights and Forecast, 2019-2031
- 15.1. Market Analysis, Insights and Forecast - By Country/Sub-region
- 15.1.1 South Africa
- 15.1.2 Rest of Africa
- 16. Competitive Analysis
- 16.1. Global Market Share Analysis 2024
- 16.2. Company Profiles
- 16.2.1 Weiss Techni
- 16.2.1.1. Overview
- 16.2.1.2. Products
- 16.2.1.3. SWOT Analysis
- 16.2.1.4. Recent Developments
- 16.2.1.5. Financials (Based on Availability)
- 16.2.2 Darwin Chambers
- 16.2.2.1. Overview
- 16.2.2.2. Products
- 16.2.2.3. SWOT Analysis
- 16.2.2.4. Recent Developments
- 16.2.2.5. Financials (Based on Availability)
- 16.2.3 Thermo Fisher
- 16.2.3.1. Overview
- 16.2.3.2. Products
- 16.2.3.3. SWOT Analysis
- 16.2.3.4. Recent Developments
- 16.2.3.5. Financials (Based on Availability)
- 16.2.4 CARON Products & Services Inc
- 16.2.4.1. Overview
- 16.2.4.2. Products
- 16.2.4.3. SWOT Analysis
- 16.2.4.4. Recent Developments
- 16.2.4.5. Financials (Based on Availability)
- 16.2.5 Conviron
- 16.2.5.1. Overview
- 16.2.5.2. Products
- 16.2.5.3. SWOT Analysis
- 16.2.5.4. Recent Developments
- 16.2.5.5. Financials (Based on Availability)
- 16.2.6 Aralab
- 16.2.6.1. Overview
- 16.2.6.2. Products
- 16.2.6.3. SWOT Analysis
- 16.2.6.4. Recent Developments
- 16.2.6.5. Financials (Based on Availability)
- 16.2.7 Percival Scientific Inc
- 16.2.7.1. Overview
- 16.2.7.2. Products
- 16.2.7.3. SWOT Analysis
- 16.2.7.4. Recent Developments
- 16.2.7.5. Financials (Based on Availability)
- 16.2.8 Brs Bvba
- 16.2.8.1. Overview
- 16.2.8.2. Products
- 16.2.8.3. SWOT Analysis
- 16.2.8.4. Recent Developments
- 16.2.8.5. Financials (Based on Availability)
- 16.2.9 BINDER GmbH
- 16.2.9.1. Overview
- 16.2.9.2. Products
- 16.2.9.3. SWOT Analysis
- 16.2.9.4. Recent Developments
- 16.2.9.5. Financials (Based on Availability)
- 16.2.10 Hettich Benelux BV
- 16.2.10.1. Overview
- 16.2.10.2. Products
- 16.2.10.3. SWOT Analysis
- 16.2.10.4. Recent Developments
- 16.2.10.5. Financials (Based on Availability)
- 16.2.11 Saveer Biotech Limited
- 16.2.11.1. Overview
- 16.2.11.2. Products
- 16.2.11.3. SWOT Analysis
- 16.2.11.4. Recent Developments
- 16.2.11.5. Financials (Based on Availability)
- 16.2.12 Freezers India
- 16.2.12.1. Overview
- 16.2.12.2. Products
- 16.2.12.3. SWOT Analysis
- 16.2.12.4. Recent Developments
- 16.2.12.5. Financials (Based on Availability)
- 16.2.1 Weiss Techni
List of Figures
- Figure 1: Global Plant Growth Chamber Market Revenue Breakdown (Million, %) by Region 2024 & 2032
- Figure 2: North America Plant Growth Chamber Market Revenue (Million), by Country 2024 & 2032
- Figure 3: North America Plant Growth Chamber Market Revenue Share (%), by Country 2024 & 2032
- Figure 4: Europe Plant Growth Chamber Market Revenue (Million), by Country 2024 & 2032
- Figure 5: Europe Plant Growth Chamber Market Revenue Share (%), by Country 2024 & 2032
- Figure 6: Asia Pacific Plant Growth Chamber Market Revenue (Million), by Country 2024 & 2032
- Figure 7: Asia Pacific Plant Growth Chamber Market Revenue Share (%), by Country 2024 & 2032
- Figure 8: South America Plant Growth Chamber Market Revenue (Million), by Country 2024 & 2032
- Figure 9: South America Plant Growth Chamber Market Revenue Share (%), by Country 2024 & 2032
- Figure 10: Africa Plant Growth Chamber Market Revenue (Million), by Country 2024 & 2032
- Figure 11: Africa Plant Growth Chamber Market Revenue Share (%), by Country 2024 & 2032
- Figure 12: North America Plant Growth Chamber Market Revenue (Million), by Production Analysis 2024 & 2032
- Figure 13: North America Plant Growth Chamber Market Revenue Share (%), by Production Analysis 2024 & 2032
- Figure 14: North America Plant Growth Chamber Market Revenue (Million), by Consumption Analysis 2024 & 2032
- Figure 15: North America Plant Growth Chamber Market Revenue Share (%), by Consumption Analysis 2024 & 2032
- Figure 16: North America Plant Growth Chamber Market Revenue (Million), by Import Market Analysis (Value & Volume) 2024 & 2032
- Figure 17: North America Plant Growth Chamber Market Revenue Share (%), by Import Market Analysis (Value & Volume) 2024 & 2032
- Figure 18: North America Plant Growth Chamber Market Revenue (Million), by Export Market Analysis (Value & Volume) 2024 & 2032
- Figure 19: North America Plant Growth Chamber Market Revenue Share (%), by Export Market Analysis (Value & Volume) 2024 & 2032
- Figure 20: North America Plant Growth Chamber Market Revenue (Million), by Price Trend Analysis 2024 & 2032
- Figure 21: North America Plant Growth Chamber Market Revenue Share (%), by Price Trend Analysis 2024 & 2032
- Figure 22: North America Plant Growth Chamber Market Revenue (Million), by Country 2024 & 2032
- Figure 23: North America Plant Growth Chamber Market Revenue Share (%), by Country 2024 & 2032
- Figure 24: South America Plant Growth Chamber Market Revenue (Million), by Production Analysis 2024 & 2032
- Figure 25: South America Plant Growth Chamber Market Revenue Share (%), by Production Analysis 2024 & 2032
- Figure 26: South America Plant Growth Chamber Market Revenue (Million), by Consumption Analysis 2024 & 2032
- Figure 27: South America Plant Growth Chamber Market Revenue Share (%), by Consumption Analysis 2024 & 2032
- Figure 28: South America Plant Growth Chamber Market Revenue (Million), by Import Market Analysis (Value & Volume) 2024 & 2032
- Figure 29: South America Plant Growth Chamber Market Revenue Share (%), by Import Market Analysis (Value & Volume) 2024 & 2032
- Figure 30: South America Plant Growth Chamber Market Revenue (Million), by Export Market Analysis (Value & Volume) 2024 & 2032
- Figure 31: South America Plant Growth Chamber Market Revenue Share (%), by Export Market Analysis (Value & Volume) 2024 & 2032
- Figure 32: South America Plant Growth Chamber Market Revenue (Million), by Price Trend Analysis 2024 & 2032
- Figure 33: South America Plant Growth Chamber Market Revenue Share (%), by Price Trend Analysis 2024 & 2032
- Figure 34: South America Plant Growth Chamber Market Revenue (Million), by Country 2024 & 2032
- Figure 35: South America Plant Growth Chamber Market Revenue Share (%), by Country 2024 & 2032
- Figure 36: Europe Plant Growth Chamber Market Revenue (Million), by Production Analysis 2024 & 2032
- Figure 37: Europe Plant Growth Chamber Market Revenue Share (%), by Production Analysis 2024 & 2032
- Figure 38: Europe Plant Growth Chamber Market Revenue (Million), by Consumption Analysis 2024 & 2032
- Figure 39: Europe Plant Growth Chamber Market Revenue Share (%), by Consumption Analysis 2024 & 2032
- Figure 40: Europe Plant Growth Chamber Market Revenue (Million), by Import Market Analysis (Value & Volume) 2024 & 2032
- Figure 41: Europe Plant Growth Chamber Market Revenue Share (%), by Import Market Analysis (Value & Volume) 2024 & 2032
- Figure 42: Europe Plant Growth Chamber Market Revenue (Million), by Export Market Analysis (Value & Volume) 2024 & 2032
- Figure 43: Europe Plant Growth Chamber Market Revenue Share (%), by Export Market Analysis (Value & Volume) 2024 & 2032
- Figure 44: Europe Plant Growth Chamber Market Revenue (Million), by Price Trend Analysis 2024 & 2032
- Figure 45: Europe Plant Growth Chamber Market Revenue Share (%), by Price Trend Analysis 2024 & 2032
- Figure 46: Europe Plant Growth Chamber Market Revenue (Million), by Country 2024 & 2032
- Figure 47: Europe Plant Growth Chamber Market Revenue Share (%), by Country 2024 & 2032
- Figure 48: Middle East & Africa Plant Growth Chamber Market Revenue (Million), by Production Analysis 2024 & 2032
- Figure 49: Middle East & Africa Plant Growth Chamber Market Revenue Share (%), by Production Analysis 2024 & 2032
- Figure 50: Middle East & Africa Plant Growth Chamber Market Revenue (Million), by Consumption Analysis 2024 & 2032
- Figure 51: Middle East & Africa Plant Growth Chamber Market Revenue Share (%), by Consumption Analysis 2024 & 2032
- Figure 52: Middle East & Africa Plant Growth Chamber Market Revenue (Million), by Import Market Analysis (Value & Volume) 2024 & 2032
- Figure 53: Middle East & Africa Plant Growth Chamber Market Revenue Share (%), by Import Market Analysis (Value & Volume) 2024 & 2032
- Figure 54: Middle East & Africa Plant Growth Chamber Market Revenue (Million), by Export Market Analysis (Value & Volume) 2024 & 2032
- Figure 55: Middle East & Africa Plant Growth Chamber Market Revenue Share (%), by Export Market Analysis (Value & Volume) 2024 & 2032
- Figure 56: Middle East & Africa Plant Growth Chamber Market Revenue (Million), by Price Trend Analysis 2024 & 2032
- Figure 57: Middle East & Africa Plant Growth Chamber Market Revenue Share (%), by Price Trend Analysis 2024 & 2032
- Figure 58: Middle East & Africa Plant Growth Chamber Market Revenue (Million), by Country 2024 & 2032
- Figure 59: Middle East & Africa Plant Growth Chamber Market Revenue Share (%), by Country 2024 & 2032
- Figure 60: Asia Pacific Plant Growth Chamber Market Revenue (Million), by Production Analysis 2024 & 2032
- Figure 61: Asia Pacific Plant Growth Chamber Market Revenue Share (%), by Production Analysis 2024 & 2032
- Figure 62: Asia Pacific Plant Growth Chamber Market Revenue (Million), by Consumption Analysis 2024 & 2032
- Figure 63: Asia Pacific Plant Growth Chamber Market Revenue Share (%), by Consumption Analysis 2024 & 2032
- Figure 64: Asia Pacific Plant Growth Chamber Market Revenue (Million), by Import Market Analysis (Value & Volume) 2024 & 2032
- Figure 65: Asia Pacific Plant Growth Chamber Market Revenue Share (%), by Import Market Analysis (Value & Volume) 2024 & 2032
- Figure 66: Asia Pacific Plant Growth Chamber Market Revenue (Million), by Export Market Analysis (Value & Volume) 2024 & 2032
- Figure 67: Asia Pacific Plant Growth Chamber Market Revenue Share (%), by Export Market Analysis (Value & Volume) 2024 & 2032
- Figure 68: Asia Pacific Plant Growth Chamber Market Revenue (Million), by Price Trend Analysis 2024 & 2032
- Figure 69: Asia Pacific Plant Growth Chamber Market Revenue Share (%), by Price Trend Analysis 2024 & 2032
- Figure 70: Asia Pacific Plant Growth Chamber Market Revenue (Million), by Country 2024 & 2032
- Figure 71: Asia Pacific Plant Growth Chamber Market Revenue Share (%), by Country 2024 & 2032
List of Tables
- Table 1: Global Plant Growth Chamber Market Revenue Million Forecast, by Region 2019 & 2032
- Table 2: Global Plant Growth Chamber Market Revenue Million Forecast, by Production Analysis 2019 & 2032
- Table 3: Global Plant Growth Chamber Market Revenue Million Forecast, by Consumption Analysis 2019 & 2032
- Table 4: Global Plant Growth Chamber Market Revenue Million Forecast, by Import Market Analysis (Value & Volume) 2019 & 2032
- Table 5: Global Plant Growth Chamber Market Revenue Million Forecast, by Export Market Analysis (Value & Volume) 2019 & 2032
- Table 6: Global Plant Growth Chamber Market Revenue Million Forecast, by Price Trend Analysis 2019 & 2032
- Table 7: Global Plant Growth Chamber Market Revenue Million Forecast, by Region 2019 & 2032
- Table 8: Global Plant Growth Chamber Market Revenue Million Forecast, by Country 2019 & 2032
- Table 9: United States Plant Growth Chamber Market Revenue (Million) Forecast, by Application 2019 & 2032
- Table 10: Canada Plant Growth Chamber Market Revenue (Million) Forecast, by Application 2019 & 2032
- Table 11: Mexico Plant Growth Chamber Market Revenue (Million) Forecast, by Application 2019 & 2032
- Table 12: Rest of North America Plant Growth Chamber Market Revenue (Million) Forecast, by Application 2019 & 2032
- Table 13: Global Plant Growth Chamber Market Revenue Million Forecast, by Country 2019 & 2032
- Table 14: Germany Plant Growth Chamber Market Revenue (Million) Forecast, by Application 2019 & 2032
- Table 15: United Kingdom Plant Growth Chamber Market Revenue (Million) Forecast, by Application 2019 & 2032
- Table 16: France Plant Growth Chamber Market Revenue (Million) Forecast, by Application 2019 & 2032
- Table 17: Italy Plant Growth Chamber Market Revenue (Million) Forecast, by Application 2019 & 2032
- Table 18: Russia Plant Growth Chamber Market Revenue (Million) Forecast, by Application 2019 & 2032
- Table 19: Spain Plant Growth Chamber Market Revenue (Million) Forecast, by Application 2019 & 2032
- Table 20: Rest of Europe Plant Growth Chamber Market Revenue (Million) Forecast, by Application 2019 & 2032
- Table 21: Global Plant Growth Chamber Market Revenue Million Forecast, by Country 2019 & 2032
- Table 22: China Plant Growth Chamber Market Revenue (Million) Forecast, by Application 2019 & 2032
- Table 23: Japan Plant Growth Chamber Market Revenue (Million) Forecast, by Application 2019 & 2032
- Table 24: India Plant Growth Chamber Market Revenue (Million) Forecast, by Application 2019 & 2032
- Table 25: Australia Plant Growth Chamber Market Revenue (Million) Forecast, by Application 2019 & 2032
- Table 26: Rest of Asia Pacific Plant Growth Chamber Market Revenue (Million) Forecast, by Application 2019 & 2032
- Table 27: Global Plant Growth Chamber Market Revenue Million Forecast, by Country 2019 & 2032
- Table 28: Brazil Plant Growth Chamber Market Revenue (Million) Forecast, by Application 2019 & 2032
- Table 29: Argentina Plant Growth Chamber Market Revenue (Million) Forecast, by Application 2019 & 2032
- Table 30: Rest of South America Plant Growth Chamber Market Revenue (Million) Forecast, by Application 2019 & 2032
- Table 31: Global Plant Growth Chamber Market Revenue Million Forecast, by Country 2019 & 2032
- Table 32: South Africa Plant Growth Chamber Market Revenue (Million) Forecast, by Application 2019 & 2032
- Table 33: Rest of Africa Plant Growth Chamber Market Revenue (Million) Forecast, by Application 2019 & 2032
- Table 34: Global Plant Growth Chamber Market Revenue Million Forecast, by Production Analysis 2019 & 2032
- Table 35: Global Plant Growth Chamber Market Revenue Million Forecast, by Consumption Analysis 2019 & 2032
- Table 36: Global Plant Growth Chamber Market Revenue Million Forecast, by Import Market Analysis (Value & Volume) 2019 & 2032
- Table 37: Global Plant Growth Chamber Market Revenue Million Forecast, by Export Market Analysis (Value & Volume) 2019 & 2032
- Table 38: Global Plant Growth Chamber Market Revenue Million Forecast, by Price Trend Analysis 2019 & 2032
- Table 39: Global Plant Growth Chamber Market Revenue Million Forecast, by Country 2019 & 2032
- Table 40: United States Plant Growth Chamber Market Revenue (Million) Forecast, by Application 2019 & 2032
- Table 41: Canada Plant Growth Chamber Market Revenue (Million) Forecast, by Application 2019 & 2032
- Table 42: Mexico Plant Growth Chamber Market Revenue (Million) Forecast, by Application 2019 & 2032
- Table 43: Global Plant Growth Chamber Market Revenue Million Forecast, by Production Analysis 2019 & 2032
- Table 44: Global Plant Growth Chamber Market Revenue Million Forecast, by Consumption Analysis 2019 & 2032
- Table 45: Global Plant Growth Chamber Market Revenue Million Forecast, by Import Market Analysis (Value & Volume) 2019 & 2032
- Table 46: Global Plant Growth Chamber Market Revenue Million Forecast, by Export Market Analysis (Value & Volume) 2019 & 2032
- Table 47: Global Plant Growth Chamber Market Revenue Million Forecast, by Price Trend Analysis 2019 & 2032
- Table 48: Global Plant Growth Chamber Market Revenue Million Forecast, by Country 2019 & 2032
- Table 49: Brazil Plant Growth Chamber Market Revenue (Million) Forecast, by Application 2019 & 2032
- Table 50: Argentina Plant Growth Chamber Market Revenue (Million) Forecast, by Application 2019 & 2032
- Table 51: Rest of South America Plant Growth Chamber Market Revenue (Million) Forecast, by Application 2019 & 2032
- Table 52: Global Plant Growth Chamber Market Revenue Million Forecast, by Production Analysis 2019 & 2032
- Table 53: Global Plant Growth Chamber Market Revenue Million Forecast, by Consumption Analysis 2019 & 2032
- Table 54: Global Plant Growth Chamber Market Revenue Million Forecast, by Import Market Analysis (Value & Volume) 2019 & 2032
- Table 55: Global Plant Growth Chamber Market Revenue Million Forecast, by Export Market Analysis (Value & Volume) 2019 & 2032
- Table 56: Global Plant Growth Chamber Market Revenue Million Forecast, by Price Trend Analysis 2019 & 2032
- Table 57: Global Plant Growth Chamber Market Revenue Million Forecast, by Country 2019 & 2032
- Table 58: United Kingdom Plant Growth Chamber Market Revenue (Million) Forecast, by Application 2019 & 2032
- Table 59: Germany Plant Growth Chamber Market Revenue (Million) Forecast, by Application 2019 & 2032
- Table 60: France Plant Growth Chamber Market Revenue (Million) Forecast, by Application 2019 & 2032
- Table 61: Italy Plant Growth Chamber Market Revenue (Million) Forecast, by Application 2019 & 2032
- Table 62: Spain Plant Growth Chamber Market Revenue (Million) Forecast, by Application 2019 & 2032
- Table 63: Russia Plant Growth Chamber Market Revenue (Million) Forecast, by Application 2019 & 2032
- Table 64: Benelux Plant Growth Chamber Market Revenue (Million) Forecast, by Application 2019 & 2032
- Table 65: Nordics Plant Growth Chamber Market Revenue (Million) Forecast, by Application 2019 & 2032
- Table 66: Rest of Europe Plant Growth Chamber Market Revenue (Million) Forecast, by Application 2019 & 2032
- Table 67: Global Plant Growth Chamber Market Revenue Million Forecast, by Production Analysis 2019 & 2032
- Table 68: Global Plant Growth Chamber Market Revenue Million Forecast, by Consumption Analysis 2019 & 2032
- Table 69: Global Plant Growth Chamber Market Revenue Million Forecast, by Import Market Analysis (Value & Volume) 2019 & 2032
- Table 70: Global Plant Growth Chamber Market Revenue Million Forecast, by Export Market Analysis (Value & Volume) 2019 & 2032
- Table 71: Global Plant Growth Chamber Market Revenue Million Forecast, by Price Trend Analysis 2019 & 2032
- Table 72: Global Plant Growth Chamber Market Revenue Million Forecast, by Country 2019 & 2032
- Table 73: Turkey Plant Growth Chamber Market Revenue (Million) Forecast, by Application 2019 & 2032
- Table 74: Israel Plant Growth Chamber Market Revenue (Million) Forecast, by Application 2019 & 2032
- Table 75: GCC Plant Growth Chamber Market Revenue (Million) Forecast, by Application 2019 & 2032
- Table 76: North Africa Plant Growth Chamber Market Revenue (Million) Forecast, by Application 2019 & 2032
- Table 77: South Africa Plant Growth Chamber Market Revenue (Million) Forecast, by Application 2019 & 2032
- Table 78: Rest of Middle East & Africa Plant Growth Chamber Market Revenue (Million) Forecast, by Application 2019 & 2032
- Table 79: Global Plant Growth Chamber Market Revenue Million Forecast, by Production Analysis 2019 & 2032
- Table 80: Global Plant Growth Chamber Market Revenue Million Forecast, by Consumption Analysis 2019 & 2032
- Table 81: Global Plant Growth Chamber Market Revenue Million Forecast, by Import Market Analysis (Value & Volume) 2019 & 2032
- Table 82: Global Plant Growth Chamber Market Revenue Million Forecast, by Export Market Analysis (Value & Volume) 2019 & 2032
- Table 83: Global Plant Growth Chamber Market Revenue Million Forecast, by Price Trend Analysis 2019 & 2032
- Table 84: Global Plant Growth Chamber Market Revenue Million Forecast, by Country 2019 & 2032
- Table 85: China Plant Growth Chamber Market Revenue (Million) Forecast, by Application 2019 & 2032
- Table 86: India Plant Growth Chamber Market Revenue (Million) Forecast, by Application 2019 & 2032
- Table 87: Japan Plant Growth Chamber Market Revenue (Million) Forecast, by Application 2019 & 2032
- Table 88: South Korea Plant Growth Chamber Market Revenue (Million) Forecast, by Application 2019 & 2032
- Table 89: ASEAN Plant Growth Chamber Market Revenue (Million) Forecast, by Application 2019 & 2032
- Table 90: Oceania Plant Growth Chamber Market Revenue (Million) Forecast, by Application 2019 & 2032
- Table 91: Rest of Asia Pacific Plant Growth Chamber Market Revenue (Million) Forecast, by Application 2019 & 2032
Frequently Asked Questions
1. What is the projected Compound Annual Growth Rate (CAGR) of the Plant Growth Chamber Market?
The projected CAGR is approximately 4.70%.
2. Which companies are prominent players in the Plant Growth Chamber Market?
Key companies in the market include Weiss Techni, Darwin Chambers, Thermo Fisher, CARON Products & Services Inc, Conviron, Aralab, Percival Scientific Inc, Brs Bvba, BINDER GmbH, Hettich Benelux BV, Saveer Biotech Limited, Freezers India.
3. What are the main segments of the Plant Growth Chamber Market?
The market segments include Production Analysis, Consumption Analysis, Import Market Analysis (Value & Volume), Export Market Analysis (Value & Volume), Price Trend Analysis.
4. Can you provide details about the market size?
The market size is estimated to be USD 486.60 Million as of 2022.
5. What are some drivers contributing to market growth?
Seed Treatment As A Solution To Enhance Yield; Growing Awareness For Seed Treatment Among The Farmers; Rising Trend Of Organic Farming.
6. What are the notable trends driving market growth?
Increasing Demand for Food and Decreasing Arable Land.
7. Are there any restraints impacting market growth?
Limitations Across Farm-Level Seed Treatment; Rising Environmental Concerns.
8. Can you provide examples of recent developments in the market?
January 2022: Conviron launched a new EVO series of plant growth chambers, featuring a range of LE intensities, delivering a high degree of spatial uniformity for plant growth suitable for both short, medium, and tall plants.
9. What pricing options are available for accessing the report?
Pricing options include single-user, multi-user, and enterprise licenses priced at USD 4750, USD 5250, and USD 8750 respectively.
10. Is the market size provided in terms of value or volume?
The market size is provided in terms of value, measured in Million.
11. Are there any specific market keywords associated with the report?
Yes, the market keyword associated with the report is "Plant Growth Chamber Market," which aids in identifying and referencing the specific market segment covered.
12. How do I determine which pricing option suits my needs best?
The pricing options vary based on user requirements and access needs. Individual users may opt for single-user licenses, while businesses requiring broader access may choose multi-user or enterprise licenses for cost-effective access to the report.
13. Are there any additional resources or data provided in the Plant Growth Chamber Market report?
While the report offers comprehensive insights, it's advisable to review the specific contents or supplementary materials provided to ascertain if additional resources or data are available.
14. How can I stay updated on further developments or reports in the Plant Growth Chamber Market?
To stay informed about further developments, trends, and reports in the Plant Growth Chamber Market, consider subscribing to industry newsletters, following relevant companies and organizations, or regularly checking reputable industry news sources and publications.
Methodology
Step 1 - Identification of Relevant Samples Size from Population Database


Step 2 - Approaches for Defining Global Market Size (Value, Volume* & Price*)

Note*: In applicable scenarios
Step 3 - Data Sources
Primary Research
- Web Analytics
- Survey Reports
- Research Institute
- Latest Research Reports
- Opinion Leaders
Secondary Research
- Annual Reports
- White Paper
- Latest Press Release
- Industry Association
- Paid Database
- Investor Presentations

Step 4 - Data Triangulation
Involves using different sources of information in order to increase the validity of a study
These sources are likely to be stakeholders in a program - participants, other researchers, program staff, other community members, and so on.
Then we put all data in single framework & apply various statistical tools to find out the dynamic on the market.
During the analysis stage, feedback from the stakeholder groups would be compared to determine areas of agreement as well as areas of divergence


