Plants Phenotyping Market Decoded: Comprehensive Analysis and Forecasts 2025-2033

Plants Phenotyping Market by Production Analysis, by Consumption Analysis, by Import Market Analysis (Value & Volume), by Export Market Analysis (Value & Volume), by Price Trend Analysis, by North America (United States, Canada, Mexico), by South America (Brazil, Argentina, Rest of South America), by Europe (United Kingdom, Germany, France, Italy, Spain, Russia, Benelux, Nordics, Rest of Europe), by Middle East & Africa (Turkey, Israel, GCC, North Africa, South Africa, Rest of Middle East & Africa), by Asia Pacific (China, India, Japan, South Korea, ASEAN, Oceania, Rest of Asia Pacific) Forecast 2025-2033

Jul 4 2025
Base Year: 2024

150 Pages
Main Logo

Plants Phenotyping Market Decoded: Comprehensive Analysis and Forecasts 2025-2033


Home
Industries
Agriculture
sponsor image

Tailored for you

  • In-depth Analysis Tailored to Specified Regions or Segments
  • Company Profiles Customized to User Preferences
  • Comprehensive Insights Focused on Specific Segments or Regions
  • Customized Evaluation of Competitive Landscape to Meet Your Needs
  • Tailored Customization to Address Other Specific Requirements
Ask for customization


Key Insights

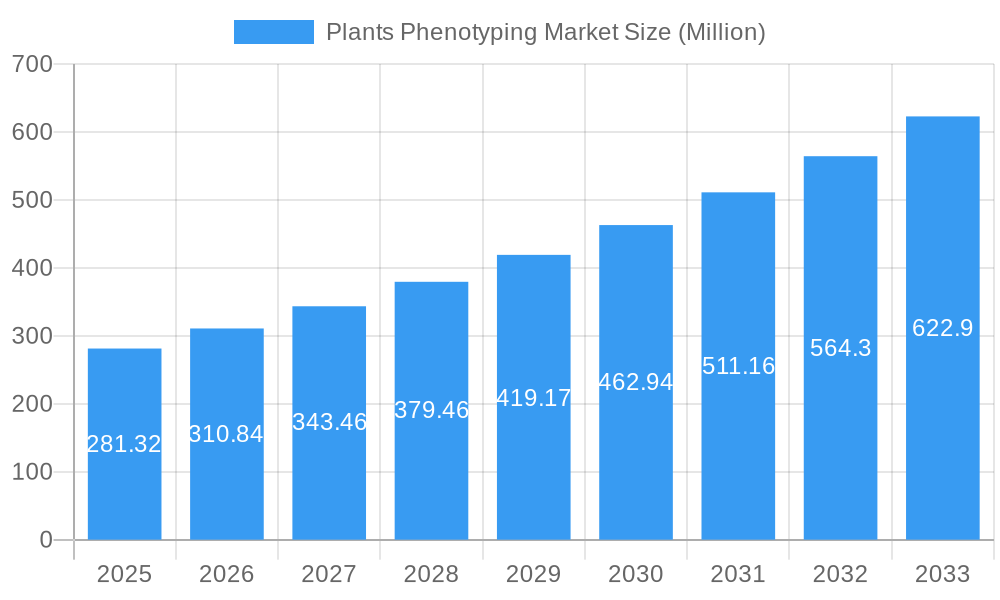
The Plants Phenotyping Market, valued at $281.32 million in 2025, is projected to experience robust growth, exhibiting a Compound Annual Growth Rate (CAGR) of 10.50% from 2025 to 2033. This expansion is driven by several key factors. Firstly, the increasing demand for high-throughput screening in agricultural research and development is fueling the adoption of advanced phenotyping technologies. Researchers are constantly seeking faster and more efficient methods to analyze plant traits, and automated systems significantly enhance this process, leading to quicker crop improvement cycles and increased yield. Secondly, the growing awareness of climate change and the need for climate-resilient crops is further boosting market growth. Phenotyping plays a crucial role in identifying and selecting plants with superior drought tolerance, heat resistance, and other desirable traits essential for sustainable agriculture. The market is segmented across various technologies, including image analysis systems, multispectral cameras, and fluorometers, each contributing to the comprehensive analysis of plant characteristics. The availability of diverse platforms, such as conveyor-based, bench-based, handheld, and drone-based systems, caters to varying research needs and scales of operation, from laboratory settings to extensive field studies.

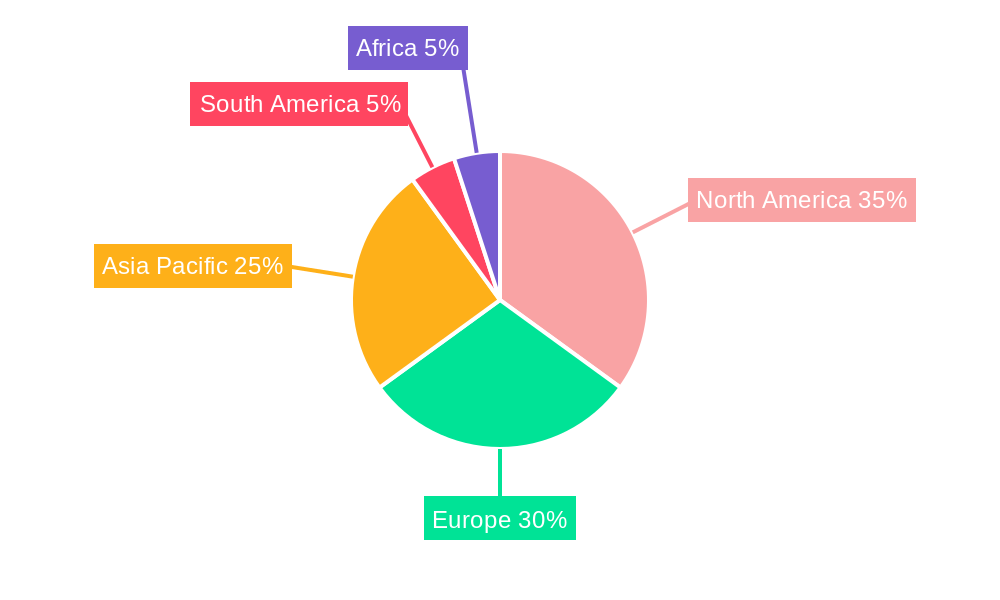
Significant market segments include high-throughput screening, trait identification, and photosynthetic performance assessment. The fully automated segment is expected to witness significant growth due to its efficiency and ability to handle large datasets. Geographically, North America and Europe currently hold substantial market shares, driven by robust agricultural research infrastructure and substantial funding for agricultural innovation. However, the Asia-Pacific region is anticipated to demonstrate rapid growth in the coming years, fuelled by rising agricultural production and a growing emphasis on enhancing crop yields to meet the demands of a burgeoning population. The continued advancements in sensor technology, data analytics, and artificial intelligence will further propel the market forward, enabling more precise and efficient phenotyping solutions. Competition within the market is intense, with established players and emerging companies contributing to technological advancements and market expansion. This dynamic environment ensures continuous innovation and further enhances the potential of this rapidly expanding sector.

Plants Phenotyping Market Research Report - Market Size, Growth & Forecast

Plants Phenotyping Market: A Comprehensive Report (2019-2033)

This in-depth report provides a comprehensive analysis of the Plants Phenotyping Market, offering actionable insights for stakeholders across the industry. The study period covers 2019-2033, with a base year of 2025 and a forecast period of 2025-2033. The report utilizes a robust methodology, incorporating historical data from 2019-2024 to provide accurate and reliable projections. It delves into various market segments, competitive landscapes, and growth drivers to offer a holistic understanding of this dynamic market, projected to reach xx Million by 2033.

Plants Phenotyping Market Concentration & Innovation

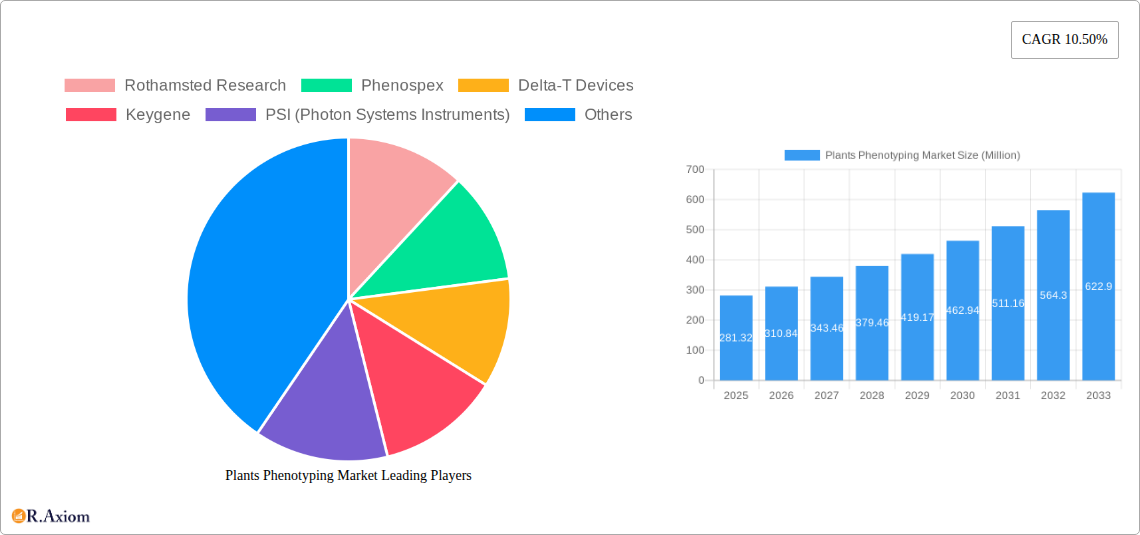
The Plants Phenotyping Market exhibits a moderately concentrated landscape, with a few key players holding significant market share. The top five companies – Rothamsted Research, Phenospex, Delta-T Devices, Keygene, and PSI (Photon Systems Instruments) – collectively account for an estimated xx% of the market in 2025. However, the market is witnessing increased innovation driven by advancements in sensor technology, image analysis software, and automation.

Several factors influence market concentration:

  • High R&D investments: Leading companies invest heavily in research and development to enhance their product portfolios and maintain a competitive edge. This contributes to higher barriers to entry for new players.
  • Strategic partnerships and acquisitions: M&A activity has played a significant role in shaping the market landscape. While precise deal values are not publicly available for all transactions, the average deal size for M&A activities in the past five years is estimated at xx Million. These activities often involve smaller companies being acquired by larger players to expand their product lines and market reach.
  • Regulatory frameworks: Stringent regulations regarding the use of plant phenotyping technologies, particularly in the context of genetically modified organisms (GMOs), can influence market growth and the strategies of companies. These regulations vary geographically, creating a complex regulatory environment.
  • Product substitutes: While no direct substitutes exist for core plant phenotyping technologies, alternative methods like traditional manual assessments can influence the adoption rate of advanced technologies, particularly in smaller operations.
  • End-user trends: The growing demand for higher crop yields and improved stress tolerance in plants is a key driver for adopting plant phenotyping. The increasing adoption of precision agriculture practices further boosts the market growth.

Plants Phenotyping Market Industry Trends & Insights

The Plants Phenotyping Market is experiencing robust growth, driven by a confluence of factors. The market is expected to exhibit a CAGR of xx% during the forecast period (2025-2033). Key factors driving this growth include:

  • Technological advancements: The continuous development of high-throughput screening technologies, advanced sensors (including hyperspectral and multispectral imaging), and sophisticated data analysis software is enhancing the efficiency and accuracy of plant phenotyping. This leads to better decision-making in breeding programs and crop management practices.
  • Rising demand for high-yield crops: The global population growth and increasing food demand are putting pressure on agricultural systems to deliver higher yields. Plant phenotyping plays a crucial role in developing high-yielding and stress-tolerant crop varieties.
  • Increased adoption of precision agriculture: The shift towards precision agriculture techniques is driving the demand for accurate and efficient phenotyping tools to optimize resource utilization and improve crop productivity. Market penetration of precision agriculture technologies is estimated to be at xx% in 2025, with significant growth expected in the coming years.
  • Competitive dynamics: Intense competition among key players is leading to innovation and price reductions, making plant phenotyping technologies more accessible to a broader range of users, including smallholder farmers.
Plants Phenotyping Market Growth

Dominant Markets & Segments in Plants Phenotyping Market

The North American region currently holds the largest market share, driven by substantial investments in agricultural research and the early adoption of advanced technologies. However, the Asia-Pacific region is expected to witness the fastest growth rate during the forecast period, fuelled by the expanding agricultural sector and increasing government initiatives to improve crop yields.

Key Drivers by Segment:

  • By Application: High-throughput screening dominates the market due to its efficiency in evaluating large numbers of plants, followed by Trait Identification.
  • By Automation Type: Fully automated systems are witnessing significant growth due to increased efficiency and reduced labor costs, while the manual segment remains significant for smaller-scale operations.
  • By Analysis System: Image analysis systems are the most dominant, leveraging advanced image processing techniques.
  • By Site: Field applications are increasingly gaining traction, driven by the need for on-site assessments in real-world agricultural conditions.
  • By Platform: Conveyor-based/modular systems are prevalent in high-throughput settings, followed by bench-based and handheld systems.
  • By Product: Equipment segment holds the largest market share, followed by Software. The services segment offers significant potential for growth driven by an increase in data processing requirements.

Detailed dominance analysis reveals that North America’s dominance stems from strong research infrastructure, high adoption rates of precision agriculture, and well-established agricultural industries. The Asia-Pacific region's rapid growth is propelled by the increasing need for food security, coupled with government support for agricultural technology advancements. Europe maintains a significant market share due to its long-standing agricultural research base and advancements in breeding technologies.

Plants Phenotyping Market Product Developments

Recent product developments have focused on improving the speed, accuracy, and integration of phenotyping platforms. This includes the incorporation of advanced sensors, sophisticated algorithms for image analysis, and the development of user-friendly software interfaces. These advancements address the challenges of high-throughput data acquisition and facilitate streamlined data analysis. The integration of drone technology for large-scale field phenotyping is gaining traction, while miniaturization and portability of handheld devices are expanding market access.

Report Scope & Segmentation Analysis

This report provides a detailed segmentation of the Plants Phenotyping Market across various parameters:

By Product: Equipment (including sensors, cameras, and other hardware), Services (Measurement Acquisition & Data Analysis, Statistical Analysis), and Other Softwares. The Equipment segment is expected to remain dominant, with steady growth projected across all sub-segments.

By Automation Type: Manual, Semi-Automated, and Fully Automated. Fully automated systems are projected to exhibit the highest growth rate due to efficiency gains.

By Application: High-Throughput Screening, Trait Identification, Photosynthetic Performance, Morphology and Growth Assessment, and Other Applications. High-Throughput Screening commands the largest market share.

By Analysis System: Image Analysis Systems, Multispectral Scientific Cameras, Canopy Analysis Systems, Fluorometers, and Others. Image analysis systems are the most widely used.

By Site: Laboratory, Greenhouse, and Field. Field applications are expected to experience substantial growth driven by the need for real-world data.

By Platform: Conveyor-Based/Modular Systems, Bench-Based Systems, Handheld/Portable Systems, Drones, and Softwares. The diversity in platforms addresses the varied needs of different research settings and scales of operation.

Key Drivers of Plants Phenotyping Market Growth

The Plants Phenotyping Market's growth is driven by several factors: increasing demand for higher crop yields, the adoption of precision agriculture techniques, advancements in sensor and image analysis technologies, increasing government investments in agricultural research, and growing awareness of the importance of sustainable agriculture practices. The development of high-throughput phenotyping platforms enables researchers to analyze thousands of plants efficiently, leading to faster crop improvement cycles.

Challenges in the Plants Phenotyping Market Sector

The Plants Phenotyping Market faces several challenges: high initial investment costs associated with acquiring advanced equipment, the need for skilled personnel to operate and analyze the data generated by these systems, and the complexities of integrating different phenotyping technologies into existing workflows. Data management and analysis can also be time-consuming and require sophisticated software.

Emerging Opportunities in Plants Phenotyping Market

Emerging opportunities lie in the development of more portable and user-friendly phenotyping technologies, particularly for smallholder farmers. The integration of artificial intelligence (AI) and machine learning (ML) in data analysis holds significant potential for enhancing the accuracy and efficiency of plant phenotyping. The use of drones and other remote sensing technologies for large-scale field phenotyping is also expanding.

Leading Players in the Plants Phenotyping Market Market

  • Rothamsted Research
  • Phenospex
  • Delta-T Devices
  • Keygene
  • PSI (Photon Systems Instruments)
  • BASF SE (Crop Design)
  • Heinz Walz GmbH
  • The Vienna Biocenter Core Facilities
  • LemnaTec GmbH
  • Phenomix
  • WP
  • Qubit Systems

Key Developments in Plants Phenotyping Market Industry

  • Jan 2023: LemnaTec GmbH launched a new high-throughput phenotyping platform.
  • May 2022: A strategic partnership was formed between Phenospex and a major agricultural company to develop new sensor technologies. (Specific details not publicly available)
  • Oct 2021: PSI (Photon Systems Instruments) released updated software for its imaging systems.

Further specific developments are detailed within the full report.

Strategic Outlook for Plants Phenotyping Market Market

The Plants Phenotyping Market holds significant growth potential, driven by the ongoing need for improved crop yields and enhanced agricultural efficiency. The integration of AI, ML, and advanced sensor technologies will continue to shape the market, creating new opportunities for innovation and market expansion. The market's future success hinges on addressing current challenges related to cost, data management, and user accessibility, particularly for smaller-scale agricultural operations. The development of user-friendly and cost-effective solutions will be crucial to unlocking the full potential of this transformative technology.

Plants Phenotyping Market Segmentation

  • 1. Production Analysis
  • 2. Consumption Analysis
  • 3. Import Market Analysis (Value & Volume)
  • 4. Export Market Analysis (Value & Volume)
  • 5. Price Trend Analysis

Plants Phenotyping Market Segmentation By Geography

  • 1. North America
    • 1.1. United States
    • 1.2. Canada
    • 1.3. Mexico
  • 2. South America
    • 2.1. Brazil
    • 2.2. Argentina
    • 2.3. Rest of South America
  • 3. Europe
    • 3.1. United Kingdom
    • 3.2. Germany
    • 3.3. France
    • 3.4. Italy
    • 3.5. Spain
    • 3.6. Russia
    • 3.7. Benelux
    • 3.8. Nordics
    • 3.9. Rest of Europe
  • 4. Middle East & Africa
    • 4.1. Turkey
    • 4.2. Israel
    • 4.3. GCC
    • 4.4. North Africa
    • 4.5. South Africa
    • 4.6. Rest of Middle East & Africa
  • 5. Asia Pacific
    • 5.1. China
    • 5.2. India
    • 5.3. Japan
    • 5.4. South Korea
    • 5.5. ASEAN
    • 5.6. Oceania
    • 5.7. Rest of Asia Pacific
Plants Phenotyping Market Regional Share


Plants Phenotyping Market REPORT HIGHLIGHTS

AspectsDetails
Study Period 2019-2033
Base Year 2024
Estimated Year 2025
Forecast Period2025-2033
Historical Period2019-2024
Growth RateCAGR of 10.50% from 2019-2033
Segmentation
    • By Production Analysis
    • By Consumption Analysis
    • By Import Market Analysis (Value & Volume)
    • By Export Market Analysis (Value & Volume)
    • By Price Trend Analysis
  • By Geography
    • North America
      • United States
      • Canada
      • Mexico
    • South America
      • Brazil
      • Argentina
      • Rest of South America
    • Europe
      • United Kingdom
      • Germany
      • France
      • Italy
      • Spain
      • Russia
      • Benelux
      • Nordics
      • Rest of Europe
    • Middle East & Africa
      • Turkey
      • Israel
      • GCC
      • North Africa
      • South Africa
      • Rest of Middle East & Africa
    • Asia Pacific
      • China
      • India
      • Japan
      • South Korea
      • ASEAN
      • Oceania
      • Rest of Asia Pacific


Table of Contents

  1. 1. Introduction
    • 1.1. Research Scope
    • 1.2. Market Segmentation
    • 1.3. Research Methodology
    • 1.4. Definitions and Assumptions
  2. 2. Executive Summary
    • 2.1. Introduction
  3. 3. Market Dynamics
    • 3.1. Introduction
      • 3.2. Market Drivers
        • 3.2.1. Demand For Landscaping Maintenance; Adoption of Green Spaces and Green Roofs
      • 3.3. Market Restrains
        • 3.3.1. Shortage of Labor In Landscaping; High Maintenance Cost of Lawn Mowers
      • 3.4. Market Trends
        • 3.4.1. Increasing Number of Seed Borne Diseases is Driving the Market
  4. 4. Market Factor Analysis
    • 4.1. Porters Five Forces
    • 4.2. Supply/Value Chain
    • 4.3. PESTEL analysis
    • 4.4. Market Entropy
    • 4.5. Patent/Trademark Analysis
  5. 5. Global Plants Phenotyping Market Analysis, Insights and Forecast, 2019-2031
    • 5.1. Market Analysis, Insights and Forecast - by Production Analysis
      • 5.2. Market Analysis, Insights and Forecast - by Consumption Analysis
        • 5.3. Market Analysis, Insights and Forecast - by Import Market Analysis (Value & Volume)
          • 5.4. Market Analysis, Insights and Forecast - by Export Market Analysis (Value & Volume)
            • 5.5. Market Analysis, Insights and Forecast - by Price Trend Analysis
              • 5.6. Market Analysis, Insights and Forecast - by Region
                • 5.6.1. North America
                • 5.6.2. South America
                • 5.6.3. Europe
                • 5.6.4. Middle East & Africa
                • 5.6.5. Asia Pacific
            • 6. North America Plants Phenotyping Market Analysis, Insights and Forecast, 2019-2031
              • 6.1. Market Analysis, Insights and Forecast - by Production Analysis
                • 6.2. Market Analysis, Insights and Forecast - by Consumption Analysis
                  • 6.3. Market Analysis, Insights and Forecast - by Import Market Analysis (Value & Volume)
                    • 6.4. Market Analysis, Insights and Forecast - by Export Market Analysis (Value & Volume)
                      • 6.5. Market Analysis, Insights and Forecast - by Price Trend Analysis
                      • 7. South America Plants Phenotyping Market Analysis, Insights and Forecast, 2019-2031
                        • 7.1. Market Analysis, Insights and Forecast - by Production Analysis
                          • 7.2. Market Analysis, Insights and Forecast - by Consumption Analysis
                            • 7.3. Market Analysis, Insights and Forecast - by Import Market Analysis (Value & Volume)
                              • 7.4. Market Analysis, Insights and Forecast - by Export Market Analysis (Value & Volume)
                                • 7.5. Market Analysis, Insights and Forecast - by Price Trend Analysis
                                • 8. Europe Plants Phenotyping Market Analysis, Insights and Forecast, 2019-2031
                                  • 8.1. Market Analysis, Insights and Forecast - by Production Analysis
                                    • 8.2. Market Analysis, Insights and Forecast - by Consumption Analysis
                                      • 8.3. Market Analysis, Insights and Forecast - by Import Market Analysis (Value & Volume)
                                        • 8.4. Market Analysis, Insights and Forecast - by Export Market Analysis (Value & Volume)
                                          • 8.5. Market Analysis, Insights and Forecast - by Price Trend Analysis
                                          • 9. Middle East & Africa Plants Phenotyping Market Analysis, Insights and Forecast, 2019-2031
                                            • 9.1. Market Analysis, Insights and Forecast - by Production Analysis
                                              • 9.2. Market Analysis, Insights and Forecast - by Consumption Analysis
                                                • 9.3. Market Analysis, Insights and Forecast - by Import Market Analysis (Value & Volume)
                                                  • 9.4. Market Analysis, Insights and Forecast - by Export Market Analysis (Value & Volume)
                                                    • 9.5. Market Analysis, Insights and Forecast - by Price Trend Analysis
                                                    • 10. Asia Pacific Plants Phenotyping Market Analysis, Insights and Forecast, 2019-2031
                                                      • 10.1. Market Analysis, Insights and Forecast - by Production Analysis
                                                        • 10.2. Market Analysis, Insights and Forecast - by Consumption Analysis
                                                          • 10.3. Market Analysis, Insights and Forecast - by Import Market Analysis (Value & Volume)
                                                            • 10.4. Market Analysis, Insights and Forecast - by Export Market Analysis (Value & Volume)
                                                              • 10.5. Market Analysis, Insights and Forecast - by Price Trend Analysis
                                                              • 11. North America Plants Phenotyping Market Analysis, Insights and Forecast, 2019-2031
                                                                  • 11.1. Market Analysis, Insights and Forecast - By Country/Sub-region
                                                                    • 11.1.1 United States
                                                                    • 11.1.2 Canada
                                                                    • 11.1.3 Mexico
                                                                    • 11.1.4 Rest of North America
                                                              • 12. Europe Plants Phenotyping Market Analysis, Insights and Forecast, 2019-2031
                                                                  • 12.1. Market Analysis, Insights and Forecast - By Country/Sub-region
                                                                    • 12.1.1 Germany
                                                                    • 12.1.2 United Kingdom
                                                                    • 12.1.3 France
                                                                    • 12.1.4 Italy
                                                                    • 12.1.5 Russia
                                                                    • 12.1.6 Spain
                                                                    • 12.1.7 Rest of Europe
                                                              • 13. Asia Pacific Plants Phenotyping Market Analysis, Insights and Forecast, 2019-2031
                                                                  • 13.1. Market Analysis, Insights and Forecast - By Country/Sub-region
                                                                    • 13.1.1 China
                                                                    • 13.1.2 Japan
                                                                    • 13.1.3 India
                                                                    • 13.1.4 Australia
                                                                    • 13.1.5 Rest of Asia Pacific
                                                              • 14. South America Plants Phenotyping Market Analysis, Insights and Forecast, 2019-2031
                                                                  • 14.1. Market Analysis, Insights and Forecast - By Country/Sub-region
                                                                    • 14.1.1 Brazil
                                                                    • 14.1.2 Argentina
                                                                    • 14.1.3 Rest of South America
                                                              • 15. Africa Plants Phenotyping Market Analysis, Insights and Forecast, 2019-2031
                                                                  • 15.1. Market Analysis, Insights and Forecast - By Country/Sub-region
                                                                    • 15.1.1 South Africa
                                                                    • 15.1.2 Rest of Africa
                                                              • 16. Competitive Analysis
                                                                • 16.1. Global Market Share Analysis 2024
                                                                  • 16.2. Company Profiles
                                                                    • 16.2.1 Rothamsted Research
                                                                      • 16.2.1.1. Overview
                                                                      • 16.2.1.2. Products
                                                                      • 16.2.1.3. SWOT Analysis
                                                                      • 16.2.1.4. Recent Developments
                                                                      • 16.2.1.5. Financials (Based on Availability)
                                                                    • 16.2.2 Phenospex
                                                                      • 16.2.2.1. Overview
                                                                      • 16.2.2.2. Products
                                                                      • 16.2.2.3. SWOT Analysis
                                                                      • 16.2.2.4. Recent Developments
                                                                      • 16.2.2.5. Financials (Based on Availability)
                                                                    • 16.2.3 Delta-T Devices
                                                                      • 16.2.3.1. Overview
                                                                      • 16.2.3.2. Products
                                                                      • 16.2.3.3. SWOT Analysis
                                                                      • 16.2.3.4. Recent Developments
                                                                      • 16.2.3.5. Financials (Based on Availability)
                                                                    • 16.2.4 Keygene
                                                                      • 16.2.4.1. Overview
                                                                      • 16.2.4.2. Products
                                                                      • 16.2.4.3. SWOT Analysis
                                                                      • 16.2.4.4. Recent Developments
                                                                      • 16.2.4.5. Financials (Based on Availability)
                                                                    • 16.2.5 PSI (Photon Systems Instruments)
                                                                      • 16.2.5.1. Overview
                                                                      • 16.2.5.2. Products
                                                                      • 16.2.5.3. SWOT Analysis
                                                                      • 16.2.5.4. Recent Developments
                                                                      • 16.2.5.5. Financials (Based on Availability)
                                                                    • 16.2.6 BASF SE (Crop Design)
                                                                      • 16.2.6.1. Overview
                                                                      • 16.2.6.2. Products
                                                                      • 16.2.6.3. SWOT Analysis
                                                                      • 16.2.6.4. Recent Developments
                                                                      • 16.2.6.5. Financials (Based on Availability)
                                                                    • 16.2.7 Heinz Walz GmbH
                                                                      • 16.2.7.1. Overview
                                                                      • 16.2.7.2. Products
                                                                      • 16.2.7.3. SWOT Analysis
                                                                      • 16.2.7.4. Recent Developments
                                                                      • 16.2.7.5. Financials (Based on Availability)
                                                                    • 16.2.8 The Vienna Biocenter Core Facilities
                                                                      • 16.2.8.1. Overview
                                                                      • 16.2.8.2. Products
                                                                      • 16.2.8.3. SWOT Analysis
                                                                      • 16.2.8.4. Recent Developments
                                                                      • 16.2.8.5. Financials (Based on Availability)
                                                                    • 16.2.9 LemnaTec GmbH
                                                                      • 16.2.9.1. Overview
                                                                      • 16.2.9.2. Products
                                                                      • 16.2.9.3. SWOT Analysis
                                                                      • 16.2.9.4. Recent Developments
                                                                      • 16.2.9.5. Financials (Based on Availability)
                                                                    • 16.2.10 Phenomix
                                                                      • 16.2.10.1. Overview
                                                                      • 16.2.10.2. Products
                                                                      • 16.2.10.3. SWOT Analysis
                                                                      • 16.2.10.4. Recent Developments
                                                                      • 16.2.10.5. Financials (Based on Availability)
                                                                    • 16.2.11 WP
                                                                      • 16.2.11.1. Overview
                                                                      • 16.2.11.2. Products
                                                                      • 16.2.11.3. SWOT Analysis
                                                                      • 16.2.11.4. Recent Developments
                                                                      • 16.2.11.5. Financials (Based on Availability)
                                                                    • 16.2.12 Qubit Systems
                                                                      • 16.2.12.1. Overview
                                                                      • 16.2.12.2. Products
                                                                      • 16.2.12.3. SWOT Analysis
                                                                      • 16.2.12.4. Recent Developments
                                                                      • 16.2.12.5. Financials (Based on Availability)

                                                              List of Figures

                                                              1. Figure 1: Global Plants Phenotyping Market Revenue Breakdown (Million, %) by Region 2024 & 2032
                                                              2. Figure 2: North America Plants Phenotyping Market Revenue (Million), by Country 2024 & 2032
                                                              3. Figure 3: North America Plants Phenotyping Market Revenue Share (%), by Country 2024 & 2032
                                                              4. Figure 4: Europe Plants Phenotyping Market Revenue (Million), by Country 2024 & 2032
                                                              5. Figure 5: Europe Plants Phenotyping Market Revenue Share (%), by Country 2024 & 2032
                                                              6. Figure 6: Asia Pacific Plants Phenotyping Market Revenue (Million), by Country 2024 & 2032
                                                              7. Figure 7: Asia Pacific Plants Phenotyping Market Revenue Share (%), by Country 2024 & 2032
                                                              8. Figure 8: South America Plants Phenotyping Market Revenue (Million), by Country 2024 & 2032
                                                              9. Figure 9: South America Plants Phenotyping Market Revenue Share (%), by Country 2024 & 2032
                                                              10. Figure 10: Africa Plants Phenotyping Market Revenue (Million), by Country 2024 & 2032
                                                              11. Figure 11: Africa Plants Phenotyping Market Revenue Share (%), by Country 2024 & 2032
                                                              12. Figure 12: North America Plants Phenotyping Market Revenue (Million), by Production Analysis 2024 & 2032
                                                              13. Figure 13: North America Plants Phenotyping Market Revenue Share (%), by Production Analysis 2024 & 2032
                                                              14. Figure 14: North America Plants Phenotyping Market Revenue (Million), by Consumption Analysis 2024 & 2032
                                                              15. Figure 15: North America Plants Phenotyping Market Revenue Share (%), by Consumption Analysis 2024 & 2032
                                                              16. Figure 16: North America Plants Phenotyping Market Revenue (Million), by Import Market Analysis (Value & Volume) 2024 & 2032
                                                              17. Figure 17: North America Plants Phenotyping Market Revenue Share (%), by Import Market Analysis (Value & Volume) 2024 & 2032
                                                              18. Figure 18: North America Plants Phenotyping Market Revenue (Million), by Export Market Analysis (Value & Volume) 2024 & 2032
                                                              19. Figure 19: North America Plants Phenotyping Market Revenue Share (%), by Export Market Analysis (Value & Volume) 2024 & 2032
                                                              20. Figure 20: North America Plants Phenotyping Market Revenue (Million), by Price Trend Analysis 2024 & 2032
                                                              21. Figure 21: North America Plants Phenotyping Market Revenue Share (%), by Price Trend Analysis 2024 & 2032
                                                              22. Figure 22: North America Plants Phenotyping Market Revenue (Million), by Country 2024 & 2032
                                                              23. Figure 23: North America Plants Phenotyping Market Revenue Share (%), by Country 2024 & 2032
                                                              24. Figure 24: South America Plants Phenotyping Market Revenue (Million), by Production Analysis 2024 & 2032
                                                              25. Figure 25: South America Plants Phenotyping Market Revenue Share (%), by Production Analysis 2024 & 2032
                                                              26. Figure 26: South America Plants Phenotyping Market Revenue (Million), by Consumption Analysis 2024 & 2032
                                                              27. Figure 27: South America Plants Phenotyping Market Revenue Share (%), by Consumption Analysis 2024 & 2032
                                                              28. Figure 28: South America Plants Phenotyping Market Revenue (Million), by Import Market Analysis (Value & Volume) 2024 & 2032
                                                              29. Figure 29: South America Plants Phenotyping Market Revenue Share (%), by Import Market Analysis (Value & Volume) 2024 & 2032
                                                              30. Figure 30: South America Plants Phenotyping Market Revenue (Million), by Export Market Analysis (Value & Volume) 2024 & 2032
                                                              31. Figure 31: South America Plants Phenotyping Market Revenue Share (%), by Export Market Analysis (Value & Volume) 2024 & 2032
                                                              32. Figure 32: South America Plants Phenotyping Market Revenue (Million), by Price Trend Analysis 2024 & 2032
                                                              33. Figure 33: South America Plants Phenotyping Market Revenue Share (%), by Price Trend Analysis 2024 & 2032
                                                              34. Figure 34: South America Plants Phenotyping Market Revenue (Million), by Country 2024 & 2032
                                                              35. Figure 35: South America Plants Phenotyping Market Revenue Share (%), by Country 2024 & 2032
                                                              36. Figure 36: Europe Plants Phenotyping Market Revenue (Million), by Production Analysis 2024 & 2032
                                                              37. Figure 37: Europe Plants Phenotyping Market Revenue Share (%), by Production Analysis 2024 & 2032
                                                              38. Figure 38: Europe Plants Phenotyping Market Revenue (Million), by Consumption Analysis 2024 & 2032
                                                              39. Figure 39: Europe Plants Phenotyping Market Revenue Share (%), by Consumption Analysis 2024 & 2032
                                                              40. Figure 40: Europe Plants Phenotyping Market Revenue (Million), by Import Market Analysis (Value & Volume) 2024 & 2032
                                                              41. Figure 41: Europe Plants Phenotyping Market Revenue Share (%), by Import Market Analysis (Value & Volume) 2024 & 2032
                                                              42. Figure 42: Europe Plants Phenotyping Market Revenue (Million), by Export Market Analysis (Value & Volume) 2024 & 2032
                                                              43. Figure 43: Europe Plants Phenotyping Market Revenue Share (%), by Export Market Analysis (Value & Volume) 2024 & 2032
                                                              44. Figure 44: Europe Plants Phenotyping Market Revenue (Million), by Price Trend Analysis 2024 & 2032
                                                              45. Figure 45: Europe Plants Phenotyping Market Revenue Share (%), by Price Trend Analysis 2024 & 2032
                                                              46. Figure 46: Europe Plants Phenotyping Market Revenue (Million), by Country 2024 & 2032
                                                              47. Figure 47: Europe Plants Phenotyping Market Revenue Share (%), by Country 2024 & 2032
                                                              48. Figure 48: Middle East & Africa Plants Phenotyping Market Revenue (Million), by Production Analysis 2024 & 2032
                                                              49. Figure 49: Middle East & Africa Plants Phenotyping Market Revenue Share (%), by Production Analysis 2024 & 2032
                                                              50. Figure 50: Middle East & Africa Plants Phenotyping Market Revenue (Million), by Consumption Analysis 2024 & 2032
                                                              51. Figure 51: Middle East & Africa Plants Phenotyping Market Revenue Share (%), by Consumption Analysis 2024 & 2032
                                                              52. Figure 52: Middle East & Africa Plants Phenotyping Market Revenue (Million), by Import Market Analysis (Value & Volume) 2024 & 2032
                                                              53. Figure 53: Middle East & Africa Plants Phenotyping Market Revenue Share (%), by Import Market Analysis (Value & Volume) 2024 & 2032
                                                              54. Figure 54: Middle East & Africa Plants Phenotyping Market Revenue (Million), by Export Market Analysis (Value & Volume) 2024 & 2032
                                                              55. Figure 55: Middle East & Africa Plants Phenotyping Market Revenue Share (%), by Export Market Analysis (Value & Volume) 2024 & 2032
                                                              56. Figure 56: Middle East & Africa Plants Phenotyping Market Revenue (Million), by Price Trend Analysis 2024 & 2032
                                                              57. Figure 57: Middle East & Africa Plants Phenotyping Market Revenue Share (%), by Price Trend Analysis 2024 & 2032
                                                              58. Figure 58: Middle East & Africa Plants Phenotyping Market Revenue (Million), by Country 2024 & 2032
                                                              59. Figure 59: Middle East & Africa Plants Phenotyping Market Revenue Share (%), by Country 2024 & 2032
                                                              60. Figure 60: Asia Pacific Plants Phenotyping Market Revenue (Million), by Production Analysis 2024 & 2032
                                                              61. Figure 61: Asia Pacific Plants Phenotyping Market Revenue Share (%), by Production Analysis 2024 & 2032
                                                              62. Figure 62: Asia Pacific Plants Phenotyping Market Revenue (Million), by Consumption Analysis 2024 & 2032
                                                              63. Figure 63: Asia Pacific Plants Phenotyping Market Revenue Share (%), by Consumption Analysis 2024 & 2032
                                                              64. Figure 64: Asia Pacific Plants Phenotyping Market Revenue (Million), by Import Market Analysis (Value & Volume) 2024 & 2032
                                                              65. Figure 65: Asia Pacific Plants Phenotyping Market Revenue Share (%), by Import Market Analysis (Value & Volume) 2024 & 2032
                                                              66. Figure 66: Asia Pacific Plants Phenotyping Market Revenue (Million), by Export Market Analysis (Value & Volume) 2024 & 2032
                                                              67. Figure 67: Asia Pacific Plants Phenotyping Market Revenue Share (%), by Export Market Analysis (Value & Volume) 2024 & 2032
                                                              68. Figure 68: Asia Pacific Plants Phenotyping Market Revenue (Million), by Price Trend Analysis 2024 & 2032
                                                              69. Figure 69: Asia Pacific Plants Phenotyping Market Revenue Share (%), by Price Trend Analysis 2024 & 2032
                                                              70. Figure 70: Asia Pacific Plants Phenotyping Market Revenue (Million), by Country 2024 & 2032
                                                              71. Figure 71: Asia Pacific Plants Phenotyping Market Revenue Share (%), by Country 2024 & 2032

                                                              List of Tables

                                                              1. Table 1: Global Plants Phenotyping Market Revenue Million Forecast, by Region 2019 & 2032
                                                              2. Table 2: Global Plants Phenotyping Market Revenue Million Forecast, by Production Analysis 2019 & 2032
                                                              3. Table 3: Global Plants Phenotyping Market Revenue Million Forecast, by Consumption Analysis 2019 & 2032
                                                              4. Table 4: Global Plants Phenotyping Market Revenue Million Forecast, by Import Market Analysis (Value & Volume) 2019 & 2032
                                                              5. Table 5: Global Plants Phenotyping Market Revenue Million Forecast, by Export Market Analysis (Value & Volume) 2019 & 2032
                                                              6. Table 6: Global Plants Phenotyping Market Revenue Million Forecast, by Price Trend Analysis 2019 & 2032
                                                              7. Table 7: Global Plants Phenotyping Market Revenue Million Forecast, by Region 2019 & 2032
                                                              8. Table 8: Global Plants Phenotyping Market Revenue Million Forecast, by Country 2019 & 2032
                                                              9. Table 9: United States Plants Phenotyping Market Revenue (Million) Forecast, by Application 2019 & 2032
                                                              10. Table 10: Canada Plants Phenotyping Market Revenue (Million) Forecast, by Application 2019 & 2032
                                                              11. Table 11: Mexico Plants Phenotyping Market Revenue (Million) Forecast, by Application 2019 & 2032
                                                              12. Table 12: Rest of North America Plants Phenotyping Market Revenue (Million) Forecast, by Application 2019 & 2032
                                                              13. Table 13: Global Plants Phenotyping Market Revenue Million Forecast, by Country 2019 & 2032
                                                              14. Table 14: Germany Plants Phenotyping Market Revenue (Million) Forecast, by Application 2019 & 2032
                                                              15. Table 15: United Kingdom Plants Phenotyping Market Revenue (Million) Forecast, by Application 2019 & 2032
                                                              16. Table 16: France Plants Phenotyping Market Revenue (Million) Forecast, by Application 2019 & 2032
                                                              17. Table 17: Italy Plants Phenotyping Market Revenue (Million) Forecast, by Application 2019 & 2032
                                                              18. Table 18: Russia Plants Phenotyping Market Revenue (Million) Forecast, by Application 2019 & 2032
                                                              19. Table 19: Spain Plants Phenotyping Market Revenue (Million) Forecast, by Application 2019 & 2032
                                                              20. Table 20: Rest of Europe Plants Phenotyping Market Revenue (Million) Forecast, by Application 2019 & 2032
                                                              21. Table 21: Global Plants Phenotyping Market Revenue Million Forecast, by Country 2019 & 2032
                                                              22. Table 22: China Plants Phenotyping Market Revenue (Million) Forecast, by Application 2019 & 2032
                                                              23. Table 23: Japan Plants Phenotyping Market Revenue (Million) Forecast, by Application 2019 & 2032
                                                              24. Table 24: India Plants Phenotyping Market Revenue (Million) Forecast, by Application 2019 & 2032
                                                              25. Table 25: Australia Plants Phenotyping Market Revenue (Million) Forecast, by Application 2019 & 2032
                                                              26. Table 26: Rest of Asia Pacific Plants Phenotyping Market Revenue (Million) Forecast, by Application 2019 & 2032
                                                              27. Table 27: Global Plants Phenotyping Market Revenue Million Forecast, by Country 2019 & 2032
                                                              28. Table 28: Brazil Plants Phenotyping Market Revenue (Million) Forecast, by Application 2019 & 2032
                                                              29. Table 29: Argentina Plants Phenotyping Market Revenue (Million) Forecast, by Application 2019 & 2032
                                                              30. Table 30: Rest of South America Plants Phenotyping Market Revenue (Million) Forecast, by Application 2019 & 2032
                                                              31. Table 31: Global Plants Phenotyping Market Revenue Million Forecast, by Country 2019 & 2032
                                                              32. Table 32: South Africa Plants Phenotyping Market Revenue (Million) Forecast, by Application 2019 & 2032
                                                              33. Table 33: Rest of Africa Plants Phenotyping Market Revenue (Million) Forecast, by Application 2019 & 2032
                                                              34. Table 34: Global Plants Phenotyping Market Revenue Million Forecast, by Production Analysis 2019 & 2032
                                                              35. Table 35: Global Plants Phenotyping Market Revenue Million Forecast, by Consumption Analysis 2019 & 2032
                                                              36. Table 36: Global Plants Phenotyping Market Revenue Million Forecast, by Import Market Analysis (Value & Volume) 2019 & 2032
                                                              37. Table 37: Global Plants Phenotyping Market Revenue Million Forecast, by Export Market Analysis (Value & Volume) 2019 & 2032
                                                              38. Table 38: Global Plants Phenotyping Market Revenue Million Forecast, by Price Trend Analysis 2019 & 2032
                                                              39. Table 39: Global Plants Phenotyping Market Revenue Million Forecast, by Country 2019 & 2032
                                                              40. Table 40: United States Plants Phenotyping Market Revenue (Million) Forecast, by Application 2019 & 2032
                                                              41. Table 41: Canada Plants Phenotyping Market Revenue (Million) Forecast, by Application 2019 & 2032
                                                              42. Table 42: Mexico Plants Phenotyping Market Revenue (Million) Forecast, by Application 2019 & 2032
                                                              43. Table 43: Global Plants Phenotyping Market Revenue Million Forecast, by Production Analysis 2019 & 2032
                                                              44. Table 44: Global Plants Phenotyping Market Revenue Million Forecast, by Consumption Analysis 2019 & 2032
                                                              45. Table 45: Global Plants Phenotyping Market Revenue Million Forecast, by Import Market Analysis (Value & Volume) 2019 & 2032
                                                              46. Table 46: Global Plants Phenotyping Market Revenue Million Forecast, by Export Market Analysis (Value & Volume) 2019 & 2032
                                                              47. Table 47: Global Plants Phenotyping Market Revenue Million Forecast, by Price Trend Analysis 2019 & 2032
                                                              48. Table 48: Global Plants Phenotyping Market Revenue Million Forecast, by Country 2019 & 2032
                                                              49. Table 49: Brazil Plants Phenotyping Market Revenue (Million) Forecast, by Application 2019 & 2032
                                                              50. Table 50: Argentina Plants Phenotyping Market Revenue (Million) Forecast, by Application 2019 & 2032
                                                              51. Table 51: Rest of South America Plants Phenotyping Market Revenue (Million) Forecast, by Application 2019 & 2032
                                                              52. Table 52: Global Plants Phenotyping Market Revenue Million Forecast, by Production Analysis 2019 & 2032
                                                              53. Table 53: Global Plants Phenotyping Market Revenue Million Forecast, by Consumption Analysis 2019 & 2032
                                                              54. Table 54: Global Plants Phenotyping Market Revenue Million Forecast, by Import Market Analysis (Value & Volume) 2019 & 2032
                                                              55. Table 55: Global Plants Phenotyping Market Revenue Million Forecast, by Export Market Analysis (Value & Volume) 2019 & 2032
                                                              56. Table 56: Global Plants Phenotyping Market Revenue Million Forecast, by Price Trend Analysis 2019 & 2032
                                                              57. Table 57: Global Plants Phenotyping Market Revenue Million Forecast, by Country 2019 & 2032
                                                              58. Table 58: United Kingdom Plants Phenotyping Market Revenue (Million) Forecast, by Application 2019 & 2032
                                                              59. Table 59: Germany Plants Phenotyping Market Revenue (Million) Forecast, by Application 2019 & 2032
                                                              60. Table 60: France Plants Phenotyping Market Revenue (Million) Forecast, by Application 2019 & 2032
                                                              61. Table 61: Italy Plants Phenotyping Market Revenue (Million) Forecast, by Application 2019 & 2032
                                                              62. Table 62: Spain Plants Phenotyping Market Revenue (Million) Forecast, by Application 2019 & 2032
                                                              63. Table 63: Russia Plants Phenotyping Market Revenue (Million) Forecast, by Application 2019 & 2032
                                                              64. Table 64: Benelux Plants Phenotyping Market Revenue (Million) Forecast, by Application 2019 & 2032
                                                              65. Table 65: Nordics Plants Phenotyping Market Revenue (Million) Forecast, by Application 2019 & 2032
                                                              66. Table 66: Rest of Europe Plants Phenotyping Market Revenue (Million) Forecast, by Application 2019 & 2032
                                                              67. Table 67: Global Plants Phenotyping Market Revenue Million Forecast, by Production Analysis 2019 & 2032
                                                              68. Table 68: Global Plants Phenotyping Market Revenue Million Forecast, by Consumption Analysis 2019 & 2032
                                                              69. Table 69: Global Plants Phenotyping Market Revenue Million Forecast, by Import Market Analysis (Value & Volume) 2019 & 2032
                                                              70. Table 70: Global Plants Phenotyping Market Revenue Million Forecast, by Export Market Analysis (Value & Volume) 2019 & 2032
                                                              71. Table 71: Global Plants Phenotyping Market Revenue Million Forecast, by Price Trend Analysis 2019 & 2032
                                                              72. Table 72: Global Plants Phenotyping Market Revenue Million Forecast, by Country 2019 & 2032
                                                              73. Table 73: Turkey Plants Phenotyping Market Revenue (Million) Forecast, by Application 2019 & 2032
                                                              74. Table 74: Israel Plants Phenotyping Market Revenue (Million) Forecast, by Application 2019 & 2032
                                                              75. Table 75: GCC Plants Phenotyping Market Revenue (Million) Forecast, by Application 2019 & 2032
                                                              76. Table 76: North Africa Plants Phenotyping Market Revenue (Million) Forecast, by Application 2019 & 2032
                                                              77. Table 77: South Africa Plants Phenotyping Market Revenue (Million) Forecast, by Application 2019 & 2032
                                                              78. Table 78: Rest of Middle East & Africa Plants Phenotyping Market Revenue (Million) Forecast, by Application 2019 & 2032
                                                              79. Table 79: Global Plants Phenotyping Market Revenue Million Forecast, by Production Analysis 2019 & 2032
                                                              80. Table 80: Global Plants Phenotyping Market Revenue Million Forecast, by Consumption Analysis 2019 & 2032
                                                              81. Table 81: Global Plants Phenotyping Market Revenue Million Forecast, by Import Market Analysis (Value & Volume) 2019 & 2032
                                                              82. Table 82: Global Plants Phenotyping Market Revenue Million Forecast, by Export Market Analysis (Value & Volume) 2019 & 2032
                                                              83. Table 83: Global Plants Phenotyping Market Revenue Million Forecast, by Price Trend Analysis 2019 & 2032
                                                              84. Table 84: Global Plants Phenotyping Market Revenue Million Forecast, by Country 2019 & 2032
                                                              85. Table 85: China Plants Phenotyping Market Revenue (Million) Forecast, by Application 2019 & 2032
                                                              86. Table 86: India Plants Phenotyping Market Revenue (Million) Forecast, by Application 2019 & 2032
                                                              87. Table 87: Japan Plants Phenotyping Market Revenue (Million) Forecast, by Application 2019 & 2032
                                                              88. Table 88: South Korea Plants Phenotyping Market Revenue (Million) Forecast, by Application 2019 & 2032
                                                              89. Table 89: ASEAN Plants Phenotyping Market Revenue (Million) Forecast, by Application 2019 & 2032
                                                              90. Table 90: Oceania Plants Phenotyping Market Revenue (Million) Forecast, by Application 2019 & 2032
                                                              91. Table 91: Rest of Asia Pacific Plants Phenotyping Market Revenue (Million) Forecast, by Application 2019 & 2032


                                                              Frequently Asked Questions

                                                              1. What is the projected Compound Annual Growth Rate (CAGR) of the Plants Phenotyping Market?

                                                              The projected CAGR is approximately 10.50%.

                                                              2. Which companies are prominent players in the Plants Phenotyping Market?

                                                              Key companies in the market include Rothamsted Research, Phenospex, Delta-T Devices, Keygene, PSI (Photon Systems Instruments), BASF SE (Crop Design), Heinz Walz GmbH, The Vienna Biocenter Core Facilities, LemnaTec GmbH, Phenomix, WP, Qubit Systems.

                                                              3. What are the main segments of the Plants Phenotyping Market?

                                                              The market segments include Production Analysis, Consumption Analysis, Import Market Analysis (Value & Volume), Export Market Analysis (Value & Volume), Price Trend Analysis.

                                                              4. Can you provide details about the market size?

                                                              The market size is estimated to be USD 281.32 Million as of 2022.

                                                              5. What are some drivers contributing to market growth?

                                                              Demand For Landscaping Maintenance; Adoption of Green Spaces and Green Roofs.

                                                              6. What are the notable trends driving market growth?

                                                              Increasing Number of Seed Borne Diseases is Driving the Market.

                                                              7. Are there any restraints impacting market growth?

                                                              Shortage of Labor In Landscaping; High Maintenance Cost of Lawn Mowers.

                                                              8. Can you provide examples of recent developments in the market?

                                                              N/A

                                                              9. What pricing options are available for accessing the report?

                                                              Pricing options include single-user, multi-user, and enterprise licenses priced at USD 4750, USD 5250, and USD 8750 respectively.

                                                              10. Is the market size provided in terms of value or volume?

                                                              The market size is provided in terms of value, measured in Million.

                                                              11. Are there any specific market keywords associated with the report?

                                                              Yes, the market keyword associated with the report is "Plants Phenotyping Market," which aids in identifying and referencing the specific market segment covered.

                                                              12. How do I determine which pricing option suits my needs best?

                                                              The pricing options vary based on user requirements and access needs. Individual users may opt for single-user licenses, while businesses requiring broader access may choose multi-user or enterprise licenses for cost-effective access to the report.

                                                              13. Are there any additional resources or data provided in the Plants Phenotyping Market report?

                                                              While the report offers comprehensive insights, it's advisable to review the specific contents or supplementary materials provided to ascertain if additional resources or data are available.

                                                              14. How can I stay updated on further developments or reports in the Plants Phenotyping Market?

                                                              To stay informed about further developments, trends, and reports in the Plants Phenotyping Market, consider subscribing to industry newsletters, following relevant companies and organizations, or regularly checking reputable industry news sources and publications.


                                                              Methodology

                                                              Step 1 - Identification of Relevant Samples Size from Population Database

                                                              Step Chart
                                                              Bar Chart
                                                              Method Chart

                                                              Step 2 - Approaches for Defining Global Market Size (Value, Volume* & Price*)

                                                              Approach Chart
                                                              Top-down and bottom-up approaches are used to validate the global market size and estimate the market size for manufactures, regional segments, product, and application.

                                                              Note*: In applicable scenarios

                                                              Step 3 - Data Sources

                                                              Primary Research

                                                              • Web Analytics
                                                              • Survey Reports
                                                              • Research Institute
                                                              • Latest Research Reports
                                                              • Opinion Leaders

                                                              Secondary Research

                                                              • Annual Reports
                                                              • White Paper
                                                              • Latest Press Release
                                                              • Industry Association
                                                              • Paid Database
                                                              • Investor Presentations
                                                              Analyst Chart

                                                              Step 4 - Data Triangulation

                                                              Involves using different sources of information in order to increase the validity of a study

                                                              These sources are likely to be stakeholders in a program - participants, other researchers, program staff, other community members, and so on.

                                                              Then we put all data in single framework & apply various statistical tools to find out the dynamic on the market.

                                                              During the analysis stage, feedback from the stakeholder groups would be compared to determine areas of agreement as well as areas of divergence

                                                              Additionally, after gathering mixed and scattered data from a wide range of sources, data is triangulated and correlated to come up with estimated figures which are further validated through primary mediums or industry experts, opinion leaders.

                                                              About Research Axiom

                                                              Research Axiom delivers in-depth market research, industry analysis, and consulting for pharmaceuticals, automotive, IT, and consumer goods. Our reports provide the clarity you need to make informed decisions and drive innovation.

                                                              Our team combines primary research, advanced analytics, and sector expertise to deliver actionable intelligence. We offer syndicated reports, custom research, and consulting services tailored to your business needs.

                                                              At Research Axiom, we are committed to quality, transparency, and client satisfaction. Every report is rigorously validated to ensure accuracy and relevance. Our global perspective and local expertise help you understand both the big picture and the finer details of your market.

                                                              Stay informed with Research Axiom. Subscribe to our newsletter for the latest updates and research highlights, and follow us on social media for real-time insights. Research Axiom – Turning Data into Business Advantage.

                                                              • Home
                                                              • About Us
                                                              • Industries
                                                                • Aerospace & Defense
                                                                • Agriculture
                                                                • Animal Nutrition & Wellness
                                                                • Automotive
                                                                • Chemicals & Materials
                                                                • Consumer Goods and Services
                                                                • Energy & Power
                                                                • Financial Services and Investment Intelligence
                                                                • Food & Beverage
                                                                • Home and Property Improvement
                                                                • Hospitality and Tourism
                                                                • Logistics
                                                                • Manufacturing Products and Services
                                                                • Packaging
                                                                • Professional and Commercial Services
                                                                • Real Estate and Construction
                                                                • Retail
                                                                • Technology, Media and Telecom
                                                                • Healthcare
                                                              • Services
                                                              • Contact
                                                              Main Logo
                                                              • Home
                                                              • About Us
                                                              • Industries
                                                                • Aerospace & Defense
                                                                • Agriculture
                                                                • Animal Nutrition & Wellness
                                                                • Automotive
                                                                • Chemicals & Materials
                                                                • Consumer Goods and Services
                                                                • Energy & Power
                                                                • Financial Services and Investment Intelligence
                                                                • Food & Beverage
                                                                • Home and Property Improvement
                                                                • Hospitality and Tourism
                                                                • Logistics
                                                                • Manufacturing Products and Services
                                                                • Packaging
                                                                • Professional and Commercial Services
                                                                • Real Estate and Construction
                                                                • Retail
                                                                • Technology, Media and Telecom
                                                                • Healthcare
                                                              • Services
                                                              • Contact
                                                              +17162654855
                                                              [email protected]

                                                              +17162654855

                                                              [email protected]

                                                              Business Address

                                                              Head Office

                                                              Office no. A 5010, fifth floor, Solitaire Business Hub, Near Phoenix mall, Pune, Maharashtra 411014

                                                              Contact Information

                                                              Craig Francis

                                                              Business Development Head

                                                              +17162654855

                                                              [email protected]

                                                              Connect With Us

                                                              Secure Payment Partners

                                                              payment image
                                                              RetailLogisticsPackagingAutomotiveHealthcareAgricultureEnergy & PowerFood & BeverageAerospace & DefenseChemicals & MaterialsHospitality and TourismAnimal Nutrition & WellnessConsumer Goods and ServicesReal Estate and ConstructionHome and Property ImprovementTechnology, Media and TelecomManufacturing Products and ServicesFinancial Services and Investment Intelligence

                                                              © 2025 All rights reserved


                                                              Privacy Policy
                                                              Terms and Conditions
                                                              FAQ
                                                              artwork spiralartwork spiralRelated Reports
                                                              artwork underline

                                                              Alfalfa Hay Market in Italy Future-proof Strategies: Trends, Competitor Dynamics, and Opportunities 2025-2033

                                                              Discover the latest insights into Italy's thriving alfalfa hay market. Explore market size, CAGR, key drivers, trends, and competitive landscape analysis for 2025-2033. Learn about segment growth in bales, pellets, and cubes across animal feed applications.

                                                              July 2025
                                                              Base Year: 2024
                                                              No Of Pages: 150
                                                              Price: $3800

                                                              India Biopesticides Industry Market Disruption: Competitor Insights and Trends 2025-2033

                                                              The India biopesticides market is booming, projected to reach ₹237.3 Billion (USD 2847.6 million) by 2033, driven by growing demand for sustainable agriculture and stricter regulations. Learn about key market trends, leading companies, and regional growth forecasts in this comprehensive analysis.

                                                              July 2025
                                                              Base Year: 2024
                                                              No Of Pages: 197
                                                              Price: $3800

                                                              Decoding Almond Market Consumer Preferences 2025-2033

                                                              Discover the booming almond market! Explore its $10.12B valuation (2025), 5.55% CAGR, key drivers, trends, and regional insights. Learn about leading companies and diverse product types including almond butter, flour, and oil. Uncover future growth projections for the almond industry until 2033.

                                                              July 2025
                                                              Base Year: 2024
                                                              No Of Pages: 234
                                                              Price: $4750

                                                              Bio Organic Fertilizer Market Insightful Market Analysis: Trends and Opportunities 2025-2033

                                                              The global bio organic fertilizer market is booming, projected to reach [estimated 2033 value] by 2033 with a CAGR of 5.90%. Discover key market trends, drivers, restraints, and leading companies shaping this sustainable agriculture sector. Learn more about organic fertilizer types, applications, and regional market analysis.

                                                              July 2025
                                                              Base Year: 2024
                                                              No Of Pages: 150
                                                              Price: $4750

                                                              Exploring Saudi Arabia Agriculture Market’s Market Size Dynamics 2025-2033

                                                              Discover the booming Saudi Arabia agriculture market! Projected to reach \$28.3 billion by 2033 with a 5.2% CAGR, this report analyzes market size, key players (Carrefour, Lulu Group), regional trends, and growth drivers. Learn about opportunities and challenges in this dynamic sector.

                                                              July 2025
                                                              Base Year: 2024
                                                              No Of Pages: 197
                                                              Price: $3800

                                                              Lentil Industry Charting Growth Trajectories 2025-2033: Strategic Insights and Forecasts

                                                              Discover the booming lentil market! Explore key trends, regional insights, and leading companies driving growth in this $X billion industry (2025 estimate) projected to reach $X billion by 2033. Learn about the rising demand for whole, split, and dehulled lentils in dry, canned, and frozen forms. Get the complete market analysis now!

                                                              July 2025
                                                              Base Year: 2024
                                                              No Of Pages: 234
                                                              Price: $4750

                                                              USA Agricultural Irrigation Machinery Market Soars to XXX Million, witnessing a CAGR of XX during the forecast period 2025-2033

                                                              Discover the booming US agricultural irrigation machinery market! This in-depth analysis reveals key trends, growth drivers, and leading companies from 2025-2033. Learn about the impact of precision agriculture, water scarcity, and government initiatives on the market's future. Explore segments like drip, sprinkler, and pivot irrigation systems.

                                                              July 2025
                                                              Base Year: 2024
                                                              No Of Pages: 150
                                                              Price: $3800

                                                              South America Biological Organic Fertilizers Industry 2025 to Grow at XX CAGR with XXX Million Market Size: Analysis and Forecasts 2033

                                                              Discover the booming South American biological organic fertilizer market! Projected to reach [estimated 2033 value based on CAGR] by 2033, this market is driven by sustainable agriculture trends and growing demand for eco-friendly farming. Learn about key players, market segments (cereals, legumes, fruits & vegetables), and growth opportunities in Brazil, Argentina, and beyond.

                                                              July 2025
                                                              Base Year: 2024
                                                              No Of Pages: 150
                                                              Price: $4750

                                                              Exploring Barriers in North American Olives Market Market: Trends and Analysis 2025-2033

                                                              Discover the booming North American olives market! This comprehensive analysis reveals a $6.9B market with a 5.74% CAGR (2025-2033), driven by health trends & Mediterranean diet popularity. Explore market segmentation, key players (Napa Valley Olive Oil, Musco Family Olive Co., etc.), and future growth projections for olive oil, table olives, and more.

                                                              July 2025
                                                              Base Year: 2024
                                                              No Of Pages: 180
                                                              Price: $4750

                                                              Analyzing Competitor Moves: Iran Agricultural Sector Analysis Growth Outlook 2025-2033

                                                              Discover the growth opportunities and challenges within Iran's agricultural sector. This comprehensive analysis covers market size, CAGR, key drivers, trends, and regional variations across food crops, cash crops, fruits, vegetables, dairy, and fishery from 2019-2033. Gain valuable insights into this dynamic market.

                                                              July 2025
                                                              Base Year: 2024
                                                              No Of Pages: 150
                                                              Price: $3800

                                                              South America Agricultual Films Market Market’s Drivers and Challenges: Strategic Overview 2025-2033

                                                              Discover the booming South American agricultural films market! This in-depth analysis reveals a CAGR of 6.10% to 2033, driven by growing demand for modern farming techniques and food security. Explore key trends, leading companies (Dow, Agroflex, etc.), and regional insights for Brazil, Argentina, and beyond. Learn how this expanding market presents lucrative opportunities.

                                                              July 2025
                                                              Base Year: 2024
                                                              No Of Pages: 150
                                                              Price: $4750

                                                              Analyzing Coffee Trade Analysis Industry: Opportunities and Growth Patterns 2025-2033

                                                              Discover the latest insights into the booming global coffee trade market. This comprehensive analysis reveals key trends, growth drivers, and market segmentation for Arabica, Robusta, and various coffee processing methods. Explore regional market shares and leading companies like Starbucks & Nestlé. Project your business strategy with our 2025-2033 forecast.

                                                              July 2025
                                                              Base Year: 2024
                                                              No Of Pages: 150
                                                              Price: $4750

                                                              Kiwi Fruit Market Insightful Market Analysis: Trends and Opportunities 2025-2033

                                                              Discover the booming kiwi fruit market! This comprehensive analysis reveals a $1.89B market in 2025, projected to reach significant heights by 2033 with a 5.02% CAGR. Explore key drivers, regional trends, and leading companies shaping this dynamic industry.

                                                              July 2025
                                                              Base Year: 2024
                                                              No Of Pages: 180
                                                              Price: $4750

                                                              Africa Chia Seeds Industry: Growth Opportunities and Competitive Landscape Overview 2025-2033

                                                              Discover the booming Africa chia seeds market! Explore its $13.87M valuation (2025), 2.10% CAGR, key segments (organic, food & beverage, supplements), and leading companies. Learn about growth drivers, trends, and regional insights (South Africa, UAE) in this comprehensive market analysis.

                                                              July 2025
                                                              Base Year: 2024
                                                              No Of Pages: 180
                                                              Price: $4750

                                                              China Pesticide Industry Market Report: Strategic Insights

                                                              Discover the booming China pesticide market, projected to reach $XX million by 2025 and grow at a CAGR of 6.60% until 2033. Analyze key trends, leading companies (Bayer, Syngenta, UPL), and market segmentation (fungicides, herbicides, insecticides, etc.) impacting this dynamic sector.

                                                              July 2025
                                                              Base Year: 2024
                                                              No Of Pages: 197
                                                              Price: $3800

                                                              Global Metal Chelates Market Future-proof Strategies: Trends, Competitor Dynamics, and Opportunities 2025-2033

                                                              Discover the booming global metal chelates market! This comprehensive analysis reveals a CAGR of 10.20%, driven by surging demand for efficient micronutrient delivery in agriculture. Explore market size, segmentation (crop type, product type, application), key players, and regional trends for 2025-2033.

                                                              July 2025
                                                              Base Year: 2024
                                                              No Of Pages: 197
                                                              Price: $3800

                                                              Fresh Cherries Industry CAGR Trends: Growth Outlook 2025-2033

                                                              Discover the booming fresh cherries market! This in-depth analysis reveals key trends, drivers, and restraints, along with regional market share data and projections to 2033. Learn about leading companies and explore growth opportunities in this lucrative sector.

                                                              July 2025
                                                              Base Year: 2024
                                                              No Of Pages: 180
                                                              Price: $4750

                                                              North American Wheat Seed Treatment 2025 Market Trends and 2033 Forecasts: Exploring Growth Potential

                                                              Discover the booming North American wheat seed treatment market! Learn about key growth drivers, emerging trends, major players like Bayer and Syngenta, and the projected CAGR of 7.30% through 2033. Explore market segmentation by product type, application, and crop type in this comprehensive analysis.

                                                              July 2025
                                                              Base Year: 2024
                                                              No Of Pages: 197
                                                              Price: $3800

                                                              Fresh Peaches Market Market Analysis and Forecasts

                                                              Discover the thriving fresh peaches market! This in-depth analysis reveals a projected CAGR of 3.20% to 2033, driven by health trends and culinary innovation. Explore market segmentation, key players like Del Monte and Dole, and regional growth projections for North America, Europe, and Asia Pacific. Learn more about the opportunities and challenges shaping this dynamic industry.

                                                              July 2025
                                                              Base Year: 2024
                                                              No Of Pages: 234
                                                              Price: $4750

                                                              Thailand Vegetable Seed Market’s Role in Shaping Industry Trends 2025-2033

                                                              Discover the booming Thailand vegetable seed market! This comprehensive analysis reveals a CAGR of 5.20% through 2033, driven by rising demand, technological advancements, and government initiatives. Explore market segmentation, key players, and future trends in this lucrative sector.

                                                              July 2025
                                                              Base Year: 2024
                                                              No Of Pages: 150
                                                              Price: $3800