

Key Insights
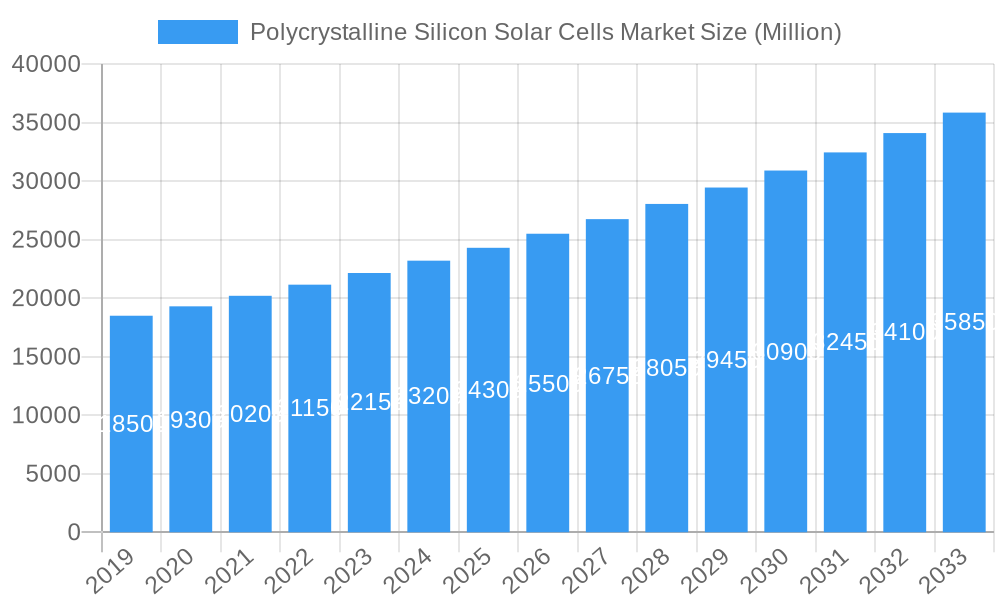
The global Polycrystalline Silicon Solar Cells market is poised for significant expansion, projected to reach $49.44 billion by 2025, with a Compound Annual Growth Rate (CAGR) of 11.6% through the forecast period (2025-2033). This growth is propelled by the escalating global imperative for renewable energy solutions to address climate change and reduce fossil fuel dependency. Supportive government policies, including subsidies and mandates, are actively fostering solar infrastructure investment across residential, commercial, and utility-scale applications. Declining manufacturing costs and enhanced cell efficiency further solidify polycrystalline silicon solar cells as a cost-effective power generation choice. Increased environmental consciousness is also a key demand driver.
Polycrystalline Silicon Solar Cells Market Market Size (In Billion)
While market expansion is robust, potential challenges include supply chain volatility, fluctuating raw material costs, and the emergence of alternative solar technologies. Nevertheless, the established reliability and cost-competitiveness of polycrystalline silicon are expected to ensure its continued market leadership. The market is segmented by technology into Crystalline Silicon Cells, Thin Film Cells, and Ultra Thin Film Cells, with Crystalline Silicon Cells currently dominating. Applications span Residential, Commercial, and Utility sectors, with utility-scale installations anticipated to lead. Geographically, the Asia Pacific region is projected to maintain its leading position, driven by strong government support, energy demand, and manufacturing prowess.
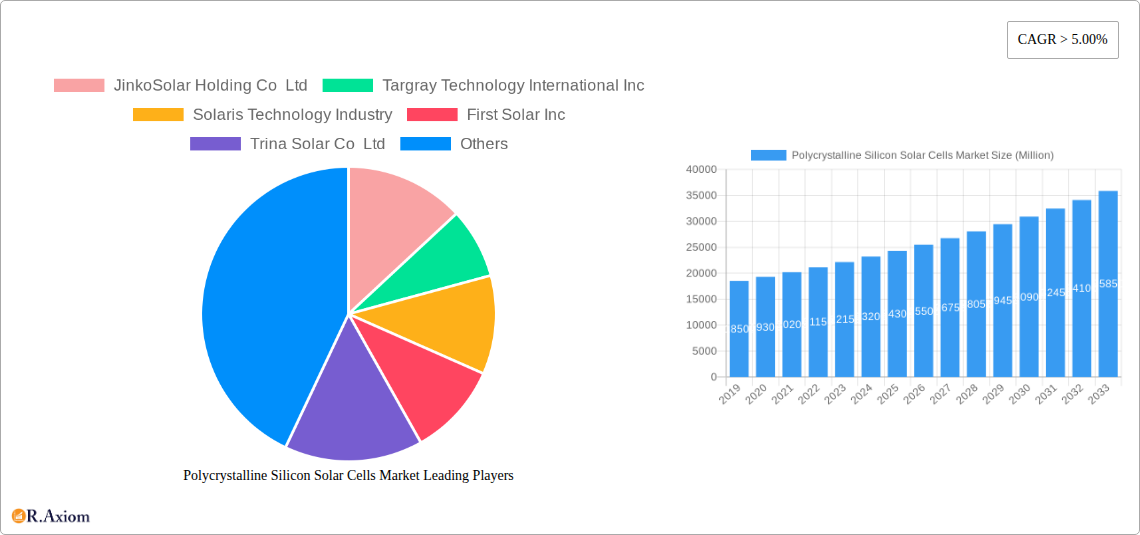
Polycrystalline Silicon Solar Cells Market Company Market Share
This comprehensive market analysis offers deep insights into the global polycrystalline silicon solar cells market, examining historical performance and future projections. Covering the period from 2019 to 2033, with 2025 as the base year, this report provides actionable intelligence for industry stakeholders. We meticulously analyze market segmentation by technology (Crystalline Silicon Cells, Thin Film Cells, Ultra Thin Film Cells) and application (Residential, Commercial, Utility), alongside market concentration, innovation, regulatory landscapes, competitive dynamics, and emerging opportunities.
Polycrystalline Silicon Solar Cells Market Market Concentration & Innovation
The polycrystalline silicon solar cells market exhibits a moderate to high level of concentration, with a few key players dominating the global landscape. Major innovators are continuously investing in research and development to enhance cell efficiency, reduce manufacturing costs, and improve the durability of solar panels. Key innovation drivers include advancements in wafer processing, cell architecture, and passivation techniques, aimed at boosting power output and lowering the levelized cost of electricity (LCOE). Regulatory frameworks, such as government incentives, renewable energy targets, and net metering policies, play a crucial role in shaping market dynamics and driving adoption. Product substitutes, primarily monocrystalline silicon solar cells and emerging thin-film technologies, pose a competitive threat, pushing poly-Si manufacturers to focus on cost-effectiveness and performance. End-user trends indicate a growing preference for decentralized energy generation and smart grid integration, further influencing product development. Mergers and acquisitions (M&A) are strategically employed by leading companies to consolidate market share, acquire new technologies, and expand geographical reach. For instance, recent M&A deals in the solar industry, with reported values in the hundreds of millions of dollars, highlight the strategic importance of inorganic growth. Market share for poly-Si technology remains substantial, though it faces increasing competition from mono-Si in certain high-efficiency segments.
Polycrystalline Silicon Solar Cells Market Industry Trends & Insights
The polycrystalline silicon solar cells market is experiencing robust growth, driven by an escalating global demand for renewable energy solutions. The compound annual growth rate (CAGR) is projected to be significant, fueled by government initiatives to combat climate change, decreasing solar panel costs, and rising electricity prices from conventional sources. Technological disruptions are constantly emerging, with ongoing research into higher efficiency poly-Si cells, such as PERC (Passivated Emitter and Rear Cell) technology, and advancements in manufacturing processes that reduce waste and energy consumption. Consumer preferences are shifting towards sustainable energy options, with an increasing awareness of environmental issues and a desire for energy independence. This trend is particularly evident in the residential and commercial sectors, where rooftop solar installations are becoming more commonplace. Competitive dynamics within the market are characterized by intense price competition and a relentless pursuit of technological superiority. Companies are focusing on optimizing their supply chains, improving manufacturing yields, and developing integrated solar solutions to stay ahead. The market penetration of solar energy, while growing rapidly, still has substantial room for expansion, especially in emerging economies. The transition towards cleaner energy is accelerating, making solar power a cornerstone of future energy portfolios. The increasing adoption of solar power in various industries, from manufacturing to agriculture, further underscores its market penetration potential.
Dominant Markets & Segments in Polycrystalline Silicon Solar Cells Market
The polycrystalline silicon solar cells market is characterized by a clear dominance in specific regions and applications. Asia-Pacific, particularly China, stands out as the leading region, driven by supportive government policies, massive domestic demand, and a well-established manufacturing ecosystem for solar components. Within this region, China consistently leads in terms of production capacity and solar installations, supported by economic policies promoting renewable energy development and substantial infrastructure investments in the solar sector.
By Technology, Crystalline Silicon Cells as a whole, which includes both monocrystalline and polycrystalline silicon, are by far the dominant technology segment. Polycrystalline silicon cells, specifically, maintain a significant market share due to their established cost-effectiveness and proven reliability, making them a preferred choice for large-scale utility applications and cost-sensitive commercial projects. While Thin Film Cells and Ultra Thin Film Cells offer advantages in certain niche applications (e.g., flexibility, low-light performance), they have not yet reached the same level of market penetration or cost parity as their crystalline silicon counterparts.
By Application, the Utility segment is a major driver of demand for polycrystalline silicon solar cells. Large-scale solar farms, often supported by long-term power purchase agreements and government subsidies, are primarily powered by cost-efficient poly-Si modules. The Commercial sector is also a significant contributor, with businesses increasingly adopting solar energy to reduce operational costs and enhance their corporate social responsibility (CSR) profiles. The Residential segment, while growing, often sees a higher proportion of monocrystalline silicon due to its slightly higher efficiency and aesthetic preferences in some markets. However, the cost advantage of polycrystalline silicon still makes it a viable option for many homeowners seeking to reduce their electricity bills. Key drivers for dominance in these segments include:
- Economic Policies: Government incentives, tax credits, and renewable portfolio standards (RPS) directly influence investment in utility-scale projects and commercial installations.
- Infrastructure Development: Investments in grid modernization and energy storage solutions are crucial for the seamless integration of large solar farms.
- Cost Competitiveness: The ability of polycrystalline silicon to offer a lower LCOE remains a primary factor for its widespread adoption in utility and commercial segments.
- Technological Advancements: Continuous improvements in poly-Si cell efficiency and manufacturing processes keep it competitive against other technologies.
Polycrystalline Silicon Solar Cells Market Product Developments
Product developments in the polycrystalline silicon solar cells market are focused on enhancing efficiency and reducing costs. Innovations in cell architecture, such as multi-busbar designs and advanced wafering techniques, are improving performance. Manufacturers are also developing more robust and durable modules to withstand diverse environmental conditions, leading to extended product lifespans and reduced maintenance needs. The competitive advantage for polycrystalline silicon lies in its established manufacturing base, scalability, and a proven track record of reliability, making it a cost-effective solution for a wide range of applications.
Report Scope & Segmentation Analysis
This report meticulously analyzes the polycrystalline silicon solar cells market across key segmentations.
By Technology:
- Crystalline Silicon Cells: This segment encompasses traditional polycrystalline silicon cells, which are a dominant force in the market due to their cost-effectiveness and widespread adoption. Growth projections indicate continued strong demand, particularly in large-scale installations.
- Thin Film Cells: While a smaller segment compared to crystalline silicon, thin-film technologies continue to find applications where flexibility or specific performance characteristics are required. Their market size is expected to grow modestly, driven by niche applications.
- Ultra Thin Film Cells: This emerging segment is characterized by rapid innovation and the potential for significant breakthroughs in efficiency and material usage. Growth projections are high but from a smaller base, with significant R&D investments anticipated.
By Application:
- Residential: This segment is driven by increasing homeowner adoption of solar energy for cost savings and environmental consciousness. Growth is steady, with a significant market size and ongoing expansion.
- Commercial: Businesses are increasingly investing in solar to reduce operational expenses and meet sustainability goals. This segment represents a substantial market size with robust growth prospects.
- Utility: Large-scale solar farms for power generation constitute a significant portion of the market. This segment is characterized by large project sizes and is heavily influenced by government policies and grid integration capabilities. Its market size is vast, with continued expansion projected.
Key Drivers of Polycrystalline Silicon Solar Cells Market Growth
The polycrystalline silicon solar cells market is propelled by several key drivers. Technologically, continuous improvements in cell efficiency and manufacturing processes are reducing costs and enhancing performance. Economically, the declining cost of solar power, coupled with rising conventional energy prices, makes solar increasingly attractive for both utility-scale projects and end-users. Regulatory factors, such as government incentives, renewable energy targets, and favorable policies for solar deployment, are crucial in stimulating investment and market expansion. The growing global focus on decarbonization and the urgent need to address climate change are also significant catalysts, driving demand for clean energy alternatives.
Challenges in the Polycrystalline Silicon Solar Cells Market Sector
Despite its growth, the polycrystalline silicon solar cells market faces several challenges. Regulatory hurdles, such as complex permitting processes and inconsistent policy support in some regions, can impede project development. Supply chain issues, including the availability of raw materials like polysilicon and disruptions in global logistics, can lead to price volatility and project delays. Competitive pressures from other solar technologies, particularly monocrystalline silicon which offers higher efficiencies in some applications, necessitate continuous innovation and cost optimization. Furthermore, the intermittency of solar power generation requires significant investment in grid modernization and energy storage solutions, which can add to overall project costs.
Emerging Opportunities in Polycrystalline Silicon Solar Cells Market
Emerging opportunities in the polycrystalline silicon solar cells market are abundant. The expansion of solar energy into developing economies presents a vast untapped market potential. Advancements in energy storage technologies, such as improved battery solutions, are addressing the intermittency challenge, making solar more reliable. The integration of solar power with smart grid technologies and electric vehicles (EVs) is creating new avenues for energy management and demand response. Furthermore, the increasing adoption of building-integrated photovoltaics (BIPV) and floating solar farms offers innovative installation possibilities.
Leading Players in the Polycrystalline Silicon Solar Cells Market Market
- JinkoSolar Holding Co Ltd
- Targray Technology International Inc
- Solaris Technology Industry
- First Solar Inc
- Trina Solar Co Ltd
- Suniva Inc
- Sunpower Corporation
- Canadian Solar Inc
- Tata Power Solar Systems Ltd
- Sharp Corporation
Key Developments in Polycrystalline Silicon Solar Cells Market Industry
- April 2022: Tongwei, a prominent solar polysilicon and cell manufacturer, announced plans to significantly increase its manufacturing capacity over the next four years. This strategic expansion follows a reported six-fold increase in net profit during Q1 2022, underscoring the company's robust financial performance and confidence in market growth. Tongwei expects to reach 350,000 metric tons (MT) of polysilicon capacity by the end of 2023, indicating a substantial commitment to meeting projected demand.
Strategic Outlook for Polycrystalline Silicon Solar Cells Market Market
The strategic outlook for the polycrystalline silicon solar cells market is overwhelmingly positive, driven by the global imperative for sustainable energy and the increasing economic viability of solar power. Future market potential lies in continued technological advancements that push the boundaries of efficiency and cost-effectiveness, alongside the expansion into new geographical markets with growing energy demands. The ongoing development of integrated energy solutions, including solar-plus-storage and smart grid technologies, will further enhance the value proposition of polycrystalline silicon solar cells. Manufacturers are expected to focus on supply chain resilience, vertical integration, and strategic partnerships to maintain their competitive edge and capitalize on the accelerating transition to renewable energy.
Polycrystalline Silicon Solar Cells Market Segmentation
-
1. BY Technology
- 1.1. Crystalline Silicon Cells
- 1.2. Thin Film Cells
- 1.3. Ultra Thin Film Cells
-
2. BY Application
- 2.1. Residential
- 2.2. Commercial
- 2.3. Utility
Polycrystalline Silicon Solar Cells Market Segmentation By Geography
- 1. North America
- 2. Europe
- 3. Asia Pacific
- 4. South America
- 5. Middle East and Africa
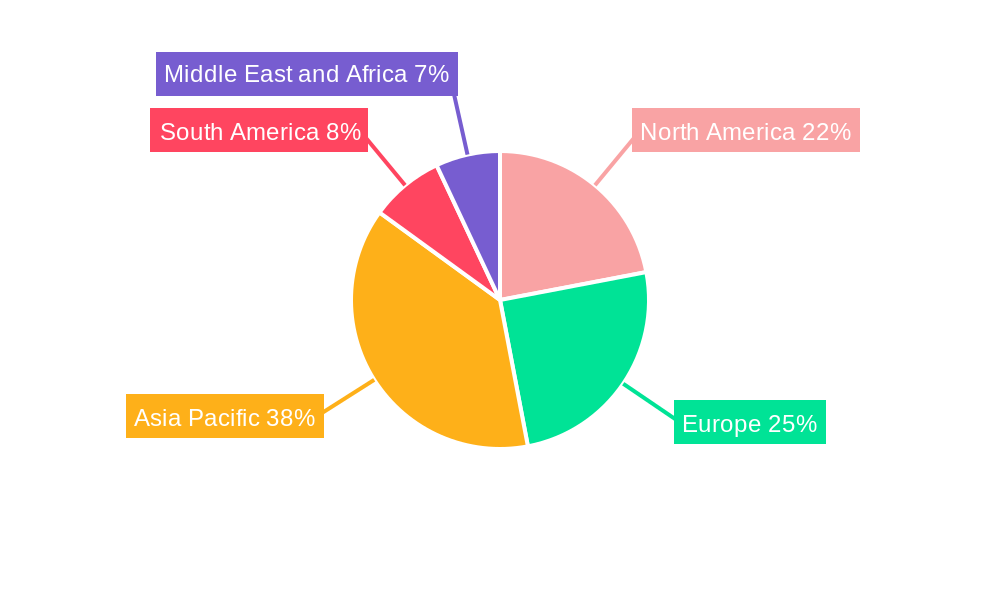
Polycrystalline Silicon Solar Cells Market Regional Market Share
Geographic Coverage of Polycrystalline Silicon Solar Cells Market
Polycrystalline Silicon Solar Cells Market REPORT HIGHLIGHTS
| Aspects | Details |
|---|---|
| Study Period | 2020-2034 |
| Base Year | 2025 |
| Estimated Year | 2026 |
| Forecast Period | 2026-2034 |
| Historical Period | 2020-2025 |
| Growth Rate | CAGR of 11.6% from 2020-2034 |
| Segmentation |
|
Table of Contents
- 1. Introduction
- 1.1. Research Scope
- 1.2. Market Segmentation
- 1.3. Research Objective
- 1.4. Definitions and Assumptions
- 2. Executive Summary
- 2.1. Market Snapshot
- 3. Market Dynamics
- 3.1. Market Drivers
- 3.2. Market Restrains
- 3.3. Market Trends
- 3.4. Market Opportunities
- 4. Market Factor Analysis
- 4.1. Porters Five Forces
- 4.1.1. Bargaining Power of Suppliers
- 4.1.2. Bargaining Power of Buyers
- 4.1.3. Threat of New Entrants
- 4.1.4. Threat of Substitutes
- 4.1.5. Competitive Rivalry
- 4.2. PESTEL analysis
- 4.3. BCG Analysis
- 4.3.1. Stars (High Growth, High Market Share)
- 4.3.2. Cash Cows (Low Growth, High Market Share)
- 4.3.3. Question Mark (High Growth, Low Market Share)
- 4.3.4. Dogs (Low Growth, Low Market Share)
- 4.4. Ansoff Matrix Analysis
- 4.5. Supply Chain Analysis
- 4.6. Regulatory Landscape
- 4.7. Current Market Potential and Opportunity Assessment (TAM–SAM–SOM Framework)
- 4.8. RAX Analyst Note
- 4.1. Porters Five Forces
- 5. Market Analysis, Insights and Forecast 2021-2033
- 5.1. Market Analysis, Insights and Forecast - by BY Technology
- 5.1.1. Crystalline Silicon Cells
- 5.1.2. Thin Film Cells
- 5.1.3. Ultra Thin Film Cells
- 5.2. Market Analysis, Insights and Forecast - by BY Application
- 5.2.1. Residential
- 5.2.2. Commercial
- 5.2.3. Utility
- 5.3. Market Analysis, Insights and Forecast - by Region
- 5.3.1. North America
- 5.3.2. Europe
- 5.3.3. Asia Pacific
- 5.3.4. South America
- 5.3.5. Middle East and Africa
- 5.1. Market Analysis, Insights and Forecast - by BY Technology
- 6. Global Polycrystalline Silicon Solar Cells Market Analysis, Insights and Forecast, 2021-2033
- 6.1. Market Analysis, Insights and Forecast - by BY Technology
- 6.1.1. Crystalline Silicon Cells
- 6.1.2. Thin Film Cells
- 6.1.3. Ultra Thin Film Cells
- 6.2. Market Analysis, Insights and Forecast - by BY Application
- 6.2.1. Residential
- 6.2.2. Commercial
- 6.2.3. Utility
- 6.1. Market Analysis, Insights and Forecast - by BY Technology
- 7. North America Polycrystalline Silicon Solar Cells Market Analysis, Insights and Forecast, 2020-2032
- 7.1. Market Analysis, Insights and Forecast - by BY Technology
- 7.1.1. Crystalline Silicon Cells
- 7.1.2. Thin Film Cells
- 7.1.3. Ultra Thin Film Cells
- 7.2. Market Analysis, Insights and Forecast - by BY Application
- 7.2.1. Residential
- 7.2.2. Commercial
- 7.2.3. Utility
- 7.1. Market Analysis, Insights and Forecast - by BY Technology
- 8. Europe Polycrystalline Silicon Solar Cells Market Analysis, Insights and Forecast, 2020-2032
- 8.1. Market Analysis, Insights and Forecast - by BY Technology
- 8.1.1. Crystalline Silicon Cells
- 8.1.2. Thin Film Cells
- 8.1.3. Ultra Thin Film Cells
- 8.2. Market Analysis, Insights and Forecast - by BY Application
- 8.2.1. Residential
- 8.2.2. Commercial
- 8.2.3. Utility
- 8.1. Market Analysis, Insights and Forecast - by BY Technology
- 9. Asia Pacific Polycrystalline Silicon Solar Cells Market Analysis, Insights and Forecast, 2020-2032
- 9.1. Market Analysis, Insights and Forecast - by BY Technology
- 9.1.1. Crystalline Silicon Cells
- 9.1.2. Thin Film Cells
- 9.1.3. Ultra Thin Film Cells
- 9.2. Market Analysis, Insights and Forecast - by BY Application
- 9.2.1. Residential
- 9.2.2. Commercial
- 9.2.3. Utility
- 9.1. Market Analysis, Insights and Forecast - by BY Technology
- 10. South America Polycrystalline Silicon Solar Cells Market Analysis, Insights and Forecast, 2020-2032
- 10.1. Market Analysis, Insights and Forecast - by BY Technology
- 10.1.1. Crystalline Silicon Cells
- 10.1.2. Thin Film Cells
- 10.1.3. Ultra Thin Film Cells
- 10.2. Market Analysis, Insights and Forecast - by BY Application
- 10.2.1. Residential
- 10.2.2. Commercial
- 10.2.3. Utility
- 10.1. Market Analysis, Insights and Forecast - by BY Technology
- 11. Middle East and Africa Polycrystalline Silicon Solar Cells Market Analysis, Insights and Forecast, 2020-2032
- 11.1. Market Analysis, Insights and Forecast - by BY Technology
- 11.1.1. Crystalline Silicon Cells
- 11.1.2. Thin Film Cells
- 11.1.3. Ultra Thin Film Cells
- 11.2. Market Analysis, Insights and Forecast - by BY Application
- 11.2.1. Residential
- 11.2.2. Commercial
- 11.2.3. Utility
- 11.1. Market Analysis, Insights and Forecast - by BY Technology
- 12. Competitive Analysis
- 12.1. Company Profiles
- 12.1.1 JinkoSolar Holding Co Ltd
- 12.1.1.1. Company Overview
- 12.1.1.2. Products
- 12.1.1.3. Company Financials
- 12.1.1.4. SWOT Analysis
- 12.1.2 Targray Technology International Inc
- 12.1.2.1. Company Overview
- 12.1.2.2. Products
- 12.1.2.3. Company Financials
- 12.1.2.4. SWOT Analysis
- 12.1.3 Solaris Technology Industry
- 12.1.3.1. Company Overview
- 12.1.3.2. Products
- 12.1.3.3. Company Financials
- 12.1.3.4. SWOT Analysis
- 12.1.4 First Solar Inc
- 12.1.4.1. Company Overview
- 12.1.4.2. Products
- 12.1.4.3. Company Financials
- 12.1.4.4. SWOT Analysis
- 12.1.5 Trina Solar Co Ltd
- 12.1.5.1. Company Overview
- 12.1.5.2. Products
- 12.1.5.3. Company Financials
- 12.1.5.4. SWOT Analysis
- 12.1.6 Suniva Inc
- 12.1.6.1. Company Overview
- 12.1.6.2. Products
- 12.1.6.3. Company Financials
- 12.1.6.4. SWOT Analysis
- 12.1.7 Sunpower Corporation
- 12.1.7.1. Company Overview
- 12.1.7.2. Products
- 12.1.7.3. Company Financials
- 12.1.7.4. SWOT Analysis
- 12.1.8 Canadian Solar Inc
- 12.1.8.1. Company Overview
- 12.1.8.2. Products
- 12.1.8.3. Company Financials
- 12.1.8.4. SWOT Analysis
- 12.1.9 Tata Power Solar Systems Ltd
- 12.1.9.1. Company Overview
- 12.1.9.2. Products
- 12.1.9.3. Company Financials
- 12.1.9.4. SWOT Analysis
- 12.1.10 Sharp Corporation
- 12.1.10.1. Company Overview
- 12.1.10.2. Products
- 12.1.10.3. Company Financials
- 12.1.10.4. SWOT Analysis
- 12.1.1 JinkoSolar Holding Co Ltd
- 12.2. Market Entropy
- 12.2.1 Company's Key Areas Served
- 12.2.2 Recent Developments
- 12.3. Company Market Share Analysis 2025
- 12.3.1 Top 5 Companies Market Share Analysis
- 12.3.2 Top 3 Companies Market Share Analysis
- 12.4. List of Potential Customers
- 13. Research Methodology
List of Figures
- Figure 1: Global Polycrystalline Silicon Solar Cells Market Revenue Breakdown (billion, %) by Region 2025 & 2033
- Figure 2: Global Polycrystalline Silicon Solar Cells Market Volume Breakdown (K Units, %) by Region 2025 & 2033
- Figure 3: North America Polycrystalline Silicon Solar Cells Market Revenue (billion), by BY Technology 2025 & 2033
- Figure 4: North America Polycrystalline Silicon Solar Cells Market Volume (K Units), by BY Technology 2025 & 2033
- Figure 5: North America Polycrystalline Silicon Solar Cells Market Revenue Share (%), by BY Technology 2025 & 2033
- Figure 6: North America Polycrystalline Silicon Solar Cells Market Volume Share (%), by BY Technology 2025 & 2033
- Figure 7: North America Polycrystalline Silicon Solar Cells Market Revenue (billion), by BY Application 2025 & 2033
- Figure 8: North America Polycrystalline Silicon Solar Cells Market Volume (K Units), by BY Application 2025 & 2033
- Figure 9: North America Polycrystalline Silicon Solar Cells Market Revenue Share (%), by BY Application 2025 & 2033
- Figure 10: North America Polycrystalline Silicon Solar Cells Market Volume Share (%), by BY Application 2025 & 2033
- Figure 11: North America Polycrystalline Silicon Solar Cells Market Revenue (billion), by Country 2025 & 2033
- Figure 12: North America Polycrystalline Silicon Solar Cells Market Volume (K Units), by Country 2025 & 2033
- Figure 13: North America Polycrystalline Silicon Solar Cells Market Revenue Share (%), by Country 2025 & 2033
- Figure 14: North America Polycrystalline Silicon Solar Cells Market Volume Share (%), by Country 2025 & 2033
- Figure 15: Europe Polycrystalline Silicon Solar Cells Market Revenue (billion), by BY Technology 2025 & 2033
- Figure 16: Europe Polycrystalline Silicon Solar Cells Market Volume (K Units), by BY Technology 2025 & 2033
- Figure 17: Europe Polycrystalline Silicon Solar Cells Market Revenue Share (%), by BY Technology 2025 & 2033
- Figure 18: Europe Polycrystalline Silicon Solar Cells Market Volume Share (%), by BY Technology 2025 & 2033
- Figure 19: Europe Polycrystalline Silicon Solar Cells Market Revenue (billion), by BY Application 2025 & 2033
- Figure 20: Europe Polycrystalline Silicon Solar Cells Market Volume (K Units), by BY Application 2025 & 2033
- Figure 21: Europe Polycrystalline Silicon Solar Cells Market Revenue Share (%), by BY Application 2025 & 2033
- Figure 22: Europe Polycrystalline Silicon Solar Cells Market Volume Share (%), by BY Application 2025 & 2033
- Figure 23: Europe Polycrystalline Silicon Solar Cells Market Revenue (billion), by Country 2025 & 2033
- Figure 24: Europe Polycrystalline Silicon Solar Cells Market Volume (K Units), by Country 2025 & 2033
- Figure 25: Europe Polycrystalline Silicon Solar Cells Market Revenue Share (%), by Country 2025 & 2033
- Figure 26: Europe Polycrystalline Silicon Solar Cells Market Volume Share (%), by Country 2025 & 2033
- Figure 27: Asia Pacific Polycrystalline Silicon Solar Cells Market Revenue (billion), by BY Technology 2025 & 2033
- Figure 28: Asia Pacific Polycrystalline Silicon Solar Cells Market Volume (K Units), by BY Technology 2025 & 2033
- Figure 29: Asia Pacific Polycrystalline Silicon Solar Cells Market Revenue Share (%), by BY Technology 2025 & 2033
- Figure 30: Asia Pacific Polycrystalline Silicon Solar Cells Market Volume Share (%), by BY Technology 2025 & 2033
- Figure 31: Asia Pacific Polycrystalline Silicon Solar Cells Market Revenue (billion), by BY Application 2025 & 2033
- Figure 32: Asia Pacific Polycrystalline Silicon Solar Cells Market Volume (K Units), by BY Application 2025 & 2033
- Figure 33: Asia Pacific Polycrystalline Silicon Solar Cells Market Revenue Share (%), by BY Application 2025 & 2033
- Figure 34: Asia Pacific Polycrystalline Silicon Solar Cells Market Volume Share (%), by BY Application 2025 & 2033
- Figure 35: Asia Pacific Polycrystalline Silicon Solar Cells Market Revenue (billion), by Country 2025 & 2033
- Figure 36: Asia Pacific Polycrystalline Silicon Solar Cells Market Volume (K Units), by Country 2025 & 2033
- Figure 37: Asia Pacific Polycrystalline Silicon Solar Cells Market Revenue Share (%), by Country 2025 & 2033
- Figure 38: Asia Pacific Polycrystalline Silicon Solar Cells Market Volume Share (%), by Country 2025 & 2033
- Figure 39: South America Polycrystalline Silicon Solar Cells Market Revenue (billion), by BY Technology 2025 & 2033
- Figure 40: South America Polycrystalline Silicon Solar Cells Market Volume (K Units), by BY Technology 2025 & 2033
- Figure 41: South America Polycrystalline Silicon Solar Cells Market Revenue Share (%), by BY Technology 2025 & 2033
- Figure 42: South America Polycrystalline Silicon Solar Cells Market Volume Share (%), by BY Technology 2025 & 2033
- Figure 43: South America Polycrystalline Silicon Solar Cells Market Revenue (billion), by BY Application 2025 & 2033
- Figure 44: South America Polycrystalline Silicon Solar Cells Market Volume (K Units), by BY Application 2025 & 2033
- Figure 45: South America Polycrystalline Silicon Solar Cells Market Revenue Share (%), by BY Application 2025 & 2033
- Figure 46: South America Polycrystalline Silicon Solar Cells Market Volume Share (%), by BY Application 2025 & 2033
- Figure 47: South America Polycrystalline Silicon Solar Cells Market Revenue (billion), by Country 2025 & 2033
- Figure 48: South America Polycrystalline Silicon Solar Cells Market Volume (K Units), by Country 2025 & 2033
- Figure 49: South America Polycrystalline Silicon Solar Cells Market Revenue Share (%), by Country 2025 & 2033
- Figure 50: South America Polycrystalline Silicon Solar Cells Market Volume Share (%), by Country 2025 & 2033
- Figure 51: Middle East and Africa Polycrystalline Silicon Solar Cells Market Revenue (billion), by BY Technology 2025 & 2033
- Figure 52: Middle East and Africa Polycrystalline Silicon Solar Cells Market Volume (K Units), by BY Technology 2025 & 2033
- Figure 53: Middle East and Africa Polycrystalline Silicon Solar Cells Market Revenue Share (%), by BY Technology 2025 & 2033
- Figure 54: Middle East and Africa Polycrystalline Silicon Solar Cells Market Volume Share (%), by BY Technology 2025 & 2033
- Figure 55: Middle East and Africa Polycrystalline Silicon Solar Cells Market Revenue (billion), by BY Application 2025 & 2033
- Figure 56: Middle East and Africa Polycrystalline Silicon Solar Cells Market Volume (K Units), by BY Application 2025 & 2033
- Figure 57: Middle East and Africa Polycrystalline Silicon Solar Cells Market Revenue Share (%), by BY Application 2025 & 2033
- Figure 58: Middle East and Africa Polycrystalline Silicon Solar Cells Market Volume Share (%), by BY Application 2025 & 2033
- Figure 59: Middle East and Africa Polycrystalline Silicon Solar Cells Market Revenue (billion), by Country 2025 & 2033
- Figure 60: Middle East and Africa Polycrystalline Silicon Solar Cells Market Volume (K Units), by Country 2025 & 2033
- Figure 61: Middle East and Africa Polycrystalline Silicon Solar Cells Market Revenue Share (%), by Country 2025 & 2033
- Figure 62: Middle East and Africa Polycrystalline Silicon Solar Cells Market Volume Share (%), by Country 2025 & 2033
List of Tables
- Table 1: Global Polycrystalline Silicon Solar Cells Market Revenue billion Forecast, by BY Technology 2020 & 2033
- Table 2: Global Polycrystalline Silicon Solar Cells Market Volume K Units Forecast, by BY Technology 2020 & 2033
- Table 3: Global Polycrystalline Silicon Solar Cells Market Revenue billion Forecast, by BY Application 2020 & 2033
- Table 4: Global Polycrystalline Silicon Solar Cells Market Volume K Units Forecast, by BY Application 2020 & 2033
- Table 5: Global Polycrystalline Silicon Solar Cells Market Revenue billion Forecast, by Region 2020 & 2033
- Table 6: Global Polycrystalline Silicon Solar Cells Market Volume K Units Forecast, by Region 2020 & 2033
- Table 7: Global Polycrystalline Silicon Solar Cells Market Revenue billion Forecast, by BY Technology 2020 & 2033
- Table 8: Global Polycrystalline Silicon Solar Cells Market Volume K Units Forecast, by BY Technology 2020 & 2033
- Table 9: Global Polycrystalline Silicon Solar Cells Market Revenue billion Forecast, by BY Application 2020 & 2033
- Table 10: Global Polycrystalline Silicon Solar Cells Market Volume K Units Forecast, by BY Application 2020 & 2033
- Table 11: Global Polycrystalline Silicon Solar Cells Market Revenue billion Forecast, by Country 2020 & 2033
- Table 12: Global Polycrystalline Silicon Solar Cells Market Volume K Units Forecast, by Country 2020 & 2033
- Table 13: Global Polycrystalline Silicon Solar Cells Market Revenue billion Forecast, by BY Technology 2020 & 2033
- Table 14: Global Polycrystalline Silicon Solar Cells Market Volume K Units Forecast, by BY Technology 2020 & 2033
- Table 15: Global Polycrystalline Silicon Solar Cells Market Revenue billion Forecast, by BY Application 2020 & 2033
- Table 16: Global Polycrystalline Silicon Solar Cells Market Volume K Units Forecast, by BY Application 2020 & 2033
- Table 17: Global Polycrystalline Silicon Solar Cells Market Revenue billion Forecast, by Country 2020 & 2033
- Table 18: Global Polycrystalline Silicon Solar Cells Market Volume K Units Forecast, by Country 2020 & 2033
- Table 19: Global Polycrystalline Silicon Solar Cells Market Revenue billion Forecast, by BY Technology 2020 & 2033
- Table 20: Global Polycrystalline Silicon Solar Cells Market Volume K Units Forecast, by BY Technology 2020 & 2033
- Table 21: Global Polycrystalline Silicon Solar Cells Market Revenue billion Forecast, by BY Application 2020 & 2033
- Table 22: Global Polycrystalline Silicon Solar Cells Market Volume K Units Forecast, by BY Application 2020 & 2033
- Table 23: Global Polycrystalline Silicon Solar Cells Market Revenue billion Forecast, by Country 2020 & 2033
- Table 24: Global Polycrystalline Silicon Solar Cells Market Volume K Units Forecast, by Country 2020 & 2033
- Table 25: Global Polycrystalline Silicon Solar Cells Market Revenue billion Forecast, by BY Technology 2020 & 2033
- Table 26: Global Polycrystalline Silicon Solar Cells Market Volume K Units Forecast, by BY Technology 2020 & 2033
- Table 27: Global Polycrystalline Silicon Solar Cells Market Revenue billion Forecast, by BY Application 2020 & 2033
- Table 28: Global Polycrystalline Silicon Solar Cells Market Volume K Units Forecast, by BY Application 2020 & 2033
- Table 29: Global Polycrystalline Silicon Solar Cells Market Revenue billion Forecast, by Country 2020 & 2033
- Table 30: Global Polycrystalline Silicon Solar Cells Market Volume K Units Forecast, by Country 2020 & 2033
- Table 31: Global Polycrystalline Silicon Solar Cells Market Revenue billion Forecast, by BY Technology 2020 & 2033
- Table 32: Global Polycrystalline Silicon Solar Cells Market Volume K Units Forecast, by BY Technology 2020 & 2033
- Table 33: Global Polycrystalline Silicon Solar Cells Market Revenue billion Forecast, by BY Application 2020 & 2033
- Table 34: Global Polycrystalline Silicon Solar Cells Market Volume K Units Forecast, by BY Application 2020 & 2033
- Table 35: Global Polycrystalline Silicon Solar Cells Market Revenue billion Forecast, by Country 2020 & 2033
- Table 36: Global Polycrystalline Silicon Solar Cells Market Volume K Units Forecast, by Country 2020 & 2033
Frequently Asked Questions
1. What is the projected Compound Annual Growth Rate (CAGR) of the Polycrystalline Silicon Solar Cells Market?
The projected CAGR is approximately 11.6%.
2. Which companies are prominent players in the Polycrystalline Silicon Solar Cells Market?
Key companies in the market include JinkoSolar Holding Co Ltd, Targray Technology International Inc, Solaris Technology Industry, First Solar Inc, Trina Solar Co Ltd, Suniva Inc, Sunpower Corporation, Canadian Solar Inc, Tata Power Solar Systems Ltd, Sharp Corporation.
3. What are the main segments of the Polycrystalline Silicon Solar Cells Market?
The market segments include BY Technology, BY Application.
4. Can you provide details about the market size?
The market size is estimated to be USD 49.44 billion as of 2022.
5. What are some drivers contributing to market growth?
4.; The High Amount of Waste Generation in the Country4.; The growing Focus on Non-Fossil Fuel Sources.
6. What are the notable trends driving market growth?
Residential Segment to Witness Significant Growth.
7. Are there any restraints impacting market growth?
4.; The Recycling Rate of Waste in Germany.
8. Can you provide examples of recent developments in the market?
In April 2022, Tongwei, solar polysilicon and cell manufacturer stated plans to significantly increase its manufacturing capacity over the next four years after confirming a six fold increase in net profit in Q1 2022. The company expects to finish 2023 witt 350,000 MT of polysilicon capacity.
9. What pricing options are available for accessing the report?
Pricing options include single-user, multi-user, and enterprise licenses priced at USD 4750, USD 5250, and USD 8750 respectively.
10. Is the market size provided in terms of value or volume?
The market size is provided in terms of value, measured in billion and volume, measured in K Units.
11. Are there any specific market keywords associated with the report?
Yes, the market keyword associated with the report is "Polycrystalline Silicon Solar Cells Market," which aids in identifying and referencing the specific market segment covered.
12. How do I determine which pricing option suits my needs best?
The pricing options vary based on user requirements and access needs. Individual users may opt for single-user licenses, while businesses requiring broader access may choose multi-user or enterprise licenses for cost-effective access to the report.
13. Are there any additional resources or data provided in the Polycrystalline Silicon Solar Cells Market report?
While the report offers comprehensive insights, it's advisable to review the specific contents or supplementary materials provided to ascertain if additional resources or data are available.
14. How can I stay updated on further developments or reports in the Polycrystalline Silicon Solar Cells Market?
To stay informed about further developments, trends, and reports in the Polycrystalline Silicon Solar Cells Market, consider subscribing to industry newsletters, following relevant companies and organizations, or regularly checking reputable industry news sources and publications.
Methodology
Step 1 - Identification of Relevant Samples Size from Population Database


Step 2 - Approaches for Defining Global Market Size (Value, Volume* & Price*)

Note*: In applicable scenarios
Step 3 - Data Sources
Primary Research
- Web Analytics
- Survey Reports
- Research Institute
- Latest Research Reports
- Opinion Leaders
Secondary Research
- Annual Reports
- White Paper
- Latest Press Release
- Industry Association
- Paid Database
- Investor Presentations

Step 4 - Data Triangulation
Involves using different sources of information in order to increase the validity of a study
These sources are likely to be stakeholders in a program - participants, other researchers, program staff, other community members, and so on.
Then we put all data in single framework & apply various statistical tools to find out the dynamic on the market.
During the analysis stage, feedback from the stakeholder groups would be compared to determine areas of agreement as well as areas of divergence