

Key Insights
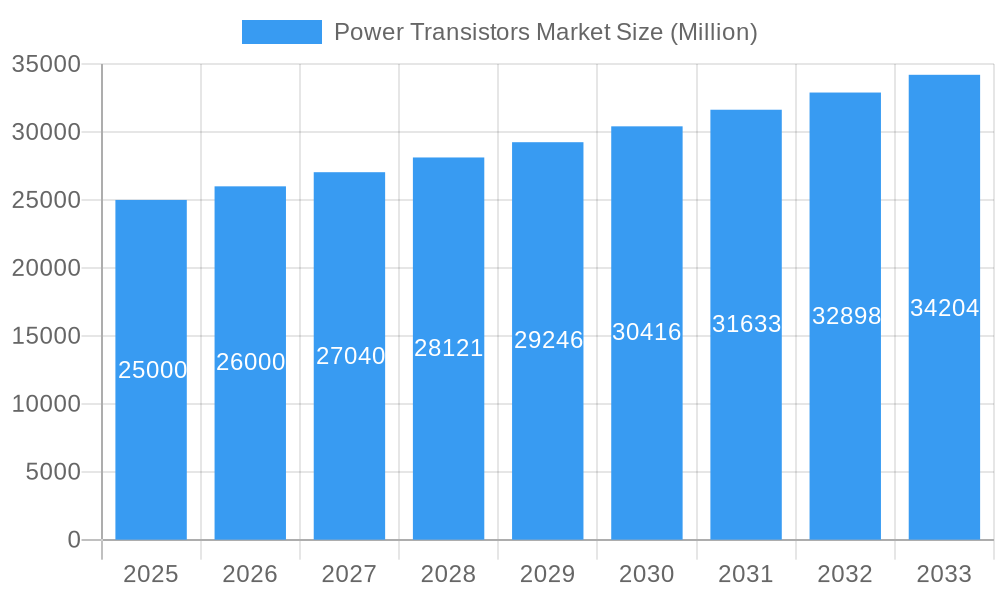
The global Power Transistors Market is projected for significant expansion, fueled by the increasing demand for efficient power management across diverse industries. Valued at an estimated $15.82 billion in the base year of 2024, the market is expected to grow at a Compound Annual Growth Rate (CAGR) of 8.15% during the forecast period of 2024-2033. This growth is driven by the adoption of advanced technologies such as electric vehicles, renewable energy systems, and sophisticated consumer electronics. The expanding telecommunications sector, particularly 5G infrastructure development, and the aerospace and defense industries also contribute significantly to market growth.
Power Transistors Market Market Size (In Billion)
The market features a variety of transistor types, with High Electron Mobility Transistors (HEMTs) and Field-Effect Transistors (FETs) anticipated to see substantial adoption due to their superior performance in high-frequency and high-power applications. The industrial sector remains a key end-user, while consumer electronics and electric mobility present considerable growth opportunities. Geographically, the Asia Pacific region is expected to lead market expansion, supported by its robust manufacturing capabilities and innovation investments. North America and Europe are also key markets, driven by stringent energy efficiency regulations and a focus on industrial automation. Major players such as Infineon Technologies AG, NXP Semiconductors N.V., and Taiwan Semiconductor Manufacturing Company are actively engaged in R&D for more efficient and cost-effective power transistor solutions.
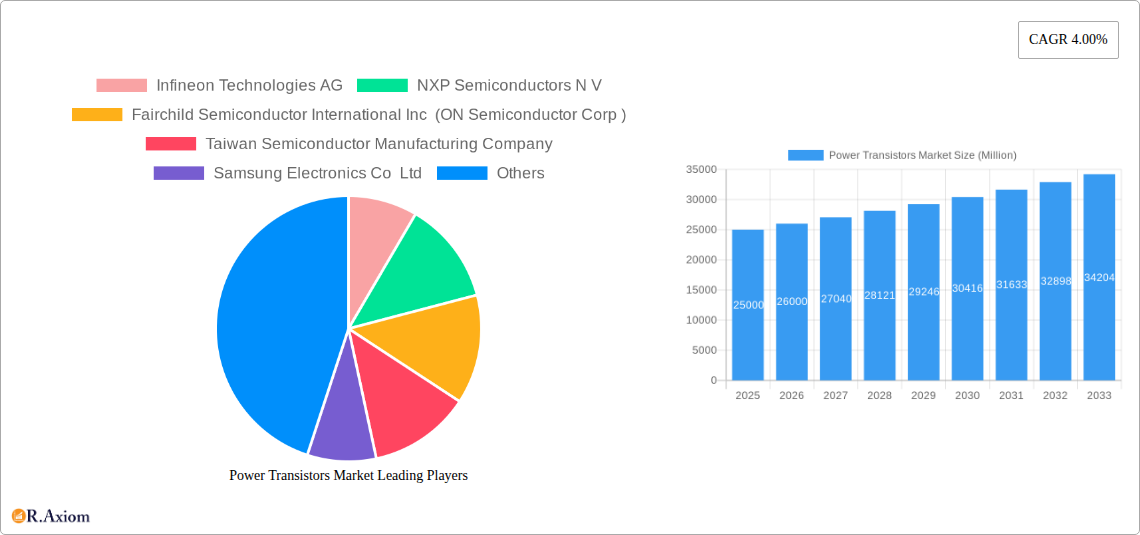
Power Transistors Market Company Market Share
This comprehensive report offers detailed analysis of the global Power Transistors Market, including market size, growth drivers, trends, competitive landscape, and future outlook for the period 2019-2033, with 2024 as the base year. It provides actionable insights into critical segments, emerging technologies like Gallium Nitride (GaN) and Silicon Carbide (SiC) transistors, and their impact on various end-user industries, essential for understanding the trajectory of power transistor innovation and its role in shaping the future of electronics.
Power Transistors Market Market Concentration & Innovation
The Power Transistors Market exhibits a moderate to high level of concentration, with key players like Infineon Technologies AG, NXP Semiconductors N.V., and Taiwan Semiconductor Manufacturing Company dominating significant market share. Innovation in this sector is primarily driven by the relentless pursuit of higher efficiency, reduced energy loss, and miniaturization in power management solutions. The advent of Wide Bandgap (WBG) semiconductors, particularly Gallium Nitride (GaN) and Silicon Carbide (SiC) transistors, is a major innovation catalyst, enabling higher operating temperatures, faster switching speeds, and smaller form factors compared to traditional silicon-based transistors. Regulatory frameworks, such as those mandating energy efficiency standards for electronic devices and renewable energy systems, also play a crucial role in steering innovation towards more advanced power transistor technologies. Product substitutes primarily include advancements within silicon technology itself, offering incremental improvements, but WBG materials represent a more disruptive substitute. End-user trends are increasingly favoring compact, high-performance, and energy-efficient power solutions, pushing manufacturers to invest heavily in R&D. Mergers and acquisition (M&A) activities, though not extensively detailed in public domain for all players, are strategic moves to acquire specialized technologies, expand product portfolios, and strengthen market presence. For instance, the acquisition of Fairchild Semiconductor by ON Semiconductor signifies a consolidation aimed at enhancing capabilities in power management solutions. Anticipated M&A deal values are expected to rise as companies seek to secure their position in the high-growth WBG transistor market.
Power Transistors Market Industry Trends & Insights
The global Power Transistors Market is on a robust growth trajectory, fueled by an escalating demand for energy-efficient solutions across a multitude of industries. The Compound Annual Growth Rate (CAGR) for the forecast period of 2025–2033 is projected to be significant, driven by megatrends such as electrification of transportation, expansion of 5G infrastructure, and the growing adoption of renewable energy sources. Technological disruptions, particularly the maturation and wider adoption of GaN and SiC power transistors, are reshaping the competitive landscape. These advanced materials offer superior performance characteristics, including higher breakdown voltage, lower on-resistance, and faster switching speeds, leading to substantial improvements in power conversion efficiency and thermal management. This translates into smaller, lighter, and more sustainable electronic systems. Consumer preferences are increasingly aligned with these technological advancements, with a demand for longer battery life in portable devices, faster charging capabilities, and more energy-conscious appliances. The competitive dynamics are intensifying, with established silicon power transistor manufacturers investing in WBG technologies to remain competitive, while pure-play WBG manufacturers are rapidly expanding their product offerings and market reach. Market penetration of WBG transistors, while still nascent compared to silicon, is experiencing exponential growth, particularly in high-performance applications like electric vehicles (EVs), data centers, and industrial power supplies. The overall market is characterized by a strong push towards higher voltage and current handling capabilities, alongside a continuous drive for reduced parasitic inductance and capacitance, further enhancing switching performance. The ability of power transistors to efficiently manage and convert electrical energy is paramount in meeting global energy conservation goals.
Dominant Markets & Segments in Power Transistors Market
The Power Transistors Market is characterized by a dynamic interplay of regional dominance and segment-specific growth. Geographically, Asia Pacific is emerging as the leading region, driven by its strong manufacturing base in consumer electronics and the rapid expansion of telecommunications and industrial sectors. Countries like China, South Korea, and Taiwan are key contributors to this dominance, owing to substantial investments in semiconductor manufacturing and a burgeoning demand for advanced electronic components. The United States and Europe also represent significant markets, particularly in the aerospace & defense and industrial automation segments, where stringent performance and reliability requirements drive the adoption of high-end power transistors.
Within the Type segmentation, Field Effect Transistors (FETs), including MOSFETs (Metal-Oxide-Semiconductor Field-Effect Transistors) and their advanced counterparts like High Electron Mobility Transistors (HEMTs), are currently the dominant segment. This dominance is attributed to their superior switching characteristics, lower gate drive power, and widespread application in diverse power management circuits.
- Field Effect Transistors (FETs): Their versatility and efficiency make them indispensable across numerous applications, from consumer electronics to high-power industrial systems. The ongoing advancements in GaN and SiC FETs are further solidifying their market leadership.
- High Electron Mobility Transistor (HEMT): HEMTs are particularly crucial in high-frequency applications like telecommunications base stations and radar systems due to their exceptional speed and low noise characteristics.
- Bipolar Junction Transistor (BJT): While BJTs are still relevant in certain power applications, their market share is gradually being eroded by the superior performance of FETs in high-speed switching scenarios.
- Multiple Emitter Transistor (MET) and Dual Gate: These specialized types cater to niche applications and contribute to the overall diversity of the market, though their overall market share is considerably smaller than mainstream FETs.
In terms of End User Industry, the Industrial sector currently holds the largest market share. This dominance stems from the extensive use of power transistors in industrial automation, motor drives, power supplies for machinery, renewable energy inverters, and electric vehicle charging infrastructure.
- Industrial: This segment's demand is driven by the need for robust, efficient, and reliable power solutions to support increasingly sophisticated manufacturing processes and the transition to smart factories.
- Consumer Electronics: This segment is a significant growth driver, with power transistors essential for power management in smartphones, laptops, home appliances, and wearable devices. The miniaturization and energy efficiency demands here are particularly high.
- Telecommunications: The rollout of 5G networks and the expansion of data centers are creating substantial demand for high-frequency and high-power transistors for base stations, servers, and network infrastructure.
- Aerospace & Defense: This sector demands extremely reliable and high-performance power transistors for critical applications such as radar systems, avionics, and satellite communication, often requiring specialized ruggedized components.
Economic policies that incentivize industrial modernization and renewable energy adoption, coupled with infrastructure development for 5G and EVs, are key drivers of dominance in these respective segments and regions.
Power Transistors Market Product Developments
Product innovation in the Power Transistors Market is rapidly accelerating, driven by advancements in materials science and device design. The introduction of ultra-compact GaN transistors, such as the EPC2050 announced in September 2022 by EPC Power Conversion Corporation, signifies a paradigm shift in miniaturization, offering solutions ten times smaller than equivalent silicon devices. Similarly, Magnachip Semiconductor Corporation's July 2022 unveiling of a new 24V MOSFET for wireless earphone batteries highlights improvements in core cell density and reduced RDS(on) for extended battery life. NXP Semiconductors' March 2022 announcement of new RF GaN power transistors for active antenna systems showcases the growing application of GaN technology in advanced telecommunications, protecting all cellular frequency bands. These developments underscore a clear market trend towards higher efficiency, smaller footprints, and enhanced performance across various applications, from consumer gadgets to critical communication infrastructure.
Report Scope & Segmentation Analysis
This report meticulously analyzes the Power Transistors Market across its diverse segmentations. The study encompasses various transistor Types, including High Electron Mobility Transistors (HEMT), Bipolar Junction Transistors (BJT), Field Effect Transistors (FET), Multiple Emitter Transistors (MET), and Dual Gate transistors. Each type is assessed for its market size, growth projections, and competitive dynamics, with FETs currently leading due to their versatility and the rapid advancements in GaN and SiC technologies. The End User Industry segmentation includes Aerospace & Defense, Industrial, Telecommunications, and Consumer Electronics. The Industrial sector is the largest, driven by automation and renewable energy, while Telecommunications is experiencing rapid growth due to 5G deployment. Consumer Electronics remains a consistent driver of volume demand, and Aerospace & Defense requires specialized, high-reliability components.
Key Drivers of Power Transistors Market Growth
The Power Transistors Market is propelled by several interconnected growth drivers. A primary catalyst is the global push for energy efficiency across all sectors, driven by environmental concerns and rising energy costs. This mandates the use of more efficient power conversion components, favoring advanced transistor technologies like GaN and SiC. The electrification of transportation, particularly the booming electric vehicle (EV) market, creates immense demand for power transistors in powertrains, charging systems, and battery management. Furthermore, the rapid deployment of 5G telecommunications infrastructure requires high-frequency, high-power transistors for base stations and network equipment. The ongoing digitalization and automation of industries, leading to smart factories and increased use of industrial robots and power systems, also significantly contributes to market growth. Finally, the continued expansion of the consumer electronics sector, with its insatiable demand for portable devices, smart home appliances, and advanced computing, ensures a steady baseline of demand.
Challenges in the Power Transistors Market Sector
Despite robust growth prospects, the Power Transistors Market faces several challenges. The high cost of manufacturing for Wide Bandgap (WBG) materials like GaN and SiC remains a significant barrier to widespread adoption, especially in cost-sensitive applications. Supply chain disruptions, exacerbated by geopolitical tensions and component shortages, can impact production volumes and lead times. Technical challenges in packaging and thermal management for high-power density WBG devices require specialized expertise and infrastructure. Furthermore, the established dominance of silicon-based transistors, with their mature manufacturing processes and lower cost points, presents a competitive hurdle, particularly for incremental performance improvements. The need for skilled labor to design, manufacture, and implement advanced power electronics solutions also poses a challenge for market expansion.
Emerging Opportunities in Power Transistors Market
The Power Transistors Market is rife with emerging opportunities, driven by technological innovation and evolving industry demands. The continuous advancement and cost reduction of Gallium Nitride (GaN) and Silicon Carbide (SiC) technologies present a substantial opportunity, opening up new application areas and increasing market penetration. The burgeoning market for renewable energy systems, including solar inverters, wind turbines, and energy storage solutions, requires high-efficiency power transistors. The expansion of electric vehicle (EV) charging infrastructure and the need for faster, more efficient charging solutions also represent a significant growth avenue. Data center power efficiency initiatives, aimed at reducing operational costs and environmental impact, are driving demand for advanced power conversion. Emerging opportunities also lie in the development of next-generation power electronics for smart grids, industrial IoT devices, and advanced aerospace applications, where high performance and reliability are paramount.
Leading Players in the Power Transistors Market Market
- Infineon Technologies AG
- NXP Semiconductors N V
- Fairchild Semiconductor International Inc (ON Semiconductor Corp )
- Taiwan Semiconductor Manufacturing Company
- Samsung Electronics Co Ltd
- Microchip Technology Inc
- STMicroelectronics N V
- GLOBALFOUNDRIES Inc
- Texas Instruments Incorporated
- Intel Corporation
Key Developments in Power Transistors Market Industry
- September 2022 - EPC Power Conversion Corporation announced the EPC2050, a 350 V GaN transistor with a maximum RDS(on) of 80 mΩ and a pulsed output current of 26 A. The EPC2050 measures only 1.95 mm x 1.95 mm, making EPC2050-based solutions ten times smaller than solutions using equivalent silicon devices.
- July 2022 - Magnachip Semiconductor Corporation announced that the company unveiled a new 24V Metal-Oxide-Semiconductor Field-Effect Transistor (MOSFET) for wireless earphone batteries. The new 24V MOSFET addresses the goal of battery designers for extended battery life after a quick charge by reducing conduction loss. The core cell density of this new product has been increased by 30% compared to the previous version, while the design of the core cell, termination, and source pads has been enhanced to reduce the RDS(on) by 24%.
- March 2022 - NXP Semiconductors announced new RF GaN power transistors for 32T32R active antenna systems using its most delinquent proprietary gallium nitride (GaN) technology. The unique series complements NXP's existing portfolio of discrete GaN power amplifier solutions for 64T64R radios, protecting all cellular frequency bands from 2.3GHz to 4.0GHz.
Strategic Outlook for Power Transistors Market Market
The strategic outlook for the Power Transistors Market is overwhelmingly positive, driven by a confluence of technological advancements and escalating global demand for efficient power management. The continued maturation and cost reduction of Wide Bandgap (WBG) technologies, particularly GaN and SiC, will unlock new markets and deepen penetration in existing ones, such as electric vehicles, renewable energy, and advanced computing. Strategic investments in R&D for higher voltage, higher current, and more compact transistor solutions will be crucial for market leaders. Partnerships and collaborations aimed at developing integrated power modules and system-level solutions will also gain prominence. The increasing focus on sustainability and energy conservation by governments and industries worldwide will further solidify the demand for high-performance power transistors, positioning this market as a critical enabler of future technological innovation and a key contributor to a more energy-efficient world.
Power Transistors Market Segmentation
-
1. Type
- 1.1. High Electron Mobility Transistor (HEMT)
- 1.2. Bipolar Junction Transistor (BJT)
- 1.3. Field Effect Transistors (FET)
- 1.4. Multiple Emitter Transistor (MET)
- 1.5. Dual Gat
-
2. End User Industry
- 2.1. Aerospace & Defense
- 2.2. Industrial
- 2.3. Telecommunications
- 2.4. Consumer Electronics
Power Transistors Market Segmentation By Geography
- 1. North America
- 2. Europe
- 3. Asia Pacific
- 4. Latin America
- 5. Middle East
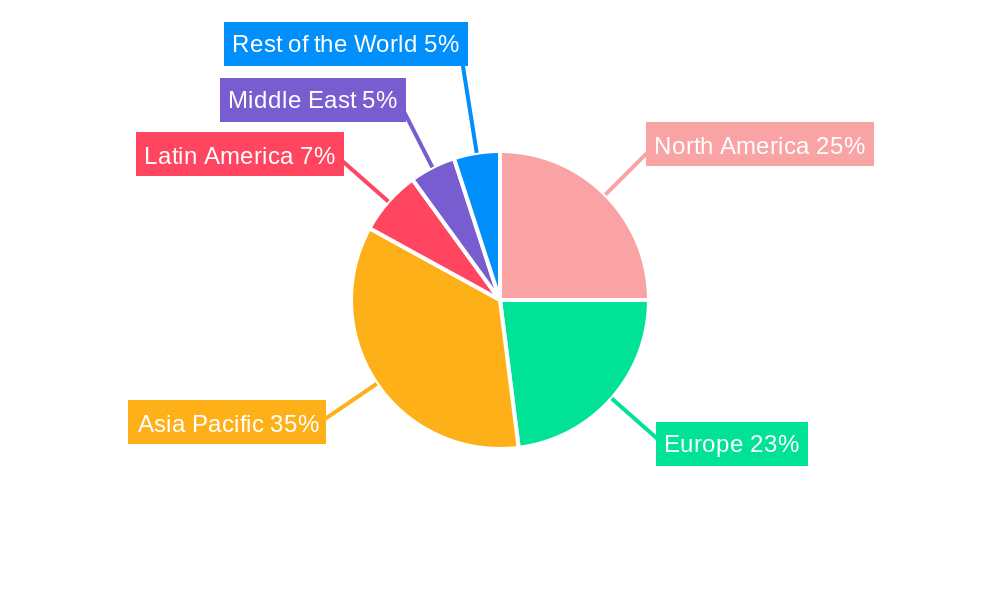
Power Transistors Market Regional Market Share
Geographic Coverage of Power Transistors Market
Power Transistors Market REPORT HIGHLIGHTS
| Aspects | Details |
|---|---|
| Study Period | 2020-2034 |
| Base Year | 2025 |
| Estimated Year | 2026 |
| Forecast Period | 2026-2034 |
| Historical Period | 2020-2025 |
| Growth Rate | CAGR of 8.15% from 2020-2034 |
| Segmentation |
|
Table of Contents
- 1. Introduction
- 1.1. Research Scope
- 1.2. Market Segmentation
- 1.3. Research Objective
- 1.4. Definitions and Assumptions
- 2. Executive Summary
- 2.1. Market Snapshot
- 3. Market Dynamics
- 3.1. Market Drivers
- 3.2. Market Restrains
- 3.3. Market Trends
- 3.4. Market Opportunities
- 4. Market Factor Analysis
- 4.1. Porters Five Forces
- 4.1.1. Bargaining Power of Suppliers
- 4.1.2. Bargaining Power of Buyers
- 4.1.3. Threat of New Entrants
- 4.1.4. Threat of Substitutes
- 4.1.5. Competitive Rivalry
- 4.2. PESTEL analysis
- 4.3. BCG Analysis
- 4.3.1. Stars (High Growth, High Market Share)
- 4.3.2. Cash Cows (Low Growth, High Market Share)
- 4.3.3. Question Mark (High Growth, Low Market Share)
- 4.3.4. Dogs (Low Growth, Low Market Share)
- 4.4. Ansoff Matrix Analysis
- 4.5. Supply Chain Analysis
- 4.6. Regulatory Landscape
- 4.7. Current Market Potential and Opportunity Assessment (TAM–SAM–SOM Framework)
- 4.8. RAX Analyst Note
- 4.1. Porters Five Forces
- 5. Market Analysis, Insights and Forecast 2021-2033
- 5.1. Market Analysis, Insights and Forecast - by Type
- 5.1.1. High Electron Mobility Transistor (HEMT)
- 5.1.2. Bipolar Junction Transistor (BJT)
- 5.1.3. Field Effect Transistors (FET)
- 5.1.4. Multiple Emitter Transistor (MET)
- 5.1.5. Dual Gat
- 5.2. Market Analysis, Insights and Forecast - by End User Industry
- 5.2.1. Aerospace & Defense
- 5.2.2. Industrial
- 5.2.3. Telecommunications
- 5.2.4. Consumer Electronics
- 5.3. Market Analysis, Insights and Forecast - by Region
- 5.3.1. North America
- 5.3.2. Europe
- 5.3.3. Asia Pacific
- 5.3.4. Latin America
- 5.3.5. Middle East
- 5.1. Market Analysis, Insights and Forecast - by Type
- 6. Global Power Transistors Market Analysis, Insights and Forecast, 2021-2033
- 6.1. Market Analysis, Insights and Forecast - by Type
- 6.1.1. High Electron Mobility Transistor (HEMT)
- 6.1.2. Bipolar Junction Transistor (BJT)
- 6.1.3. Field Effect Transistors (FET)
- 6.1.4. Multiple Emitter Transistor (MET)
- 6.1.5. Dual Gat
- 6.2. Market Analysis, Insights and Forecast - by End User Industry
- 6.2.1. Aerospace & Defense
- 6.2.2. Industrial
- 6.2.3. Telecommunications
- 6.2.4. Consumer Electronics
- 6.1. Market Analysis, Insights and Forecast - by Type
- 7. North America Power Transistors Market Analysis, Insights and Forecast, 2020-2032
- 7.1. Market Analysis, Insights and Forecast - by Type
- 7.1.1. High Electron Mobility Transistor (HEMT)
- 7.1.2. Bipolar Junction Transistor (BJT)
- 7.1.3. Field Effect Transistors (FET)
- 7.1.4. Multiple Emitter Transistor (MET)
- 7.1.5. Dual Gat
- 7.2. Market Analysis, Insights and Forecast - by End User Industry
- 7.2.1. Aerospace & Defense
- 7.2.2. Industrial
- 7.2.3. Telecommunications
- 7.2.4. Consumer Electronics
- 7.1. Market Analysis, Insights and Forecast - by Type
- 8. Europe Power Transistors Market Analysis, Insights and Forecast, 2020-2032
- 8.1. Market Analysis, Insights and Forecast - by Type
- 8.1.1. High Electron Mobility Transistor (HEMT)
- 8.1.2. Bipolar Junction Transistor (BJT)
- 8.1.3. Field Effect Transistors (FET)
- 8.1.4. Multiple Emitter Transistor (MET)
- 8.1.5. Dual Gat
- 8.2. Market Analysis, Insights and Forecast - by End User Industry
- 8.2.1. Aerospace & Defense
- 8.2.2. Industrial
- 8.2.3. Telecommunications
- 8.2.4. Consumer Electronics
- 8.1. Market Analysis, Insights and Forecast - by Type
- 9. Asia Pacific Power Transistors Market Analysis, Insights and Forecast, 2020-2032
- 9.1. Market Analysis, Insights and Forecast - by Type
- 9.1.1. High Electron Mobility Transistor (HEMT)
- 9.1.2. Bipolar Junction Transistor (BJT)
- 9.1.3. Field Effect Transistors (FET)
- 9.1.4. Multiple Emitter Transistor (MET)
- 9.1.5. Dual Gat
- 9.2. Market Analysis, Insights and Forecast - by End User Industry
- 9.2.1. Aerospace & Defense
- 9.2.2. Industrial
- 9.2.3. Telecommunications
- 9.2.4. Consumer Electronics
- 9.1. Market Analysis, Insights and Forecast - by Type
- 10. Latin America Power Transistors Market Analysis, Insights and Forecast, 2020-2032
- 10.1. Market Analysis, Insights and Forecast - by Type
- 10.1.1. High Electron Mobility Transistor (HEMT)
- 10.1.2. Bipolar Junction Transistor (BJT)
- 10.1.3. Field Effect Transistors (FET)
- 10.1.4. Multiple Emitter Transistor (MET)
- 10.1.5. Dual Gat
- 10.2. Market Analysis, Insights and Forecast - by End User Industry
- 10.2.1. Aerospace & Defense
- 10.2.2. Industrial
- 10.2.3. Telecommunications
- 10.2.4. Consumer Electronics
- 10.1. Market Analysis, Insights and Forecast - by Type
- 11. Middle East Power Transistors Market Analysis, Insights and Forecast, 2020-2032
- 11.1. Market Analysis, Insights and Forecast - by Type
- 11.1.1. High Electron Mobility Transistor (HEMT)
- 11.1.2. Bipolar Junction Transistor (BJT)
- 11.1.3. Field Effect Transistors (FET)
- 11.1.4. Multiple Emitter Transistor (MET)
- 11.1.5. Dual Gat
- 11.2. Market Analysis, Insights and Forecast - by End User Industry
- 11.2.1. Aerospace & Defense
- 11.2.2. Industrial
- 11.2.3. Telecommunications
- 11.2.4. Consumer Electronics
- 11.1. Market Analysis, Insights and Forecast - by Type
- 12. Competitive Analysis
- 12.1. Company Profiles
- 12.1.1 Infineon Technologies AG
- 12.1.1.1. Company Overview
- 12.1.1.2. Products
- 12.1.1.3. Company Financials
- 12.1.1.4. SWOT Analysis
- 12.1.2 NXP Semiconductors N V
- 12.1.2.1. Company Overview
- 12.1.2.2. Products
- 12.1.2.3. Company Financials
- 12.1.2.4. SWOT Analysis
- 12.1.3 Fairchild Semiconductor International Inc (ON Semiconductor Corp )
- 12.1.3.1. Company Overview
- 12.1.3.2. Products
- 12.1.3.3. Company Financials
- 12.1.3.4. SWOT Analysis
- 12.1.4 Taiwan Semiconductor Manufacturing Company
- 12.1.4.1. Company Overview
- 12.1.4.2. Products
- 12.1.4.3. Company Financials
- 12.1.4.4. SWOT Analysis
- 12.1.5 Samsung Electronics Co Ltd
- 12.1.5.1. Company Overview
- 12.1.5.2. Products
- 12.1.5.3. Company Financials
- 12.1.5.4. SWOT Analysis
- 12.1.6 Microchip Technology Inc *List Not Exhaustive
- 12.1.6.1. Company Overview
- 12.1.6.2. Products
- 12.1.6.3. Company Financials
- 12.1.6.4. SWOT Analysis
- 12.1.7 STMicroelectronics N V
- 12.1.7.1. Company Overview
- 12.1.7.2. Products
- 12.1.7.3. Company Financials
- 12.1.7.4. SWOT Analysis
- 12.1.8 GLOBALFOUNDRIES Inc
- 12.1.8.1. Company Overview
- 12.1.8.2. Products
- 12.1.8.3. Company Financials
- 12.1.8.4. SWOT Analysis
- 12.1.9 Texas Instruments Incorporated
- 12.1.9.1. Company Overview
- 12.1.9.2. Products
- 12.1.9.3. Company Financials
- 12.1.9.4. SWOT Analysis
- 12.1.10 Intel Corporation
- 12.1.10.1. Company Overview
- 12.1.10.2. Products
- 12.1.10.3. Company Financials
- 12.1.10.4. SWOT Analysis
- 12.1.1 Infineon Technologies AG
- 12.2. Market Entropy
- 12.2.1 Company's Key Areas Served
- 12.2.2 Recent Developments
- 12.3. Company Market Share Analysis 2025
- 12.3.1 Top 5 Companies Market Share Analysis
- 12.3.2 Top 3 Companies Market Share Analysis
- 12.4. List of Potential Customers
- 13. Research Methodology
List of Figures
- Figure 1: Global Power Transistors Market Revenue Breakdown (billion, %) by Region 2025 & 2033
- Figure 2: North America Power Transistors Market Revenue (billion), by Type 2025 & 2033
- Figure 3: North America Power Transistors Market Revenue Share (%), by Type 2025 & 2033
- Figure 4: North America Power Transistors Market Revenue (billion), by End User Industry 2025 & 2033
- Figure 5: North America Power Transistors Market Revenue Share (%), by End User Industry 2025 & 2033
- Figure 6: North America Power Transistors Market Revenue (billion), by Country 2025 & 2033
- Figure 7: North America Power Transistors Market Revenue Share (%), by Country 2025 & 2033
- Figure 8: Europe Power Transistors Market Revenue (billion), by Type 2025 & 2033
- Figure 9: Europe Power Transistors Market Revenue Share (%), by Type 2025 & 2033
- Figure 10: Europe Power Transistors Market Revenue (billion), by End User Industry 2025 & 2033
- Figure 11: Europe Power Transistors Market Revenue Share (%), by End User Industry 2025 & 2033
- Figure 12: Europe Power Transistors Market Revenue (billion), by Country 2025 & 2033
- Figure 13: Europe Power Transistors Market Revenue Share (%), by Country 2025 & 2033
- Figure 14: Asia Pacific Power Transistors Market Revenue (billion), by Type 2025 & 2033
- Figure 15: Asia Pacific Power Transistors Market Revenue Share (%), by Type 2025 & 2033
- Figure 16: Asia Pacific Power Transistors Market Revenue (billion), by End User Industry 2025 & 2033
- Figure 17: Asia Pacific Power Transistors Market Revenue Share (%), by End User Industry 2025 & 2033
- Figure 18: Asia Pacific Power Transistors Market Revenue (billion), by Country 2025 & 2033
- Figure 19: Asia Pacific Power Transistors Market Revenue Share (%), by Country 2025 & 2033
- Figure 20: Latin America Power Transistors Market Revenue (billion), by Type 2025 & 2033
- Figure 21: Latin America Power Transistors Market Revenue Share (%), by Type 2025 & 2033
- Figure 22: Latin America Power Transistors Market Revenue (billion), by End User Industry 2025 & 2033
- Figure 23: Latin America Power Transistors Market Revenue Share (%), by End User Industry 2025 & 2033
- Figure 24: Latin America Power Transistors Market Revenue (billion), by Country 2025 & 2033
- Figure 25: Latin America Power Transistors Market Revenue Share (%), by Country 2025 & 2033
- Figure 26: Middle East Power Transistors Market Revenue (billion), by Type 2025 & 2033
- Figure 27: Middle East Power Transistors Market Revenue Share (%), by Type 2025 & 2033
- Figure 28: Middle East Power Transistors Market Revenue (billion), by End User Industry 2025 & 2033
- Figure 29: Middle East Power Transistors Market Revenue Share (%), by End User Industry 2025 & 2033
- Figure 30: Middle East Power Transistors Market Revenue (billion), by Country 2025 & 2033
- Figure 31: Middle East Power Transistors Market Revenue Share (%), by Country 2025 & 2033
List of Tables
- Table 1: Global Power Transistors Market Revenue billion Forecast, by Type 2020 & 2033
- Table 2: Global Power Transistors Market Revenue billion Forecast, by End User Industry 2020 & 2033
- Table 3: Global Power Transistors Market Revenue billion Forecast, by Region 2020 & 2033
- Table 4: Global Power Transistors Market Revenue billion Forecast, by Type 2020 & 2033
- Table 5: Global Power Transistors Market Revenue billion Forecast, by End User Industry 2020 & 2033
- Table 6: Global Power Transistors Market Revenue billion Forecast, by Country 2020 & 2033
- Table 7: Global Power Transistors Market Revenue billion Forecast, by Type 2020 & 2033
- Table 8: Global Power Transistors Market Revenue billion Forecast, by End User Industry 2020 & 2033
- Table 9: Global Power Transistors Market Revenue billion Forecast, by Country 2020 & 2033
- Table 10: Global Power Transistors Market Revenue billion Forecast, by Type 2020 & 2033
- Table 11: Global Power Transistors Market Revenue billion Forecast, by End User Industry 2020 & 2033
- Table 12: Global Power Transistors Market Revenue billion Forecast, by Country 2020 & 2033
- Table 13: Global Power Transistors Market Revenue billion Forecast, by Type 2020 & 2033
- Table 14: Global Power Transistors Market Revenue billion Forecast, by End User Industry 2020 & 2033
- Table 15: Global Power Transistors Market Revenue billion Forecast, by Country 2020 & 2033
- Table 16: Global Power Transistors Market Revenue billion Forecast, by Type 2020 & 2033
- Table 17: Global Power Transistors Market Revenue billion Forecast, by End User Industry 2020 & 2033
- Table 18: Global Power Transistors Market Revenue billion Forecast, by Country 2020 & 2033
Frequently Asked Questions
1. What is the projected Compound Annual Growth Rate (CAGR) of the Power Transistors Market?
The projected CAGR is approximately 8.15%.
2. Which companies are prominent players in the Power Transistors Market?
Key companies in the market include Infineon Technologies AG, NXP Semiconductors N V, Fairchild Semiconductor International Inc (ON Semiconductor Corp ), Taiwan Semiconductor Manufacturing Company, Samsung Electronics Co Ltd, Microchip Technology Inc *List Not Exhaustive, STMicroelectronics N V, GLOBALFOUNDRIES Inc, Texas Instruments Incorporated, Intel Corporation.
3. What are the main segments of the Power Transistors Market?
The market segments include Type, End User Industry.
4. Can you provide details about the market size?
The market size is estimated to be USD 15.82 billion as of 2022.
5. What are some drivers contributing to market growth?
Technological Advancements Leading To Demand for Increasing Device Densities; Proliferation of Consumer Electronics.
6. What are the notable trends driving market growth?
Increasing adoption of High Electron Mobility Transistor (HEMT).
7. Are there any restraints impacting market growth?
Cost of Maintaining Moore's Law is Getting Higher with Low Returns.
8. Can you provide examples of recent developments in the market?
September 2022 - EPC Power Conversion Corporation announced the EPC2050, a 350 V GaN transistor with a maximum RDS(on) of 80 mΩ and a pulsed output current of 26 A. The EPC2050 measures only 1.95 mm x 1.95 mm, making EPC2050-based solutions ten times smaller than solutions using equivalent silicon devices.
9. What pricing options are available for accessing the report?
Pricing options include single-user, multi-user, and enterprise licenses priced at USD 4750, USD 5250, and USD 8750 respectively.
10. Is the market size provided in terms of value or volume?
The market size is provided in terms of value, measured in billion.
11. Are there any specific market keywords associated with the report?
Yes, the market keyword associated with the report is "Power Transistors Market," which aids in identifying and referencing the specific market segment covered.
12. How do I determine which pricing option suits my needs best?
The pricing options vary based on user requirements and access needs. Individual users may opt for single-user licenses, while businesses requiring broader access may choose multi-user or enterprise licenses for cost-effective access to the report.
13. Are there any additional resources or data provided in the Power Transistors Market report?
While the report offers comprehensive insights, it's advisable to review the specific contents or supplementary materials provided to ascertain if additional resources or data are available.
14. How can I stay updated on further developments or reports in the Power Transistors Market?
To stay informed about further developments, trends, and reports in the Power Transistors Market, consider subscribing to industry newsletters, following relevant companies and organizations, or regularly checking reputable industry news sources and publications.
Methodology
Step 1 - Identification of Relevant Samples Size from Population Database


Step 2 - Approaches for Defining Global Market Size (Value, Volume* & Price*)

Note*: In applicable scenarios
Step 3 - Data Sources
Primary Research
- Web Analytics
- Survey Reports
- Research Institute
- Latest Research Reports
- Opinion Leaders
Secondary Research
- Annual Reports
- White Paper
- Latest Press Release
- Industry Association
- Paid Database
- Investor Presentations

Step 4 - Data Triangulation
Involves using different sources of information in order to increase the validity of a study
These sources are likely to be stakeholders in a program - participants, other researchers, program staff, other community members, and so on.
Then we put all data in single framework & apply various statistical tools to find out the dynamic on the market.
During the analysis stage, feedback from the stakeholder groups would be compared to determine areas of agreement as well as areas of divergence