Key Insights
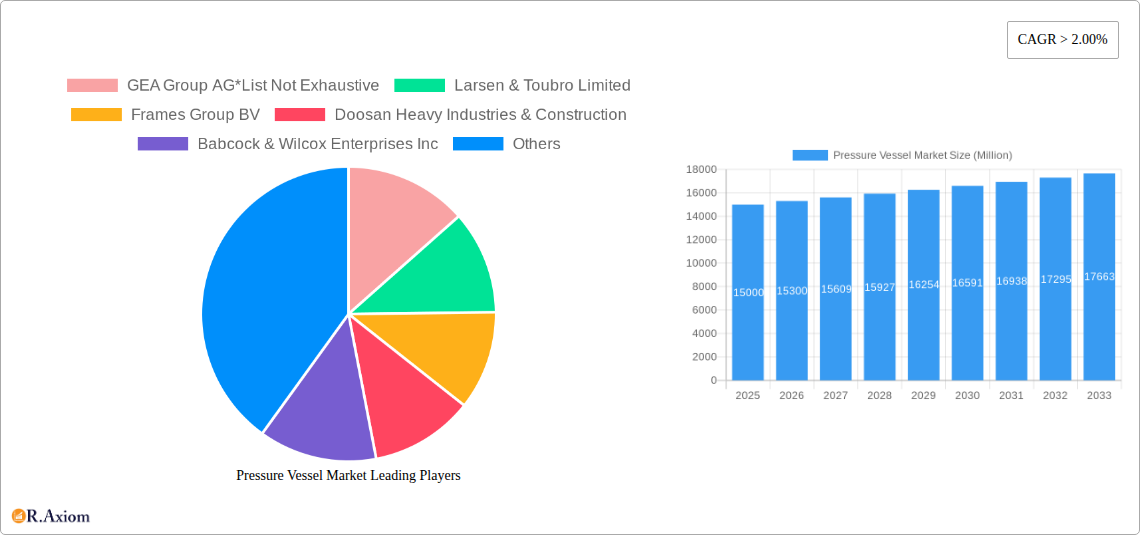
The global pressure vessel market, estimated at $27 billion in 2025, is poised for significant expansion with a projected Compound Annual Growth Rate (CAGR) of 8.6% between 2025 and 2033. This growth is primarily fueled by the robust expansion of the oil and gas sector and the escalating demand for chemicals and fertilizers, both requiring increased pressure vessel capacity for storage and processing. Additionally, the burgeoning power generation industry, particularly the adoption of renewable energy sources necessitating efficient energy storage and handling solutions, is a key growth driver. Technological innovations in materials science, advanced designs, and increasingly stringent safety regulations further bolster market expansion. While fluctuating raw material costs and potential supply chain disruptions present challenges, the overall market outlook is highly positive. The oil and gas and chemical & fertilizer industries are dominant end-user segments, with storage vessels representing a critical application. Leading industry players including GEA Group AG and Larsen & Toubro Limited are actively engaged in this competitive landscape, which spans North America, Europe, Asia Pacific, South America, and the Middle East & Africa.
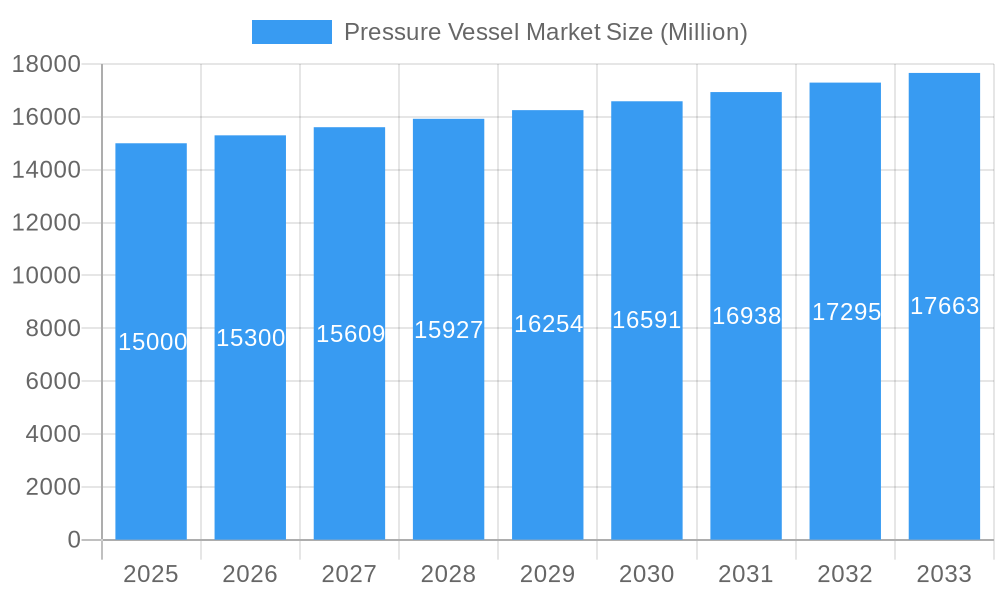
Pressure Vessel Market Market Size (In Billion)
Future market dynamics will be shaped by the increasing adoption of advanced materials like high-strength steel and composites, enhancing vessel durability and operational efficiency. A growing emphasis on sustainability will drive demand for pressure vessels designed for eco-friendly processes. Stringent safety standards and advancements in inspection methodologies will continue to propel market growth. Regional growth is anticipated to be most pronounced in the Asia Pacific region, driven by rapid industrialization and infrastructure development. Mature markets in North America and Europe will experience steady expansion through replacement cycles and technological upgrades. Intense competition is expected to persist, with established companies prioritizing innovation and strategic alliances to sustain market leadership. The long-term forecast indicates sustained growth for the pressure vessel market, underpinned by ongoing technological advancements and the evolving needs of diverse industrial sectors.
Pressure Vessel Market Company Market Share
Pressure Vessel Market: A Comprehensive Analysis (2019-2033)
This in-depth report provides a comprehensive analysis of the global Pressure Vessel Market, offering valuable insights for industry stakeholders, investors, and strategic decision-makers. The study covers the period from 2019 to 2033, with 2025 serving as the base year. We project a robust market expansion driven by key technological advancements and increasing demand across diverse sectors. This report meticulously examines market concentration, industry trends, dominant segments, product developments, and future opportunities, equipping readers with actionable intelligence for informed strategic planning.
Pressure Vessel Market Market Concentration & Innovation
The Pressure Vessel market exhibits a moderately concentrated landscape, with several key players holding significant market share. However, the presence of numerous smaller, specialized manufacturers indicates a dynamic competitive environment. Market share data for 2024 reveals that the top five players collectively hold approximately xx% of the market, while the remaining share is distributed among numerous smaller participants. Innovation is a key driver, with companies focusing on advanced materials, enhanced design techniques (e.g., Finite Element Analysis - FEA for optimized designs), and improved manufacturing processes to enhance product efficiency, durability, and safety. Stringent regulatory frameworks, particularly concerning safety standards and environmental compliance (e.g., ASME codes, PED directives), significantly impact market dynamics. The industry witnesses continuous innovation to meet these evolving regulations. Furthermore, substitute materials and technologies (e.g., composite materials) pose a competitive challenge, while ongoing mergers and acquisitions (M&A) activity reshape the market landscape. Recent M&A deals have involved transactions valued at approximately xx Million, primarily driven by strategic expansions and technological integration.
- Market Concentration: Top 5 players hold approximately xx% market share in 2024.
- Innovation Drivers: Advanced materials, design techniques (FEA), improved manufacturing processes.
- Regulatory Frameworks: ASME codes, PED directives heavily influence product design and manufacturing.
- Product Substitutes: Composite materials represent a growing competitive threat.
- M&A Activity: Recent deals valued at approximately xx Million demonstrate strategic consolidation.
Pressure Vessel Market Industry Trends & Insights
The global Pressure Vessel market is projected to experience a Compound Annual Growth Rate (CAGR) of xx% during the forecast period (2025-2033). This growth is fueled by several key factors, including the rising demand from the oil and gas, chemicals, and power generation sectors. Technological disruptions, such as the adoption of advanced manufacturing techniques (e.g., additive manufacturing) and the integration of smart sensors for predictive maintenance, are transforming the industry. Consumer preference for enhanced safety, reliability, and efficiency drives demand for higher-quality pressure vessels. Intense competition among established players and new entrants fosters innovation and price optimization. Market penetration of advanced materials, such as high-strength steels and composites, is increasing, contributing to overall market expansion. The shift towards sustainable practices and stringent environmental regulations further influences material selection and design considerations. The market penetration of advanced pressure vessels in specialized applications (e.g., cryogenic storage) is also contributing to growth, adding to the overall market expansion.
Dominant Markets & Segments in Pressure Vessel Market
The Oil and Gas sector currently dominates the Pressure Vessel market, driven by extensive exploration and production activities worldwide. The Chemicals and Fertilizers segment is also experiencing substantial growth due to increasing industrialization and agricultural needs. Within applications, Storage Vessels account for the largest share, followed by Processing Vessels.
Key Drivers:
- Oil and Gas: Rising energy demand, exploration activities in new geographical locations, and investments in refining and petrochemical projects fuel growth.
- Chemicals and Fertilizers: Increasing industrial production, global population growth, and rising agricultural demands drive demand.
- Power: Growth is primarily driven by the expansion of renewable energy sources and conventional power plants.
- Storage Vessels: Large-scale storage requirements in various industries drive market dominance.
- Processing Vessels: Essential role in chemical processing, refining, and other industrial applications.
Dominance Analysis:
The region of [Specify leading region - e.g., North America/Europe/Asia-Pacific] currently holds the largest market share, primarily due to well-established industrial bases, substantial investments in infrastructure, and favorable government policies. However, emerging economies in [Specify region - e.g., Asia-Pacific] are anticipated to witness rapid growth over the forecast period due to rapid industrialization and substantial investments in energy and infrastructure development.
Pressure Vessel Market Product Developments
Recent innovations focus on lighter, stronger materials, improved corrosion resistance, and advanced design capabilities leveraging simulation software. These advancements result in enhanced safety, longer lifespans, and reduced maintenance needs. The integration of smart sensors for real-time monitoring and predictive maintenance is also gaining traction, enhancing operational efficiency and minimizing downtime. The market is witnessing a strong trend toward customization to meet the specific needs of various end-use industries.
Report Scope & Segmentation Analysis
This report segments the Pressure Vessel market based on End-User Industry (Oil and Gas, Chemicals and Fertilizers, Power, Others) and Application (Storage Vessel, Processing Vessel, Others). Each segment’s growth projections, market sizes (in Millions), and competitive landscape are analyzed. For instance, the Oil and Gas segment is projected to experience a CAGR of xx% during the forecast period, driven by ongoing exploration and production activities, whereas the Storage Vessel application segment will maintain its market leadership due to increasing demand across diverse industries.
Key Drivers of Pressure Vessel Market Growth
The market's growth is propelled by several factors: rising energy demands driving expansion in the oil and gas sector; escalating chemical and fertilizer production to meet global needs; increasing power generation capacity; and technological advancements leading to safer, more efficient pressure vessels. Favorable government policies promoting industrial development in various regions further accelerate market growth.
Challenges in the Pressure Vessel Market Sector
Challenges include fluctuating raw material prices impacting manufacturing costs; stringent safety regulations demanding significant investments in compliance; and supply chain disruptions affecting production timelines and market stability. The impact of these challenges on market growth varies but, conservatively, could potentially decrease the projected CAGR by approximately xx% without appropriate mitigation strategies.
Emerging Opportunities in Pressure Vessel Market
Emerging opportunities lie in the adoption of advanced materials like composites and innovative manufacturing processes like 3D printing, enabling customization and improved performance. Expanding into new markets, particularly in developing economies experiencing rapid industrialization, presents significant growth potential. The growing focus on sustainable manufacturing practices also opens avenues for eco-friendly pressure vessel solutions.
Leading Players in the Pressure Vessel Market Market
- GEA Group AG
- Larsen & Toubro Limited
- Frames Group BV
- Doosan Heavy Industries & Construction
- Babcock & Wilcox Enterprises Inc
- IHI Plant Services Corporation
- Aager GmbH (Ergil)
- Andritz AG
- Alfa Laval AB
Key Developments in Pressure Vessel Market Industry
- November 2022: Rosatom completed the installation of the reactor pressure vessel for the second unit of Bangladesh's first NPP. This signifies a significant advancement in nuclear power infrastructure development, impacting the market positively.
- August 2022: Installation of the Reactor Pressure Vessel (RPV) at unit 2 of the Zhangzhou nuclear power plant in China. This highlights the ongoing expansion of nuclear power capacity, further driving demand for specialized pressure vessels.
Strategic Outlook for Pressure Vessel Market Market
The Pressure Vessel market is poised for continued expansion, driven by sustained growth across various end-use sectors and technological advancements. Strategic partnerships, focus on innovation, and expansion into high-growth markets will be crucial for success. The increasing focus on sustainability and environmental regulations will also shape future market dynamics, favoring companies offering eco-friendly and efficient solutions.
Pressure Vessel Market Segmentation
-
1. Application
- 1.1. Storage Vessel
- 1.2. Processing Vessel
- 1.3. Others
-
2. End-User Industry
- 2.1. Oil and Gas
- 2.2. Chemicals and Fertilizers
- 2.3. Power
- 2.4. Others
Pressure Vessel Market Segmentation By Geography
- 1. North America
- 2. Europe
- 3. Asia Pacific
- 4. South America
- 5. Middle East and Africa
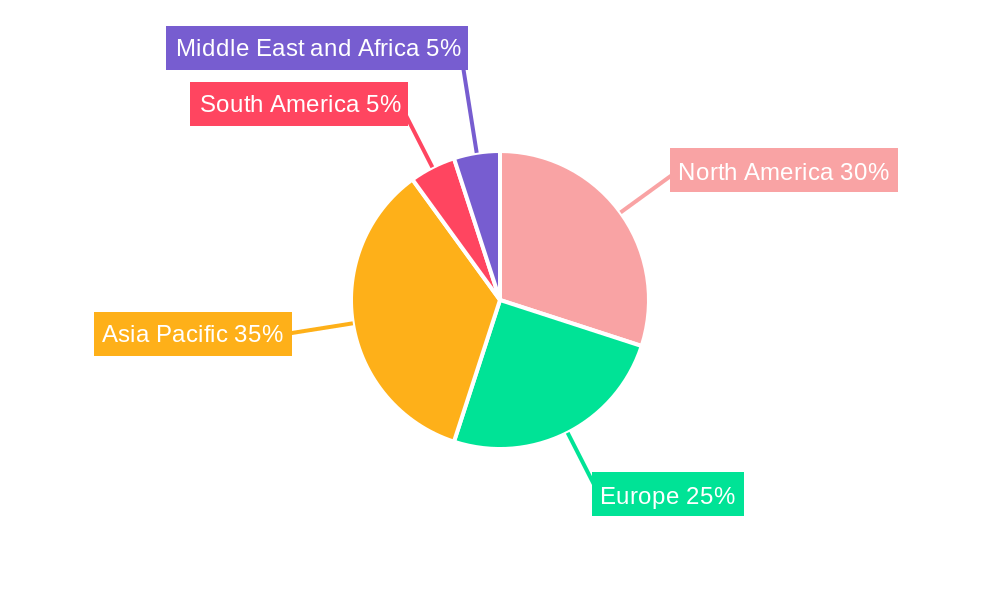
Pressure Vessel Market Regional Market Share
Geographic Coverage of Pressure Vessel Market
Pressure Vessel Market REPORT HIGHLIGHTS
| Aspects | Details |
|---|---|
| Study Period | 2020-2034 |
| Base Year | 2025 |
| Estimated Year | 2026 |
| Forecast Period | 2026-2034 |
| Historical Period | 2020-2025 |
| Growth Rate | CAGR of 8.6% from 2020-2034 |
| Segmentation |
|
Table of Contents
- 1. Introduction
- 1.1. Research Scope
- 1.2. Market Segmentation
- 1.3. Research Objective
- 1.4. Definitions and Assumptions
- 2. Executive Summary
- 2.1. Market Snapshot
- 3. Market Dynamics
- 3.1. Market Drivers
- 3.2. Market Restrains
- 3.3. Market Trends
- 3.4. Market Opportunities
- 4. Market Factor Analysis
- 4.1. Porters Five Forces
- 4.1.1. Bargaining Power of Suppliers
- 4.1.2. Bargaining Power of Buyers
- 4.1.3. Threat of New Entrants
- 4.1.4. Threat of Substitutes
- 4.1.5. Competitive Rivalry
- 4.2. PESTEL analysis
- 4.3. BCG Analysis
- 4.3.1. Stars (High Growth, High Market Share)
- 4.3.2. Cash Cows (Low Growth, High Market Share)
- 4.3.3. Question Mark (High Growth, Low Market Share)
- 4.3.4. Dogs (Low Growth, Low Market Share)
- 4.4. Ansoff Matrix Analysis
- 4.5. Supply Chain Analysis
- 4.6. Regulatory Landscape
- 4.7. Current Market Potential and Opportunity Assessment (TAM–SAM–SOM Framework)
- 4.8. RAX Analyst Note
- 4.1. Porters Five Forces
- 5. Market Analysis, Insights and Forecast 2021-2033
- 5.1. Market Analysis, Insights and Forecast - by Application
- 5.1.1. Storage Vessel
- 5.1.2. Processing Vessel
- 5.1.3. Others
- 5.2. Market Analysis, Insights and Forecast - by End-User Industry
- 5.2.1. Oil and Gas
- 5.2.2. Chemicals and Fertilizers
- 5.2.3. Power
- 5.2.4. Others
- 5.3. Market Analysis, Insights and Forecast - by Region
- 5.3.1. North America
- 5.3.2. Europe
- 5.3.3. Asia Pacific
- 5.3.4. South America
- 5.3.5. Middle East and Africa
- 5.1. Market Analysis, Insights and Forecast - by Application
- 6. Global Pressure Vessel Market Analysis, Insights and Forecast, 2021-2033
- 6.1. Market Analysis, Insights and Forecast - by Application
- 6.1.1. Storage Vessel
- 6.1.2. Processing Vessel
- 6.1.3. Others
- 6.2. Market Analysis, Insights and Forecast - by End-User Industry
- 6.2.1. Oil and Gas
- 6.2.2. Chemicals and Fertilizers
- 6.2.3. Power
- 6.2.4. Others
- 6.1. Market Analysis, Insights and Forecast - by Application
- 7. North America Pressure Vessel Market Analysis, Insights and Forecast, 2020-2032
- 7.1. Market Analysis, Insights and Forecast - by Application
- 7.1.1. Storage Vessel
- 7.1.2. Processing Vessel
- 7.1.3. Others
- 7.2. Market Analysis, Insights and Forecast - by End-User Industry
- 7.2.1. Oil and Gas
- 7.2.2. Chemicals and Fertilizers
- 7.2.3. Power
- 7.2.4. Others
- 7.1. Market Analysis, Insights and Forecast - by Application
- 8. Europe Pressure Vessel Market Analysis, Insights and Forecast, 2020-2032
- 8.1. Market Analysis, Insights and Forecast - by Application
- 8.1.1. Storage Vessel
- 8.1.2. Processing Vessel
- 8.1.3. Others
- 8.2. Market Analysis, Insights and Forecast - by End-User Industry
- 8.2.1. Oil and Gas
- 8.2.2. Chemicals and Fertilizers
- 8.2.3. Power
- 8.2.4. Others
- 8.1. Market Analysis, Insights and Forecast - by Application
- 9. Asia Pacific Pressure Vessel Market Analysis, Insights and Forecast, 2020-2032
- 9.1. Market Analysis, Insights and Forecast - by Application
- 9.1.1. Storage Vessel
- 9.1.2. Processing Vessel
- 9.1.3. Others
- 9.2. Market Analysis, Insights and Forecast - by End-User Industry
- 9.2.1. Oil and Gas
- 9.2.2. Chemicals and Fertilizers
- 9.2.3. Power
- 9.2.4. Others
- 9.1. Market Analysis, Insights and Forecast - by Application
- 10. South America Pressure Vessel Market Analysis, Insights and Forecast, 2020-2032
- 10.1. Market Analysis, Insights and Forecast - by Application
- 10.1.1. Storage Vessel
- 10.1.2. Processing Vessel
- 10.1.3. Others
- 10.2. Market Analysis, Insights and Forecast - by End-User Industry
- 10.2.1. Oil and Gas
- 10.2.2. Chemicals and Fertilizers
- 10.2.3. Power
- 10.2.4. Others
- 10.1. Market Analysis, Insights and Forecast - by Application
- 11. Middle East and Africa Pressure Vessel Market Analysis, Insights and Forecast, 2020-2032
- 11.1. Market Analysis, Insights and Forecast - by Application
- 11.1.1. Storage Vessel
- 11.1.2. Processing Vessel
- 11.1.3. Others
- 11.2. Market Analysis, Insights and Forecast - by End-User Industry
- 11.2.1. Oil and Gas
- 11.2.2. Chemicals and Fertilizers
- 11.2.3. Power
- 11.2.4. Others
- 11.1. Market Analysis, Insights and Forecast - by Application
- 12. Competitive Analysis
- 12.1. Company Profiles
- 12.1.1 GEA Group AG*List Not Exhaustive
- 12.1.1.1. Company Overview
- 12.1.1.2. Products
- 12.1.1.3. Company Financials
- 12.1.1.4. SWOT Analysis
- 12.1.2 Larsen & Toubro Limited
- 12.1.2.1. Company Overview
- 12.1.2.2. Products
- 12.1.2.3. Company Financials
- 12.1.2.4. SWOT Analysis
- 12.1.3 Frames Group BV
- 12.1.3.1. Company Overview
- 12.1.3.2. Products
- 12.1.3.3. Company Financials
- 12.1.3.4. SWOT Analysis
- 12.1.4 Doosan Heavy Industries & Construction
- 12.1.4.1. Company Overview
- 12.1.4.2. Products
- 12.1.4.3. Company Financials
- 12.1.4.4. SWOT Analysis
- 12.1.5 Babcock & Wilcox Enterprises Inc
- 12.1.5.1. Company Overview
- 12.1.5.2. Products
- 12.1.5.3. Company Financials
- 12.1.5.4. SWOT Analysis
- 12.1.6 IHI Plant Services Corporation
- 12.1.6.1. Company Overview
- 12.1.6.2. Products
- 12.1.6.3. Company Financials
- 12.1.6.4. SWOT Analysis
- 12.1.7 Aager GmbH (Ergil)
- 12.1.7.1. Company Overview
- 12.1.7.2. Products
- 12.1.7.3. Company Financials
- 12.1.7.4. SWOT Analysis
- 12.1.8 Andritz AG
- 12.1.8.1. Company Overview
- 12.1.8.2. Products
- 12.1.8.3. Company Financials
- 12.1.8.4. SWOT Analysis
- 12.1.9 Alfa Laval AB
- 12.1.9.1. Company Overview
- 12.1.9.2. Products
- 12.1.9.3. Company Financials
- 12.1.9.4. SWOT Analysis
- 12.1.1 GEA Group AG*List Not Exhaustive
- 12.2. Market Entropy
- 12.2.1 Company's Key Areas Served
- 12.2.2 Recent Developments
- 12.3. Company Market Share Analysis 2025
- 12.3.1 Top 5 Companies Market Share Analysis
- 12.3.2 Top 3 Companies Market Share Analysis
- 12.4. List of Potential Customers
- 13. Research Methodology
List of Figures
- Figure 1: Global Pressure Vessel Market Revenue Breakdown (billion, %) by Region 2025 & 2033
- Figure 2: Global Pressure Vessel Market Volume Breakdown (K Units, %) by Region 2025 & 2033
- Figure 3: North America Pressure Vessel Market Revenue (billion), by Application 2025 & 2033
- Figure 4: North America Pressure Vessel Market Volume (K Units), by Application 2025 & 2033
- Figure 5: North America Pressure Vessel Market Revenue Share (%), by Application 2025 & 2033
- Figure 6: North America Pressure Vessel Market Volume Share (%), by Application 2025 & 2033
- Figure 7: North America Pressure Vessel Market Revenue (billion), by End-User Industry 2025 & 2033
- Figure 8: North America Pressure Vessel Market Volume (K Units), by End-User Industry 2025 & 2033
- Figure 9: North America Pressure Vessel Market Revenue Share (%), by End-User Industry 2025 & 2033
- Figure 10: North America Pressure Vessel Market Volume Share (%), by End-User Industry 2025 & 2033
- Figure 11: North America Pressure Vessel Market Revenue (billion), by Country 2025 & 2033
- Figure 12: North America Pressure Vessel Market Volume (K Units), by Country 2025 & 2033
- Figure 13: North America Pressure Vessel Market Revenue Share (%), by Country 2025 & 2033
- Figure 14: North America Pressure Vessel Market Volume Share (%), by Country 2025 & 2033
- Figure 15: Europe Pressure Vessel Market Revenue (billion), by Application 2025 & 2033
- Figure 16: Europe Pressure Vessel Market Volume (K Units), by Application 2025 & 2033
- Figure 17: Europe Pressure Vessel Market Revenue Share (%), by Application 2025 & 2033
- Figure 18: Europe Pressure Vessel Market Volume Share (%), by Application 2025 & 2033
- Figure 19: Europe Pressure Vessel Market Revenue (billion), by End-User Industry 2025 & 2033
- Figure 20: Europe Pressure Vessel Market Volume (K Units), by End-User Industry 2025 & 2033
- Figure 21: Europe Pressure Vessel Market Revenue Share (%), by End-User Industry 2025 & 2033
- Figure 22: Europe Pressure Vessel Market Volume Share (%), by End-User Industry 2025 & 2033
- Figure 23: Europe Pressure Vessel Market Revenue (billion), by Country 2025 & 2033
- Figure 24: Europe Pressure Vessel Market Volume (K Units), by Country 2025 & 2033
- Figure 25: Europe Pressure Vessel Market Revenue Share (%), by Country 2025 & 2033
- Figure 26: Europe Pressure Vessel Market Volume Share (%), by Country 2025 & 2033
- Figure 27: Asia Pacific Pressure Vessel Market Revenue (billion), by Application 2025 & 2033
- Figure 28: Asia Pacific Pressure Vessel Market Volume (K Units), by Application 2025 & 2033
- Figure 29: Asia Pacific Pressure Vessel Market Revenue Share (%), by Application 2025 & 2033
- Figure 30: Asia Pacific Pressure Vessel Market Volume Share (%), by Application 2025 & 2033
- Figure 31: Asia Pacific Pressure Vessel Market Revenue (billion), by End-User Industry 2025 & 2033
- Figure 32: Asia Pacific Pressure Vessel Market Volume (K Units), by End-User Industry 2025 & 2033
- Figure 33: Asia Pacific Pressure Vessel Market Revenue Share (%), by End-User Industry 2025 & 2033
- Figure 34: Asia Pacific Pressure Vessel Market Volume Share (%), by End-User Industry 2025 & 2033
- Figure 35: Asia Pacific Pressure Vessel Market Revenue (billion), by Country 2025 & 2033
- Figure 36: Asia Pacific Pressure Vessel Market Volume (K Units), by Country 2025 & 2033
- Figure 37: Asia Pacific Pressure Vessel Market Revenue Share (%), by Country 2025 & 2033
- Figure 38: Asia Pacific Pressure Vessel Market Volume Share (%), by Country 2025 & 2033
- Figure 39: South America Pressure Vessel Market Revenue (billion), by Application 2025 & 2033
- Figure 40: South America Pressure Vessel Market Volume (K Units), by Application 2025 & 2033
- Figure 41: South America Pressure Vessel Market Revenue Share (%), by Application 2025 & 2033
- Figure 42: South America Pressure Vessel Market Volume Share (%), by Application 2025 & 2033
- Figure 43: South America Pressure Vessel Market Revenue (billion), by End-User Industry 2025 & 2033
- Figure 44: South America Pressure Vessel Market Volume (K Units), by End-User Industry 2025 & 2033
- Figure 45: South America Pressure Vessel Market Revenue Share (%), by End-User Industry 2025 & 2033
- Figure 46: South America Pressure Vessel Market Volume Share (%), by End-User Industry 2025 & 2033
- Figure 47: South America Pressure Vessel Market Revenue (billion), by Country 2025 & 2033
- Figure 48: South America Pressure Vessel Market Volume (K Units), by Country 2025 & 2033
- Figure 49: South America Pressure Vessel Market Revenue Share (%), by Country 2025 & 2033
- Figure 50: South America Pressure Vessel Market Volume Share (%), by Country 2025 & 2033
- Figure 51: Middle East and Africa Pressure Vessel Market Revenue (billion), by Application 2025 & 2033
- Figure 52: Middle East and Africa Pressure Vessel Market Volume (K Units), by Application 2025 & 2033
- Figure 53: Middle East and Africa Pressure Vessel Market Revenue Share (%), by Application 2025 & 2033
- Figure 54: Middle East and Africa Pressure Vessel Market Volume Share (%), by Application 2025 & 2033
- Figure 55: Middle East and Africa Pressure Vessel Market Revenue (billion), by End-User Industry 2025 & 2033
- Figure 56: Middle East and Africa Pressure Vessel Market Volume (K Units), by End-User Industry 2025 & 2033
- Figure 57: Middle East and Africa Pressure Vessel Market Revenue Share (%), by End-User Industry 2025 & 2033
- Figure 58: Middle East and Africa Pressure Vessel Market Volume Share (%), by End-User Industry 2025 & 2033
- Figure 59: Middle East and Africa Pressure Vessel Market Revenue (billion), by Country 2025 & 2033
- Figure 60: Middle East and Africa Pressure Vessel Market Volume (K Units), by Country 2025 & 2033
- Figure 61: Middle East and Africa Pressure Vessel Market Revenue Share (%), by Country 2025 & 2033
- Figure 62: Middle East and Africa Pressure Vessel Market Volume Share (%), by Country 2025 & 2033
List of Tables
- Table 1: Global Pressure Vessel Market Revenue billion Forecast, by Application 2020 & 2033
- Table 2: Global Pressure Vessel Market Volume K Units Forecast, by Application 2020 & 2033
- Table 3: Global Pressure Vessel Market Revenue billion Forecast, by End-User Industry 2020 & 2033
- Table 4: Global Pressure Vessel Market Volume K Units Forecast, by End-User Industry 2020 & 2033
- Table 5: Global Pressure Vessel Market Revenue billion Forecast, by Region 2020 & 2033
- Table 6: Global Pressure Vessel Market Volume K Units Forecast, by Region 2020 & 2033
- Table 7: Global Pressure Vessel Market Revenue billion Forecast, by Application 2020 & 2033
- Table 8: Global Pressure Vessel Market Volume K Units Forecast, by Application 2020 & 2033
- Table 9: Global Pressure Vessel Market Revenue billion Forecast, by End-User Industry 2020 & 2033
- Table 10: Global Pressure Vessel Market Volume K Units Forecast, by End-User Industry 2020 & 2033
- Table 11: Global Pressure Vessel Market Revenue billion Forecast, by Country 2020 & 2033
- Table 12: Global Pressure Vessel Market Volume K Units Forecast, by Country 2020 & 2033
- Table 13: Global Pressure Vessel Market Revenue billion Forecast, by Application 2020 & 2033
- Table 14: Global Pressure Vessel Market Volume K Units Forecast, by Application 2020 & 2033
- Table 15: Global Pressure Vessel Market Revenue billion Forecast, by End-User Industry 2020 & 2033
- Table 16: Global Pressure Vessel Market Volume K Units Forecast, by End-User Industry 2020 & 2033
- Table 17: Global Pressure Vessel Market Revenue billion Forecast, by Country 2020 & 2033
- Table 18: Global Pressure Vessel Market Volume K Units Forecast, by Country 2020 & 2033
- Table 19: Global Pressure Vessel Market Revenue billion Forecast, by Application 2020 & 2033
- Table 20: Global Pressure Vessel Market Volume K Units Forecast, by Application 2020 & 2033
- Table 21: Global Pressure Vessel Market Revenue billion Forecast, by End-User Industry 2020 & 2033
- Table 22: Global Pressure Vessel Market Volume K Units Forecast, by End-User Industry 2020 & 2033
- Table 23: Global Pressure Vessel Market Revenue billion Forecast, by Country 2020 & 2033
- Table 24: Global Pressure Vessel Market Volume K Units Forecast, by Country 2020 & 2033
- Table 25: Global Pressure Vessel Market Revenue billion Forecast, by Application 2020 & 2033
- Table 26: Global Pressure Vessel Market Volume K Units Forecast, by Application 2020 & 2033
- Table 27: Global Pressure Vessel Market Revenue billion Forecast, by End-User Industry 2020 & 2033
- Table 28: Global Pressure Vessel Market Volume K Units Forecast, by End-User Industry 2020 & 2033
- Table 29: Global Pressure Vessel Market Revenue billion Forecast, by Country 2020 & 2033
- Table 30: Global Pressure Vessel Market Volume K Units Forecast, by Country 2020 & 2033
- Table 31: Global Pressure Vessel Market Revenue billion Forecast, by Application 2020 & 2033
- Table 32: Global Pressure Vessel Market Volume K Units Forecast, by Application 2020 & 2033
- Table 33: Global Pressure Vessel Market Revenue billion Forecast, by End-User Industry 2020 & 2033
- Table 34: Global Pressure Vessel Market Volume K Units Forecast, by End-User Industry 2020 & 2033
- Table 35: Global Pressure Vessel Market Revenue billion Forecast, by Country 2020 & 2033
- Table 36: Global Pressure Vessel Market Volume K Units Forecast, by Country 2020 & 2033
Frequently Asked Questions
1. What is the projected Compound Annual Growth Rate (CAGR) of the Pressure Vessel Market?
The projected CAGR is approximately 8.6%.
2. Which companies are prominent players in the Pressure Vessel Market?
Key companies in the market include GEA Group AG*List Not Exhaustive, Larsen & Toubro Limited, Frames Group BV, Doosan Heavy Industries & Construction, Babcock & Wilcox Enterprises Inc, IHI Plant Services Corporation, Aager GmbH (Ergil), Andritz AG, Alfa Laval AB.
3. What are the main segments of the Pressure Vessel Market?
The market segments include Application, End-User Industry.
4. Can you provide details about the market size?
The market size is estimated to be USD 27 billion as of 2022.
5. What are some drivers contributing to market growth?
4.; Declining Lithium-Ion Battery Prices4.; Increasing Adoption Of Electric Vehicles.
6. What are the notable trends driving market growth?
Processing Vessel Segment Expected to Grow Significantly.
7. Are there any restraints impacting market growth?
4.; Safety Concerns Related To Lithium-Ion Battery.
8. Can you provide examples of recent developments in the market?
November 2022: the Russian state atomic energy corporation Rosatom announced the installation of the reactor pressure vessel for the second unit of the first Nuclear Power Plant (NPP) in Bangladesh completed.
9. What pricing options are available for accessing the report?
Pricing options include single-user, multi-user, and enterprise licenses priced at USD 4750, USD 5250, and USD 8750 respectively.
10. Is the market size provided in terms of value or volume?
The market size is provided in terms of value, measured in billion and volume, measured in K Units.
11. Are there any specific market keywords associated with the report?
Yes, the market keyword associated with the report is "Pressure Vessel Market," which aids in identifying and referencing the specific market segment covered.
12. How do I determine which pricing option suits my needs best?
The pricing options vary based on user requirements and access needs. Individual users may opt for single-user licenses, while businesses requiring broader access may choose multi-user or enterprise licenses for cost-effective access to the report.
13. Are there any additional resources or data provided in the Pressure Vessel Market report?
While the report offers comprehensive insights, it's advisable to review the specific contents or supplementary materials provided to ascertain if additional resources or data are available.
14. How can I stay updated on further developments or reports in the Pressure Vessel Market?
To stay informed about further developments, trends, and reports in the Pressure Vessel Market, consider subscribing to industry newsletters, following relevant companies and organizations, or regularly checking reputable industry news sources and publications.
Methodology
Step 1 - Identification of Relevant Samples Size from Population Database


Step 2 - Approaches for Defining Global Market Size (Value, Volume* & Price*)

Note*: In applicable scenarios
Step 3 - Data Sources
Primary Research
- Web Analytics
- Survey Reports
- Research Institute
- Latest Research Reports
- Opinion Leaders
Secondary Research
- Annual Reports
- White Paper
- Latest Press Release
- Industry Association
- Paid Database
- Investor Presentations

Step 4 - Data Triangulation
Involves using different sources of information in order to increase the validity of a study
These sources are likely to be stakeholders in a program - participants, other researchers, program staff, other community members, and so on.
Then we put all data in single framework & apply various statistical tools to find out the dynamic on the market.
During the analysis stage, feedback from the stakeholder groups would be compared to determine areas of agreement as well as areas of divergence

