


Key Insights
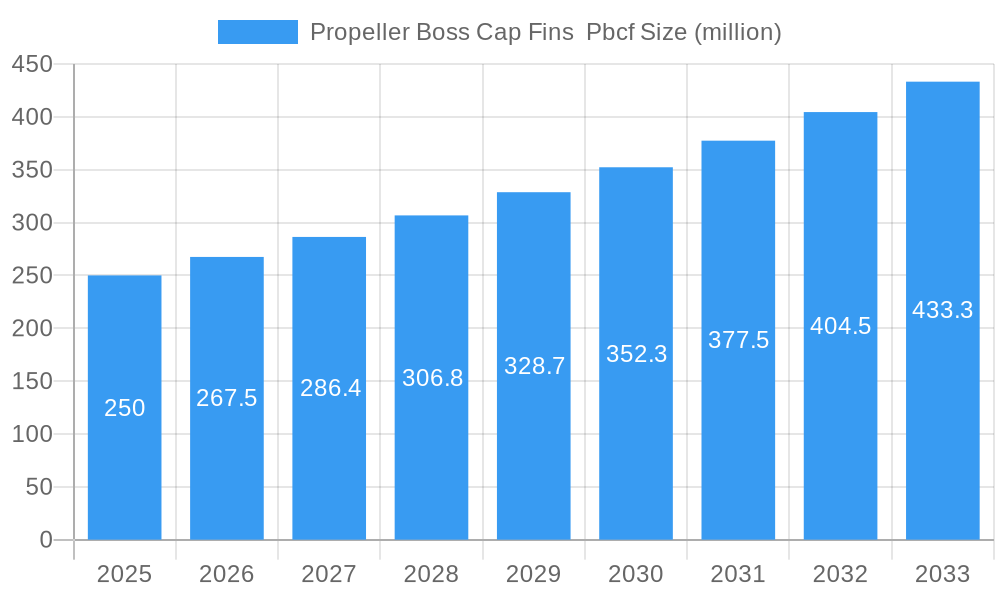
The Propeller Boss Cap Fins (PBCF) market is experiencing robust growth, driven by increasing demand for fuel efficiency and improved propeller performance in the maritime industry. The market size in 2025 is estimated at $250 million, projecting a Compound Annual Growth Rate (CAGR) of 7% from 2025 to 2033. This growth is fueled by several key factors: stringent environmental regulations promoting energy-efficient shipping, the rising adoption of larger and more powerful vessels, and technological advancements leading to improved PBCF designs. Key trends include the increasing integration of advanced materials like composites for enhanced durability and lightweighting, and the development of customized PBCF solutions tailored to specific vessel types and operational requirements. While some restraints exist, such as the initial high investment cost associated with PBCF installation and potential maintenance challenges, the long-term benefits in fuel savings and reduced emissions significantly outweigh these drawbacks. Leading market players like Mitsui OSK, Misea Machinery, Fountom, Nakashima, and ERMA FIRST are actively investing in research and development to maintain their competitive edge.
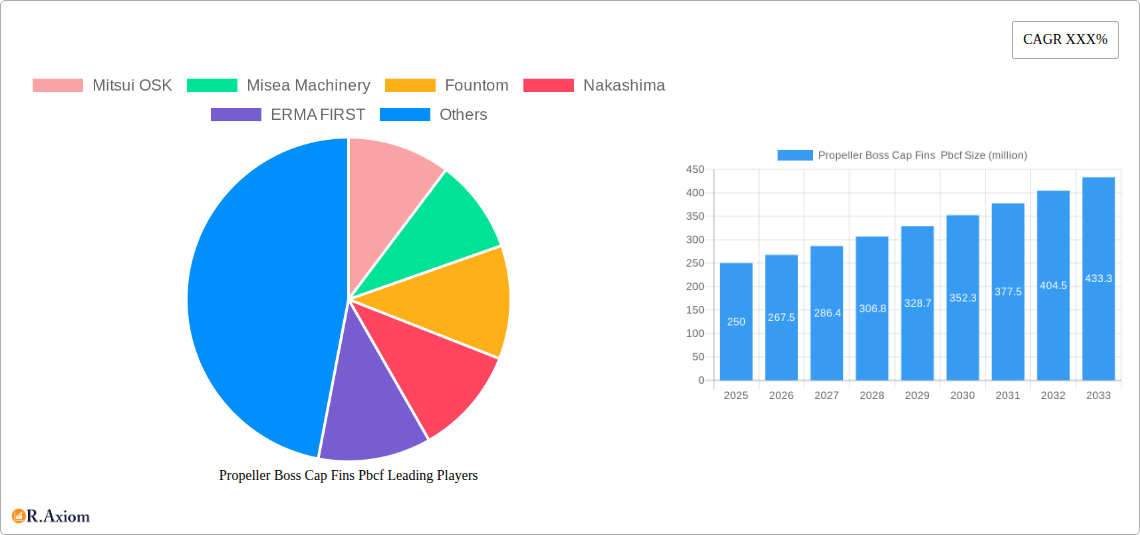
Propeller Boss Cap Fins Pbcf Market Size (In Million)

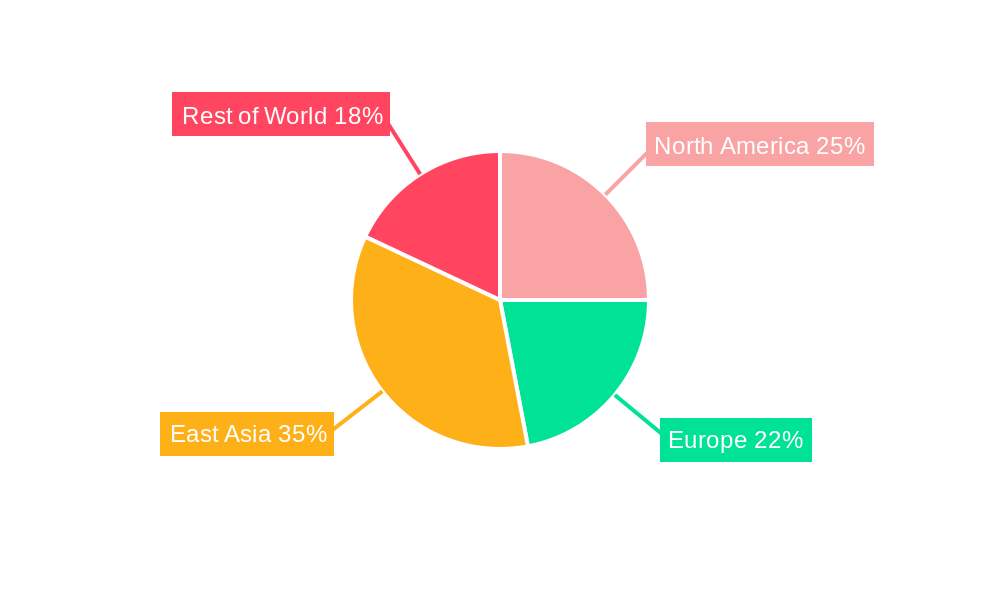
The competitive landscape is characterized by a mix of established players and emerging innovators. Companies are focusing on strategic partnerships and acquisitions to expand their market reach and technological capabilities. The regional distribution of the market is likely skewed towards regions with significant maritime activity, such as East Asia, Europe, and North America. Future market growth is expected to be influenced by evolving global trade patterns, the development of sustainable shipping solutions, and ongoing advancements in hydrodynamics and materials science. The forecast period, 2025-2033, indicates considerable potential for market expansion, presenting lucrative opportunities for industry stakeholders. Continued innovation in PBCF design and manufacturing will be crucial to sustaining this growth trajectory and meeting the evolving needs of the shipping industry.
Propeller Boss Cap Fins Pbcf Company Market Share
Propeller Boss Cap Fins (PBCF) Market: A Comprehensive Report (2019-2033)
This comprehensive report provides an in-depth analysis of the global Propeller Boss Cap Fins (PBCF) market, offering invaluable insights for industry stakeholders, investors, and strategic decision-makers. The study covers the period from 2019 to 2033, with 2025 serving as the base and estimated year. The report leverages rigorous data analysis and expert insights to project market growth, identify key trends, and highlight promising opportunities. The global PBCF market is estimated to be worth xx million in 2025 and is projected to reach xx million by 2033, exhibiting a CAGR of xx% during the forecast period (2025-2033).
Propeller Boss Cap Fins (PBCF) Market Concentration & Innovation
The global PBCF market exhibits a moderately concentrated landscape, with a few key players holding significant market share. Mitsui OSK, Misea Machinery, Fountom, Nakashima, and ERMA FIRST are among the prominent companies shaping the market dynamics. Market share data for 2025 indicates Mitsui OSK holds approximately xx% market share, followed by Misea Machinery at xx%, Fountom at xx%, Nakashima at xx%, and ERMA FIRST at xx%. Innovation in PBCF technology is driven by the need for enhanced propeller efficiency, reduced fuel consumption, and improved vessel performance. This is leading to the development of advanced materials, optimized designs, and integrated monitoring systems. Regulatory frameworks, such as those related to emissions and vessel safety, play a significant role in shaping the market. Product substitutes, while limited, include alternative propeller designs and propulsion systems. End-user trends indicate a growing preference for fuel-efficient and environmentally friendly solutions. M&A activities in the sector have been relatively modest in recent years, with a total deal value of approximately xx million over the period 2019-2024.
Propeller Boss Cap Fins (PBCF) Industry Trends & Insights
The PBCF market is experiencing robust growth driven by several key factors. The increasing demand for fuel-efficient shipping, stringent environmental regulations, and technological advancements in PBCF design are major contributors. The global shipping industry's continuous expansion is also fueling the demand for PBCF products. Technological disruptions, such as the adoption of advanced materials like composites and the integration of digital technologies, are transforming the industry. Consumer preferences are shifting towards sustainable and cost-effective solutions, leading to increased adoption of high-performance PBCF. The competitive landscape is characterized by both intense rivalry among established players and the emergence of new entrants, fostering innovation and driving down costs. Market penetration of PBCF systems is estimated to be approximately xx% in 2025, with significant growth potential in developing economies.
Dominant Markets & Segments in Propeller Boss Cap Fins (PBCF)
The Asia-Pacific region dominates the global PBCF market, driven by robust growth in shipping activities and infrastructure development. China, Japan, and South Korea are key contributors to this dominance.
- Key Drivers in Asia-Pacific:
- Rapid growth in container shipping and bulk cargo transportation.
- Significant investments in port infrastructure and shipbuilding.
- Favorable government policies supporting maritime industry development.
- High concentration of shipbuilding and shipping companies.
The dominance of Asia-Pacific stems from its large and rapidly expanding shipping industry, coupled with proactive government support for technological advancements in the maritime sector. The region’s significant investments in port infrastructure and shipbuilding further contribute to its leading market position. North America and Europe follow as significant markets, although their growth rate is comparatively slower than the Asia-Pacific region.
Propeller Boss Cap Fins (PBCF) Product Developments
Recent product innovations in PBCF have focused on improving efficiency, reducing noise and vibration, and enhancing durability. The use of advanced materials such as composites and optimized designs using computational fluid dynamics (CFD) are key technological trends. These improvements translate to enhanced fuel efficiency, reduced operating costs, and extended product lifespan, providing significant competitive advantages in the market. The market fit for these innovative products is strong, driven by increasing demands for sustainable and high-performance shipping solutions.
Report Scope & Segmentation Analysis
This report segments the PBCF market based on several key parameters. These include:
- By Vessel Type: Container ships, bulk carriers, tankers, and others. Each segment exhibits unique growth projections and competitive dynamics, reflecting the specific needs and operational characteristics of different vessel types.
- By Material: Steel, composite materials, and others. Different materials offer varying performance characteristics, affecting market share and price points.
- By Region: North America, Europe, Asia-Pacific, and the rest of the world. This segmentation allows for regional-specific analysis of market trends and opportunities.
Market size and growth projections vary across different segments, reflecting the specific market drivers and competitive dynamics within each.
Key Drivers of Propeller Boss Cap Fins (PBCF) Growth
Several factors contribute to the growth of the PBCF market:
- Stringent Environmental Regulations: International Maritime Organization (IMO) regulations on greenhouse gas emissions are driving the adoption of fuel-efficient technologies such as PBCF.
- Technological Advancements: Innovations in design, materials, and manufacturing processes are leading to improved PBCF performance and lower costs.
- Increased Demand for Fuel Efficiency: Rising fuel prices and the desire for cost optimization in the shipping industry fuel the demand for PBCF.
Challenges in the Propeller Boss Cap Fins (PBCF) Sector
Despite its growth potential, the PBCF sector faces several challenges:
- High Initial Investment Costs: The upfront cost of installing PBCF systems can be a barrier to adoption, particularly for smaller shipping companies. This factor limits market penetration, especially in developing economies.
- Supply Chain Disruptions: Global supply chain uncertainties can impact the availability of raw materials and manufacturing capacity, potentially affecting product availability and pricing.
- Intense Competition: The market is characterized by intense competition among established players, leading to price pressure and the need for continuous innovation.
Emerging Opportunities in Propeller Boss Cap Fins (PBCF)
The PBCF market presents various emerging opportunities:
- Expanding into New Markets: Developing economies with growing shipping industries present significant untapped potential.
- Development of Advanced Materials: Research and development in advanced materials, like lightweight composites, offer opportunities for enhancing PBCF performance and reducing costs.
- Integration of Digital Technologies: The integration of IoT sensors and data analytics can lead to predictive maintenance and optimize PBCF performance.
Leading Players in the Propeller Boss Cap Fins (PBCF) Market
- Mitsui OSK Lines, Ltd.
- Misea Machinery
- Fountom
- Nakashima Propeller Co., Ltd.
- ERMA FIRST
Key Developments in Propeller Boss Cap Fins (PBCF) Industry
- 2022-Q4: Mitsui OSK Lines announced a new PBCF design incorporating advanced composite materials.
- 2023-Q1: Misea Machinery launched a new line of PBCF systems with integrated monitoring capabilities.
- 2024-Q3: Nakashima Propeller secured a major contract to supply PBCF systems for a large fleet of container ships.
Strategic Outlook for Propeller Boss Cap Fins (PBCF) Market
The PBCF market is poised for continued growth, driven by increasing demand for fuel-efficient and environmentally friendly shipping solutions. Technological advancements and expanding global shipping activities will further contribute to market expansion. Companies that can effectively leverage innovation, optimize supply chains, and cater to the evolving needs of the shipping industry are well-positioned to capture significant market share and drive future growth.
Propeller Boss Cap Fins Pbcf Segmentation
-
1. Application
- 1.1. Tanker Vessels
- 1.2. Container Vessels
- 1.3. Bulk Vessels
-
2. Type
- 2.1. Fixed PBCF
- 2.2. Adjustable PBCF
Propeller Boss Cap Fins Pbcf Segmentation By Geography
-
1. North America
- 1.1. United States
- 1.2. Canada
- 1.3. Mexico
-
2. South America
- 2.1. Brazil
- 2.2. Argentina
- 2.3. Rest of South America
-
3. Europe
- 3.1. United Kingdom
- 3.2. Germany
- 3.3. France
- 3.4. Italy
- 3.5. Spain
- 3.6. Russia
- 3.7. Benelux
- 3.8. Nordics
- 3.9. Rest of Europe
-
4. Middle East & Africa
- 4.1. Turkey
- 4.2. Israel
- 4.3. GCC
- 4.4. North Africa
- 4.5. South Africa
- 4.6. Rest of Middle East & Africa
-
5. Asia Pacific
- 5.1. China
- 5.2. India
- 5.3. Japan
- 5.4. South Korea
- 5.5. ASEAN
- 5.6. Oceania
- 5.7. Rest of Asia Pacific
Propeller Boss Cap Fins Pbcf Regional Market Share
Geographic Coverage of Propeller Boss Cap Fins Pbcf
Propeller Boss Cap Fins Pbcf REPORT HIGHLIGHTS
| Aspects | Details |
|---|---|
| Study Period | 2020-2034 |
| Base Year | 2025 |
| Estimated Year | 2026 |
| Forecast Period | 2026-2034 |
| Historical Period | 2020-2025 |
| Growth Rate | CAGR of XXX% from 2020-2034 |
| Segmentation |
|
Table of Contents
- 1. Introduction
- 1.1. Research Scope
- 1.2. Market Segmentation
- 1.3. Research Methodology
- 1.4. Definitions and Assumptions
- 2. Executive Summary
- 2.1. Introduction
- 3. Market Dynamics
- 3.1. Introduction
- 3.2. Market Drivers
- 3.3. Market Restrains
- 3.4. Market Trends
- 4. Market Factor Analysis
- 4.1. Porters Five Forces
- 4.2. Supply/Value Chain
- 4.3. PESTEL analysis
- 4.4. Market Entropy
- 4.5. Patent/Trademark Analysis
- 5. Global Propeller Boss Cap Fins Pbcf Analysis, Insights and Forecast, 2020-2032
- 5.1. Market Analysis, Insights and Forecast - by Application
- 5.1.1. Tanker Vessels
- 5.1.2. Container Vessels
- 5.1.3. Bulk Vessels
- 5.2. Market Analysis, Insights and Forecast - by Type
- 5.2.1. Fixed PBCF
- 5.2.2. Adjustable PBCF
- 5.3. Market Analysis, Insights and Forecast - by Region
- 5.3.1. North America
- 5.3.2. South America
- 5.3.3. Europe
- 5.3.4. Middle East & Africa
- 5.3.5. Asia Pacific
- 5.1. Market Analysis, Insights and Forecast - by Application
- 6. North America Propeller Boss Cap Fins Pbcf Analysis, Insights and Forecast, 2020-2032
- 6.1. Market Analysis, Insights and Forecast - by Application
- 6.1.1. Tanker Vessels
- 6.1.2. Container Vessels
- 6.1.3. Bulk Vessels
- 6.2. Market Analysis, Insights and Forecast - by Type
- 6.2.1. Fixed PBCF
- 6.2.2. Adjustable PBCF
- 6.1. Market Analysis, Insights and Forecast - by Application
- 7. South America Propeller Boss Cap Fins Pbcf Analysis, Insights and Forecast, 2020-2032
- 7.1. Market Analysis, Insights and Forecast - by Application
- 7.1.1. Tanker Vessels
- 7.1.2. Container Vessels
- 7.1.3. Bulk Vessels
- 7.2. Market Analysis, Insights and Forecast - by Type
- 7.2.1. Fixed PBCF
- 7.2.2. Adjustable PBCF
- 7.1. Market Analysis, Insights and Forecast - by Application
- 8. Europe Propeller Boss Cap Fins Pbcf Analysis, Insights and Forecast, 2020-2032
- 8.1. Market Analysis, Insights and Forecast - by Application
- 8.1.1. Tanker Vessels
- 8.1.2. Container Vessels
- 8.1.3. Bulk Vessels
- 8.2. Market Analysis, Insights and Forecast - by Type
- 8.2.1. Fixed PBCF
- 8.2.2. Adjustable PBCF
- 8.1. Market Analysis, Insights and Forecast - by Application
- 9. Middle East & Africa Propeller Boss Cap Fins Pbcf Analysis, Insights and Forecast, 2020-2032
- 9.1. Market Analysis, Insights and Forecast - by Application
- 9.1.1. Tanker Vessels
- 9.1.2. Container Vessels
- 9.1.3. Bulk Vessels
- 9.2. Market Analysis, Insights and Forecast - by Type
- 9.2.1. Fixed PBCF
- 9.2.2. Adjustable PBCF
- 9.1. Market Analysis, Insights and Forecast - by Application
- 10. Asia Pacific Propeller Boss Cap Fins Pbcf Analysis, Insights and Forecast, 2020-2032
- 10.1. Market Analysis, Insights and Forecast - by Application
- 10.1.1. Tanker Vessels
- 10.1.2. Container Vessels
- 10.1.3. Bulk Vessels
- 10.2. Market Analysis, Insights and Forecast - by Type
- 10.2.1. Fixed PBCF
- 10.2.2. Adjustable PBCF
- 10.1. Market Analysis, Insights and Forecast - by Application
- 11. Competitive Analysis
- 11.1. Global Market Share Analysis 2025
- 11.2. Company Profiles
- 11.2.1 Mitsui OSK
- 11.2.1.1. Overview
- 11.2.1.2. Products
- 11.2.1.3. SWOT Analysis
- 11.2.1.4. Recent Developments
- 11.2.1.5. Financials (Based on Availability)
- 11.2.2 Misea Machinery
- 11.2.2.1. Overview
- 11.2.2.2. Products
- 11.2.2.3. SWOT Analysis
- 11.2.2.4. Recent Developments
- 11.2.2.5. Financials (Based on Availability)
- 11.2.3 Fountom
- 11.2.3.1. Overview
- 11.2.3.2. Products
- 11.2.3.3. SWOT Analysis
- 11.2.3.4. Recent Developments
- 11.2.3.5. Financials (Based on Availability)
- 11.2.4 Nakashima
- 11.2.4.1. Overview
- 11.2.4.2. Products
- 11.2.4.3. SWOT Analysis
- 11.2.4.4. Recent Developments
- 11.2.4.5. Financials (Based on Availability)
- 11.2.5 ERMA FIRST
- 11.2.5.1. Overview
- 11.2.5.2. Products
- 11.2.5.3. SWOT Analysis
- 11.2.5.4. Recent Developments
- 11.2.5.5. Financials (Based on Availability)
- 11.2.1 Mitsui OSK
List of Figures
- Figure 1: Global Propeller Boss Cap Fins Pbcf Revenue Breakdown (million, %) by Region 2025 & 2033
- Figure 2: Global Propeller Boss Cap Fins Pbcf Volume Breakdown (K, %) by Region 2025 & 2033
- Figure 3: North America Propeller Boss Cap Fins Pbcf Revenue (million), by Application 2025 & 2033
- Figure 4: North America Propeller Boss Cap Fins Pbcf Volume (K), by Application 2025 & 2033
- Figure 5: North America Propeller Boss Cap Fins Pbcf Revenue Share (%), by Application 2025 & 2033
- Figure 6: North America Propeller Boss Cap Fins Pbcf Volume Share (%), by Application 2025 & 2033
- Figure 7: North America Propeller Boss Cap Fins Pbcf Revenue (million), by Type 2025 & 2033
- Figure 8: North America Propeller Boss Cap Fins Pbcf Volume (K), by Type 2025 & 2033
- Figure 9: North America Propeller Boss Cap Fins Pbcf Revenue Share (%), by Type 2025 & 2033
- Figure 10: North America Propeller Boss Cap Fins Pbcf Volume Share (%), by Type 2025 & 2033
- Figure 11: North America Propeller Boss Cap Fins Pbcf Revenue (million), by Country 2025 & 2033
- Figure 12: North America Propeller Boss Cap Fins Pbcf Volume (K), by Country 2025 & 2033
- Figure 13: North America Propeller Boss Cap Fins Pbcf Revenue Share (%), by Country 2025 & 2033
- Figure 14: North America Propeller Boss Cap Fins Pbcf Volume Share (%), by Country 2025 & 2033
- Figure 15: South America Propeller Boss Cap Fins Pbcf Revenue (million), by Application 2025 & 2033
- Figure 16: South America Propeller Boss Cap Fins Pbcf Volume (K), by Application 2025 & 2033
- Figure 17: South America Propeller Boss Cap Fins Pbcf Revenue Share (%), by Application 2025 & 2033
- Figure 18: South America Propeller Boss Cap Fins Pbcf Volume Share (%), by Application 2025 & 2033
- Figure 19: South America Propeller Boss Cap Fins Pbcf Revenue (million), by Type 2025 & 2033
- Figure 20: South America Propeller Boss Cap Fins Pbcf Volume (K), by Type 2025 & 2033
- Figure 21: South America Propeller Boss Cap Fins Pbcf Revenue Share (%), by Type 2025 & 2033
- Figure 22: South America Propeller Boss Cap Fins Pbcf Volume Share (%), by Type 2025 & 2033
- Figure 23: South America Propeller Boss Cap Fins Pbcf Revenue (million), by Country 2025 & 2033
- Figure 24: South America Propeller Boss Cap Fins Pbcf Volume (K), by Country 2025 & 2033
- Figure 25: South America Propeller Boss Cap Fins Pbcf Revenue Share (%), by Country 2025 & 2033
- Figure 26: South America Propeller Boss Cap Fins Pbcf Volume Share (%), by Country 2025 & 2033
- Figure 27: Europe Propeller Boss Cap Fins Pbcf Revenue (million), by Application 2025 & 2033
- Figure 28: Europe Propeller Boss Cap Fins Pbcf Volume (K), by Application 2025 & 2033
- Figure 29: Europe Propeller Boss Cap Fins Pbcf Revenue Share (%), by Application 2025 & 2033
- Figure 30: Europe Propeller Boss Cap Fins Pbcf Volume Share (%), by Application 2025 & 2033
- Figure 31: Europe Propeller Boss Cap Fins Pbcf Revenue (million), by Type 2025 & 2033
- Figure 32: Europe Propeller Boss Cap Fins Pbcf Volume (K), by Type 2025 & 2033
- Figure 33: Europe Propeller Boss Cap Fins Pbcf Revenue Share (%), by Type 2025 & 2033
- Figure 34: Europe Propeller Boss Cap Fins Pbcf Volume Share (%), by Type 2025 & 2033
- Figure 35: Europe Propeller Boss Cap Fins Pbcf Revenue (million), by Country 2025 & 2033
- Figure 36: Europe Propeller Boss Cap Fins Pbcf Volume (K), by Country 2025 & 2033
- Figure 37: Europe Propeller Boss Cap Fins Pbcf Revenue Share (%), by Country 2025 & 2033
- Figure 38: Europe Propeller Boss Cap Fins Pbcf Volume Share (%), by Country 2025 & 2033
- Figure 39: Middle East & Africa Propeller Boss Cap Fins Pbcf Revenue (million), by Application 2025 & 2033
- Figure 40: Middle East & Africa Propeller Boss Cap Fins Pbcf Volume (K), by Application 2025 & 2033
- Figure 41: Middle East & Africa Propeller Boss Cap Fins Pbcf Revenue Share (%), by Application 2025 & 2033
- Figure 42: Middle East & Africa Propeller Boss Cap Fins Pbcf Volume Share (%), by Application 2025 & 2033
- Figure 43: Middle East & Africa Propeller Boss Cap Fins Pbcf Revenue (million), by Type 2025 & 2033
- Figure 44: Middle East & Africa Propeller Boss Cap Fins Pbcf Volume (K), by Type 2025 & 2033
- Figure 45: Middle East & Africa Propeller Boss Cap Fins Pbcf Revenue Share (%), by Type 2025 & 2033
- Figure 46: Middle East & Africa Propeller Boss Cap Fins Pbcf Volume Share (%), by Type 2025 & 2033
- Figure 47: Middle East & Africa Propeller Boss Cap Fins Pbcf Revenue (million), by Country 2025 & 2033
- Figure 48: Middle East & Africa Propeller Boss Cap Fins Pbcf Volume (K), by Country 2025 & 2033
- Figure 49: Middle East & Africa Propeller Boss Cap Fins Pbcf Revenue Share (%), by Country 2025 & 2033
- Figure 50: Middle East & Africa Propeller Boss Cap Fins Pbcf Volume Share (%), by Country 2025 & 2033
- Figure 51: Asia Pacific Propeller Boss Cap Fins Pbcf Revenue (million), by Application 2025 & 2033
- Figure 52: Asia Pacific Propeller Boss Cap Fins Pbcf Volume (K), by Application 2025 & 2033
- Figure 53: Asia Pacific Propeller Boss Cap Fins Pbcf Revenue Share (%), by Application 2025 & 2033
- Figure 54: Asia Pacific Propeller Boss Cap Fins Pbcf Volume Share (%), by Application 2025 & 2033
- Figure 55: Asia Pacific Propeller Boss Cap Fins Pbcf Revenue (million), by Type 2025 & 2033
- Figure 56: Asia Pacific Propeller Boss Cap Fins Pbcf Volume (K), by Type 2025 & 2033
- Figure 57: Asia Pacific Propeller Boss Cap Fins Pbcf Revenue Share (%), by Type 2025 & 2033
- Figure 58: Asia Pacific Propeller Boss Cap Fins Pbcf Volume Share (%), by Type 2025 & 2033
- Figure 59: Asia Pacific Propeller Boss Cap Fins Pbcf Revenue (million), by Country 2025 & 2033
- Figure 60: Asia Pacific Propeller Boss Cap Fins Pbcf Volume (K), by Country 2025 & 2033
- Figure 61: Asia Pacific Propeller Boss Cap Fins Pbcf Revenue Share (%), by Country 2025 & 2033
- Figure 62: Asia Pacific Propeller Boss Cap Fins Pbcf Volume Share (%), by Country 2025 & 2033
List of Tables
- Table 1: Global Propeller Boss Cap Fins Pbcf Revenue million Forecast, by Application 2020 & 2033
- Table 2: Global Propeller Boss Cap Fins Pbcf Volume K Forecast, by Application 2020 & 2033
- Table 3: Global Propeller Boss Cap Fins Pbcf Revenue million Forecast, by Type 2020 & 2033
- Table 4: Global Propeller Boss Cap Fins Pbcf Volume K Forecast, by Type 2020 & 2033
- Table 5: Global Propeller Boss Cap Fins Pbcf Revenue million Forecast, by Region 2020 & 2033
- Table 6: Global Propeller Boss Cap Fins Pbcf Volume K Forecast, by Region 2020 & 2033
- Table 7: Global Propeller Boss Cap Fins Pbcf Revenue million Forecast, by Application 2020 & 2033
- Table 8: Global Propeller Boss Cap Fins Pbcf Volume K Forecast, by Application 2020 & 2033
- Table 9: Global Propeller Boss Cap Fins Pbcf Revenue million Forecast, by Type 2020 & 2033
- Table 10: Global Propeller Boss Cap Fins Pbcf Volume K Forecast, by Type 2020 & 2033
- Table 11: Global Propeller Boss Cap Fins Pbcf Revenue million Forecast, by Country 2020 & 2033
- Table 12: Global Propeller Boss Cap Fins Pbcf Volume K Forecast, by Country 2020 & 2033
- Table 13: United States Propeller Boss Cap Fins Pbcf Revenue (million) Forecast, by Application 2020 & 2033
- Table 14: United States Propeller Boss Cap Fins Pbcf Volume (K) Forecast, by Application 2020 & 2033
- Table 15: Canada Propeller Boss Cap Fins Pbcf Revenue (million) Forecast, by Application 2020 & 2033
- Table 16: Canada Propeller Boss Cap Fins Pbcf Volume (K) Forecast, by Application 2020 & 2033
- Table 17: Mexico Propeller Boss Cap Fins Pbcf Revenue (million) Forecast, by Application 2020 & 2033
- Table 18: Mexico Propeller Boss Cap Fins Pbcf Volume (K) Forecast, by Application 2020 & 2033
- Table 19: Global Propeller Boss Cap Fins Pbcf Revenue million Forecast, by Application 2020 & 2033
- Table 20: Global Propeller Boss Cap Fins Pbcf Volume K Forecast, by Application 2020 & 2033
- Table 21: Global Propeller Boss Cap Fins Pbcf Revenue million Forecast, by Type 2020 & 2033
- Table 22: Global Propeller Boss Cap Fins Pbcf Volume K Forecast, by Type 2020 & 2033
- Table 23: Global Propeller Boss Cap Fins Pbcf Revenue million Forecast, by Country 2020 & 2033
- Table 24: Global Propeller Boss Cap Fins Pbcf Volume K Forecast, by Country 2020 & 2033
- Table 25: Brazil Propeller Boss Cap Fins Pbcf Revenue (million) Forecast, by Application 2020 & 2033
- Table 26: Brazil Propeller Boss Cap Fins Pbcf Volume (K) Forecast, by Application 2020 & 2033
- Table 27: Argentina Propeller Boss Cap Fins Pbcf Revenue (million) Forecast, by Application 2020 & 2033
- Table 28: Argentina Propeller Boss Cap Fins Pbcf Volume (K) Forecast, by Application 2020 & 2033
- Table 29: Rest of South America Propeller Boss Cap Fins Pbcf Revenue (million) Forecast, by Application 2020 & 2033
- Table 30: Rest of South America Propeller Boss Cap Fins Pbcf Volume (K) Forecast, by Application 2020 & 2033
- Table 31: Global Propeller Boss Cap Fins Pbcf Revenue million Forecast, by Application 2020 & 2033
- Table 32: Global Propeller Boss Cap Fins Pbcf Volume K Forecast, by Application 2020 & 2033
- Table 33: Global Propeller Boss Cap Fins Pbcf Revenue million Forecast, by Type 2020 & 2033
- Table 34: Global Propeller Boss Cap Fins Pbcf Volume K Forecast, by Type 2020 & 2033
- Table 35: Global Propeller Boss Cap Fins Pbcf Revenue million Forecast, by Country 2020 & 2033
- Table 36: Global Propeller Boss Cap Fins Pbcf Volume K Forecast, by Country 2020 & 2033
- Table 37: United Kingdom Propeller Boss Cap Fins Pbcf Revenue (million) Forecast, by Application 2020 & 2033
- Table 38: United Kingdom Propeller Boss Cap Fins Pbcf Volume (K) Forecast, by Application 2020 & 2033
- Table 39: Germany Propeller Boss Cap Fins Pbcf Revenue (million) Forecast, by Application 2020 & 2033
- Table 40: Germany Propeller Boss Cap Fins Pbcf Volume (K) Forecast, by Application 2020 & 2033
- Table 41: France Propeller Boss Cap Fins Pbcf Revenue (million) Forecast, by Application 2020 & 2033
- Table 42: France Propeller Boss Cap Fins Pbcf Volume (K) Forecast, by Application 2020 & 2033
- Table 43: Italy Propeller Boss Cap Fins Pbcf Revenue (million) Forecast, by Application 2020 & 2033
- Table 44: Italy Propeller Boss Cap Fins Pbcf Volume (K) Forecast, by Application 2020 & 2033
- Table 45: Spain Propeller Boss Cap Fins Pbcf Revenue (million) Forecast, by Application 2020 & 2033
- Table 46: Spain Propeller Boss Cap Fins Pbcf Volume (K) Forecast, by Application 2020 & 2033
- Table 47: Russia Propeller Boss Cap Fins Pbcf Revenue (million) Forecast, by Application 2020 & 2033
- Table 48: Russia Propeller Boss Cap Fins Pbcf Volume (K) Forecast, by Application 2020 & 2033
- Table 49: Benelux Propeller Boss Cap Fins Pbcf Revenue (million) Forecast, by Application 2020 & 2033
- Table 50: Benelux Propeller Boss Cap Fins Pbcf Volume (K) Forecast, by Application 2020 & 2033
- Table 51: Nordics Propeller Boss Cap Fins Pbcf Revenue (million) Forecast, by Application 2020 & 2033
- Table 52: Nordics Propeller Boss Cap Fins Pbcf Volume (K) Forecast, by Application 2020 & 2033
- Table 53: Rest of Europe Propeller Boss Cap Fins Pbcf Revenue (million) Forecast, by Application 2020 & 2033
- Table 54: Rest of Europe Propeller Boss Cap Fins Pbcf Volume (K) Forecast, by Application 2020 & 2033
- Table 55: Global Propeller Boss Cap Fins Pbcf Revenue million Forecast, by Application 2020 & 2033
- Table 56: Global Propeller Boss Cap Fins Pbcf Volume K Forecast, by Application 2020 & 2033
- Table 57: Global Propeller Boss Cap Fins Pbcf Revenue million Forecast, by Type 2020 & 2033
- Table 58: Global Propeller Boss Cap Fins Pbcf Volume K Forecast, by Type 2020 & 2033
- Table 59: Global Propeller Boss Cap Fins Pbcf Revenue million Forecast, by Country 2020 & 2033
- Table 60: Global Propeller Boss Cap Fins Pbcf Volume K Forecast, by Country 2020 & 2033
- Table 61: Turkey Propeller Boss Cap Fins Pbcf Revenue (million) Forecast, by Application 2020 & 2033
- Table 62: Turkey Propeller Boss Cap Fins Pbcf Volume (K) Forecast, by Application 2020 & 2033
- Table 63: Israel Propeller Boss Cap Fins Pbcf Revenue (million) Forecast, by Application 2020 & 2033
- Table 64: Israel Propeller Boss Cap Fins Pbcf Volume (K) Forecast, by Application 2020 & 2033
- Table 65: GCC Propeller Boss Cap Fins Pbcf Revenue (million) Forecast, by Application 2020 & 2033
- Table 66: GCC Propeller Boss Cap Fins Pbcf Volume (K) Forecast, by Application 2020 & 2033
- Table 67: North Africa Propeller Boss Cap Fins Pbcf Revenue (million) Forecast, by Application 2020 & 2033
- Table 68: North Africa Propeller Boss Cap Fins Pbcf Volume (K) Forecast, by Application 2020 & 2033
- Table 69: South Africa Propeller Boss Cap Fins Pbcf Revenue (million) Forecast, by Application 2020 & 2033
- Table 70: South Africa Propeller Boss Cap Fins Pbcf Volume (K) Forecast, by Application 2020 & 2033
- Table 71: Rest of Middle East & Africa Propeller Boss Cap Fins Pbcf Revenue (million) Forecast, by Application 2020 & 2033
- Table 72: Rest of Middle East & Africa Propeller Boss Cap Fins Pbcf Volume (K) Forecast, by Application 2020 & 2033
- Table 73: Global Propeller Boss Cap Fins Pbcf Revenue million Forecast, by Application 2020 & 2033
- Table 74: Global Propeller Boss Cap Fins Pbcf Volume K Forecast, by Application 2020 & 2033
- Table 75: Global Propeller Boss Cap Fins Pbcf Revenue million Forecast, by Type 2020 & 2033
- Table 76: Global Propeller Boss Cap Fins Pbcf Volume K Forecast, by Type 2020 & 2033
- Table 77: Global Propeller Boss Cap Fins Pbcf Revenue million Forecast, by Country 2020 & 2033
- Table 78: Global Propeller Boss Cap Fins Pbcf Volume K Forecast, by Country 2020 & 2033
- Table 79: China Propeller Boss Cap Fins Pbcf Revenue (million) Forecast, by Application 2020 & 2033
- Table 80: China Propeller Boss Cap Fins Pbcf Volume (K) Forecast, by Application 2020 & 2033
- Table 81: India Propeller Boss Cap Fins Pbcf Revenue (million) Forecast, by Application 2020 & 2033
- Table 82: India Propeller Boss Cap Fins Pbcf Volume (K) Forecast, by Application 2020 & 2033
- Table 83: Japan Propeller Boss Cap Fins Pbcf Revenue (million) Forecast, by Application 2020 & 2033
- Table 84: Japan Propeller Boss Cap Fins Pbcf Volume (K) Forecast, by Application 2020 & 2033
- Table 85: South Korea Propeller Boss Cap Fins Pbcf Revenue (million) Forecast, by Application 2020 & 2033
- Table 86: South Korea Propeller Boss Cap Fins Pbcf Volume (K) Forecast, by Application 2020 & 2033
- Table 87: ASEAN Propeller Boss Cap Fins Pbcf Revenue (million) Forecast, by Application 2020 & 2033
- Table 88: ASEAN Propeller Boss Cap Fins Pbcf Volume (K) Forecast, by Application 2020 & 2033
- Table 89: Oceania Propeller Boss Cap Fins Pbcf Revenue (million) Forecast, by Application 2020 & 2033
- Table 90: Oceania Propeller Boss Cap Fins Pbcf Volume (K) Forecast, by Application 2020 & 2033
- Table 91: Rest of Asia Pacific Propeller Boss Cap Fins Pbcf Revenue (million) Forecast, by Application 2020 & 2033
- Table 92: Rest of Asia Pacific Propeller Boss Cap Fins Pbcf Volume (K) Forecast, by Application 2020 & 2033
Frequently Asked Questions
1. What is the projected Compound Annual Growth Rate (CAGR) of the Propeller Boss Cap Fins Pbcf?
The projected CAGR is approximately XXX%.
2. Which companies are prominent players in the Propeller Boss Cap Fins Pbcf?
Key companies in the market include Mitsui OSK, Misea Machinery, Fountom, Nakashima, ERMA FIRST.
3. What are the main segments of the Propeller Boss Cap Fins Pbcf?
The market segments include Application, Type.
4. Can you provide details about the market size?
The market size is estimated to be USD XXX million as of 2022.
5. What are some drivers contributing to market growth?
N/A
6. What are the notable trends driving market growth?
N/A
7. Are there any restraints impacting market growth?
N/A
8. Can you provide examples of recent developments in the market?
N/A
9. What pricing options are available for accessing the report?
Pricing options include single-user, multi-user, and enterprise licenses priced at USD 3950.00, USD 5925.00, and USD 7900.00 respectively.
10. Is the market size provided in terms of value or volume?
The market size is provided in terms of value, measured in million and volume, measured in K.
11. Are there any specific market keywords associated with the report?
Yes, the market keyword associated with the report is "Propeller Boss Cap Fins Pbcf," which aids in identifying and referencing the specific market segment covered.
12. How do I determine which pricing option suits my needs best?
The pricing options vary based on user requirements and access needs. Individual users may opt for single-user licenses, while businesses requiring broader access may choose multi-user or enterprise licenses for cost-effective access to the report.
13. Are there any additional resources or data provided in the Propeller Boss Cap Fins Pbcf report?
While the report offers comprehensive insights, it's advisable to review the specific contents or supplementary materials provided to ascertain if additional resources or data are available.
14. How can I stay updated on further developments or reports in the Propeller Boss Cap Fins Pbcf?
To stay informed about further developments, trends, and reports in the Propeller Boss Cap Fins Pbcf, consider subscribing to industry newsletters, following relevant companies and organizations, or regularly checking reputable industry news sources and publications.
Methodology
Step 1 - Identification of Relevant Samples Size from Population Database


Step 2 - Approaches for Defining Global Market Size (Value, Volume* & Price*)

Note*: In applicable scenarios
Step 3 - Data Sources
Primary Research
- Web Analytics
- Survey Reports
- Research Institute
- Latest Research Reports
- Opinion Leaders
Secondary Research
- Annual Reports
- White Paper
- Latest Press Release
- Industry Association
- Paid Database
- Investor Presentations

Step 4 - Data Triangulation
Involves using different sources of information in order to increase the validity of a study
These sources are likely to be stakeholders in a program - participants, other researchers, program staff, other community members, and so on.
Then we put all data in single framework & apply various statistical tools to find out the dynamic on the market.
During the analysis stage, feedback from the stakeholder groups would be compared to determine areas of agreement as well as areas of divergence